Top Tweets for #InformationVisualization

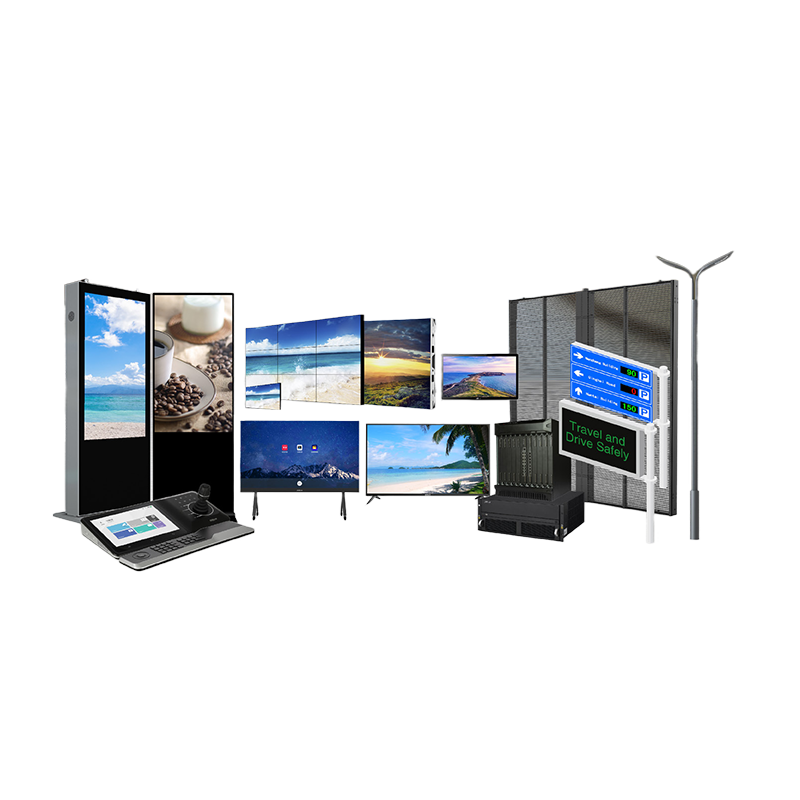
Integrated Display and Control Device
🔹 Ultra-High-Definition Large-Screen Display
🔹 Integrated Centralized Management and Control
🔹 Professionally Stable, Customizable on Demand
🌐 Learn more:https://t.co/uUK2fRPW74
#DataVisualization #InformationVisualization #Smart #IoT

At #IV2025, the keynote, Prof. Dr. Jörn Kohlhammer shares how user-centred visual analytics integrates AI for impactful decision support
📍 Don’t miss this keynote at #IV2025
#InformationVisualization #VisualAnalytics #HumanCenteredAI

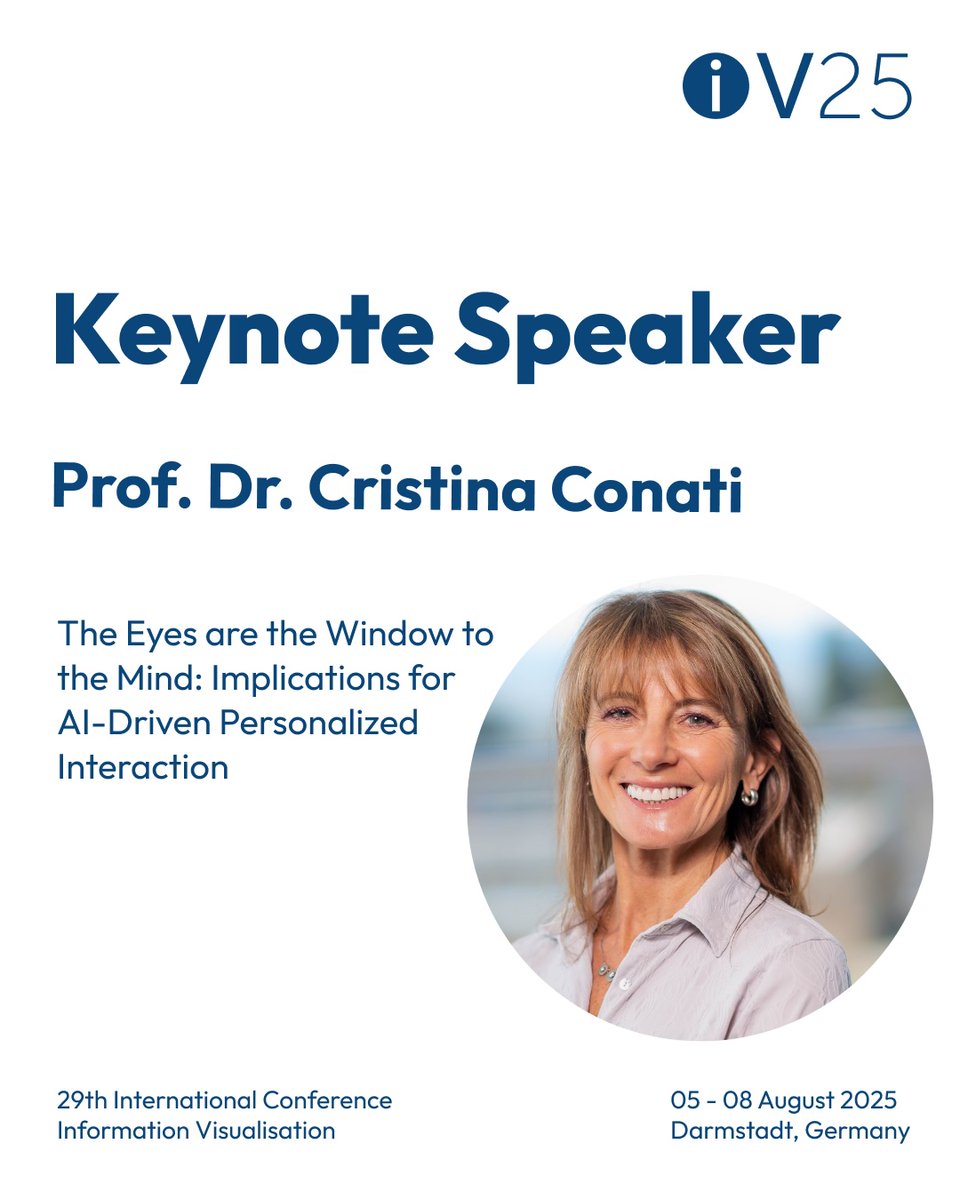
At IV2025, keynote speaker Dr. Cristina Conati (UBC) explores how eye-tracking can support human-centered AI.
Interested in attending? You can register on the conference website: https://t.co/uPUTxjcZqf
#IV2025 #InformationVisualization #HumanCenteredAI #AI
Call for Papers: MuVis 2025
Aug 5–8, 2025
Darmstadt, Germany
Explore analogies between visual and musical structures for effective #MusicVisualization.
🔗 https://t.co/ix7od8VP52
#MusicVisualization #VisualMusic #Synesthesia #DataAnalytics #InformationVisualization #IV25

Explore the synergy of #HCI & #InformationVisualization:
🔹 AI-augmented UX
🔹 Cognitive & perceptual interfaces
🔹 Visual analytics & user interaction
🔹 Adaptive, accessible systems
Focused on evaluating #InformationVisualization tools & systems:
🔹 User studies & UX research
🔹 Insight-based evaluation
🔹 Benchmarking & validation
🔹 Ethics & reproducibility

How industrial display device improves information visualization
for more:https://t.co/9U7NPgnWG9
#InformationVisualization
#IndustrialDisplays
#HumanMachineInterface
#DataVisualization
#SmartManufacturing
#IndustrialAutomation
#UserInterfaceDesign
#OperationalEfficiency


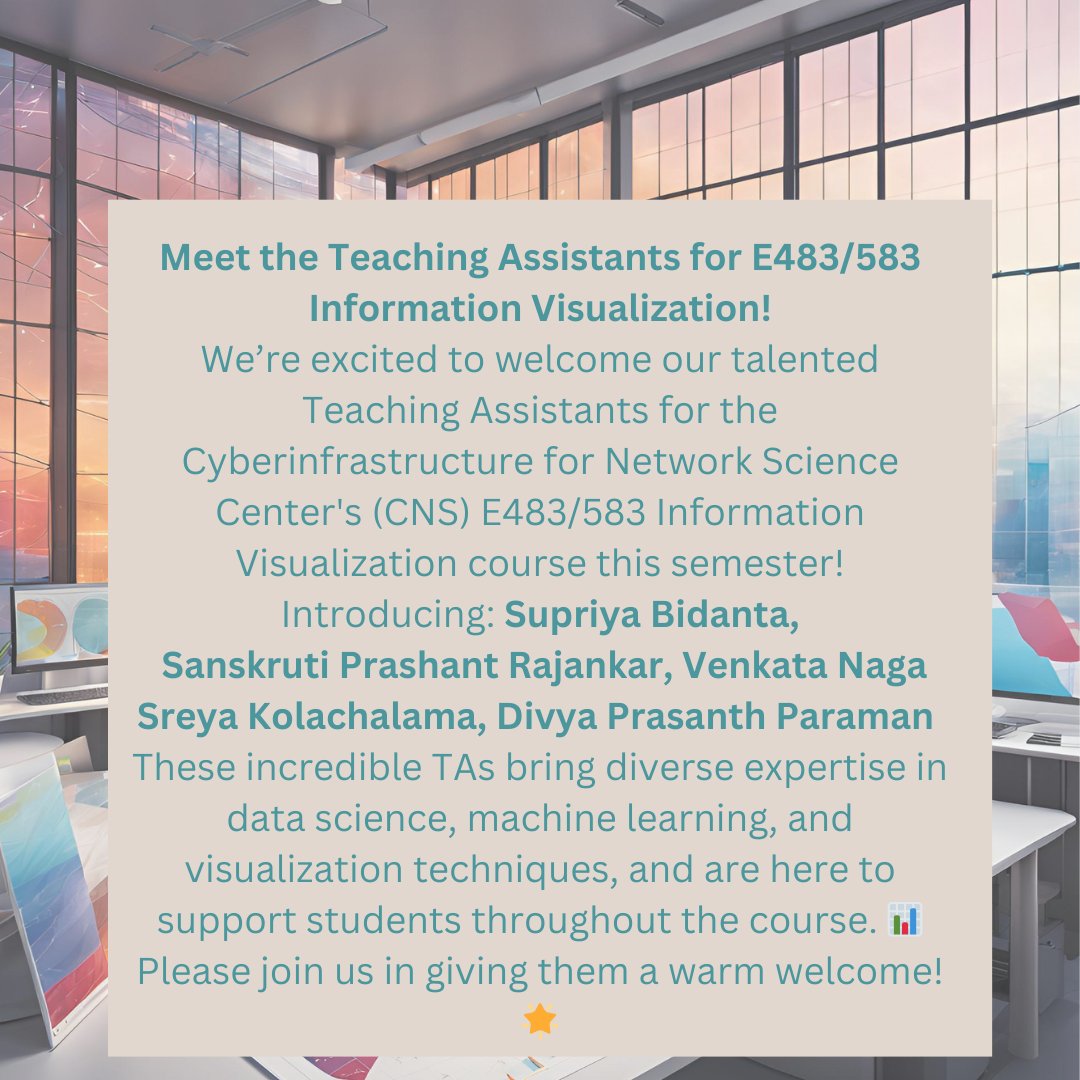
📢Meet the Teaching Assistants for E483/583: Supriya Bidanta, Sanskruti Prashant Rajankar, Venkata Naga Sreya Kolachalama, Divya Prasanth Paraman.Please join us in giving them a warm welcome! #Team #InformationVisualization #DataScience #TeachingExcellence @IULuddy @katycns
🚨 Sign up for Spring 2025: ENGR-E 583 - Information Visualization (3 CR.)! Learn to visualize abstract data for various users & tasks.🌐💻Learn more: https://t.co/IPsnyJUjz9
#IndianaUniversity #InformationVisualization #DataVisualization #Spring2025 @katycns @AndreasBueckle

"Visual Variables are basic symbols in data visualization - can they convey info like words? 🤔 Revolutionizing cartography since the 30s! #DataViz #InformationVisualization #JaquesBertin" https://t.co/MLKE75kxkf

Our new #DataMatters offering, Intermediate Effective #InformationVisualization, participants will experience how commonly available software can be used to create compelling #visualizations + learn #infoviz principles that will create impactful products.
https://t.co/jXtmNURMej

Our new #DataMatters offering, Intermediate Effective #InformationVisualization, participants will experience how commonly available software can be used to create compelling #visualizations + learn #infoviz principles that will create impactful products.
https://t.co/jXtmNURMej


Participants needed for top-ranked study on SurveyCircle:
"Evaluation of prototype for visualized privacy information on YouTube" https://t.co/VmD2FNvJaV via @SurveyCircle #georgiatech
#ProductEvaluation #OnlinePrivacy #youtube #InformationVisualization #hci


Participants needed for top-ranked study on SurveyCircle:
"Evaluation of prototype for visualized privacy information on YouTube" https://t.co/itiuOjhpG1 via @SurveyCircle #georgiatech
#ProductEvaluation #OnlinePrivacy #youtube #InformationVisualization #hci


Participants needed for online survey!
Topic: "Evaluation of prototype for visualized privacy information on YouTube" https://t.co/l5lqT85QMG via @SurveyCircle #georgiatech
#ProductEvaluation #OnlinePrivacy #youtube #InformationVisualization #hci


Marian Dörk is a research professor for #InformationVisualization & Management at the Design Department and the Institute for Urban Futures of the University of Applied Sciences Potsdam. Check out more of his work at https://t.co/XwE4pEj4HI.

🎲 Mind maps, popularized by Tony Buzan in the 1970s, are graphical tools that organize and visualize information. They date back centuries and center around a core concept with branching ideas. #MindMaps #InformationVisualization 🎲


#DataMatters instructor @EricEMonson is a #dataviz specialist with @DukeLibraries' #Data + #Visualization Services. He will be teaching the course “Intro to Effective #InformationVisualization.” @duke_data #tableau #infoviz #datascience #bigdata @DukeU
https://t.co/eEFkcZ2VvZ

Interested in learning about #dataviz? Our #DataMatters course “Intro to Effective #InformationVisualization” teaches students how to go beyond the defaults + create eye-catching, impactful figures that even beginners will feel comfortable embarking on!
https://t.co/FfxsV3x1gN

Last Seen Hashtags on Sotwe
Kalyani
Seen from India
พนัสนิคม
Seen from Thailand
DuaEdiyorum
Seen from United States
DiasMelhoresVirao
Seen from Venezuela
diegobarros
Seen from Brazil
valeng222
Seen from Colombia
willow ryder
Seen from Indonesia
cewekgagged
Seen from Indonesia
inmoodforranting
Seen from Netherlands
openBOjogja
Seen from Indonesia
Trends for you
Most Popular Users

Elon Musk 
@elonmusk
240.1M followers

Barack Obama
@barackobama
119.3M followers

Donald J. Trump
@realdonaldtrump
111.6M followers

Cristiano Ronaldo
@cristiano
108.7M followers

Narendra Modi
@narendramodi
106.9M followers

Rihanna
@rihanna
97.2M followers

NASA
@nasa
92.1M followers

Justin Bieber
@justinbieber
90.5M followers

KATY PERRY
@katyperry
86.7M followers

Taylor Swift
@taylorswift13
80.5M followers

Lady Gaga
@ladygaga
72.1M followers

Kim Kardashian
@kimkardashian
69.3M followers

YouTube
@youtube
68.6M followers

Virat Kohli
@imvkohli
68.4M followers

Bill Gates
@billgates
63.4M followers

The Ellen Show
@theellenshow
62.5M followers

CNN
@cnn
61.9M followers

Neymar Jr
@neymarjr
60.9M followers

X
@x
60.9M followers

CNN Breaking News
@cnnbrk
59.9M followers