AI, data visualization, digital mapping, R, and much more in our twenty-three data workshops this fall! All are welcome. Learn more at: https://t.co/p8KPnpqNDS #workshops
Happening in one week! Join us for a webinar on June 15 from 12-1pm. We hope to see you there! 😎
Register: https://t.co/SmLZlvj5eH
Read more: https://t.co/csE4HHXTeE
Visualizing the US population age 85 and up by county, thanks to the brand-new 2020 US Census data and the latest release of #tidycensus for #rstats.
To learn how to analyze Census data and make maps yourselves, reserve a spot in my workshops in June: https://t.co/K5jKjx84om
Hi R folks! Want to add some JavaScript to your data science summer? 🌞⛱️ We've got resources to get you swimming w/ data wrangling, viz, & analysis in JS🧡
- 📈Observable Plot from ggplot2: https://t.co/QeAkiX9ofc
- 🛠️Data wrangling in Arquero: https://t.co/1siiwagwVP
🧵1/3
Thinking about tools for next academic year's teaching? Or taking a break from thinking about teaching and trying to get some papers out? Here are some of my favourite and most used #QuartoPub features as an academic.
Been hearing about #QuartoPub but didn't give it a try yet? Perused the get started pages but would like another intro? Or want to pick up a few Quarto tips? Here is a Get Started with Quarto with #rstats and RStudio video for you!
https://t.co/osn3JpcUtU
We are happy to announce that Quarto 1.3 has been released! 🎉
Just some of the awesome new features:
✏️ Code annotation
📒Multi-format publishing
🐍 Jupyter Notebook cell embedding
📘Publish Quarto to Confluence
https://t.co/dr79FSpkKv
#QuartoPub#RStats#Python
Read and explore this rich interactive of 20 *million* research articles from PubMed, a project we're releasing today with @ritagonmar and @hippopedoid. It's a *beautiful* embedding structure, a fascinating, complete corpus. Some highlights (thread) https://t.co/qzcZd2eKnB
Happy to be part of the @WeAreDCN CURATED presentation @NIH- we're also happy to consult @Duke on NIH Data Management and Sharing Policy and data management in general! #datamanagement
Hello from Bethesda, Maryland! We are at @NIHDataScience for a CURATE(D) workshop (#DCN_NIH23). We've had a busy morning, including this overview of consent language provided by Jen Darragh of @duke_data.
Hi all! If you want to...
🛠️Learn some basic JavaScript for data wrangling & analysis
📒Get started working in @observablehq
📈Build interactive charts w/ Observable Plot
✨ Register for our free intro course! 4x 1-hr sessions starting Apr 19 https://t.co/pOGCDvZ223
Ever wonder how you would do code a particular data operation in Python, R, SQL, Javascript, or Excel? @allison_horst has you covered: https://t.co/zwmUPcMnGa
Last month, I gave a series of free workshops on ACS / spatial data in #rstats and #Python with @UMSSDAN
If you missed them, not to worry! Check out these free materials:
Workshop videos on YouTube: https://t.co/RA1UgiqZOI
Workshop code and slides: https://t.co/oGCuGm1FBr
I tweet a lot about Census data in the US, but there are many fantastic #rstats packages to help you get demographic insights from all over the world.
A thread on R packages for 10 countries you should check out:
Join @CedScherer on March 9th for a masterclass on Designing Charts in R. The course will cover all relevant steps from importing the data set to creating and exporting high-quality graphics entirely produced with code. Spots are limited. Register here: https://t.co/hv53sXvLpA
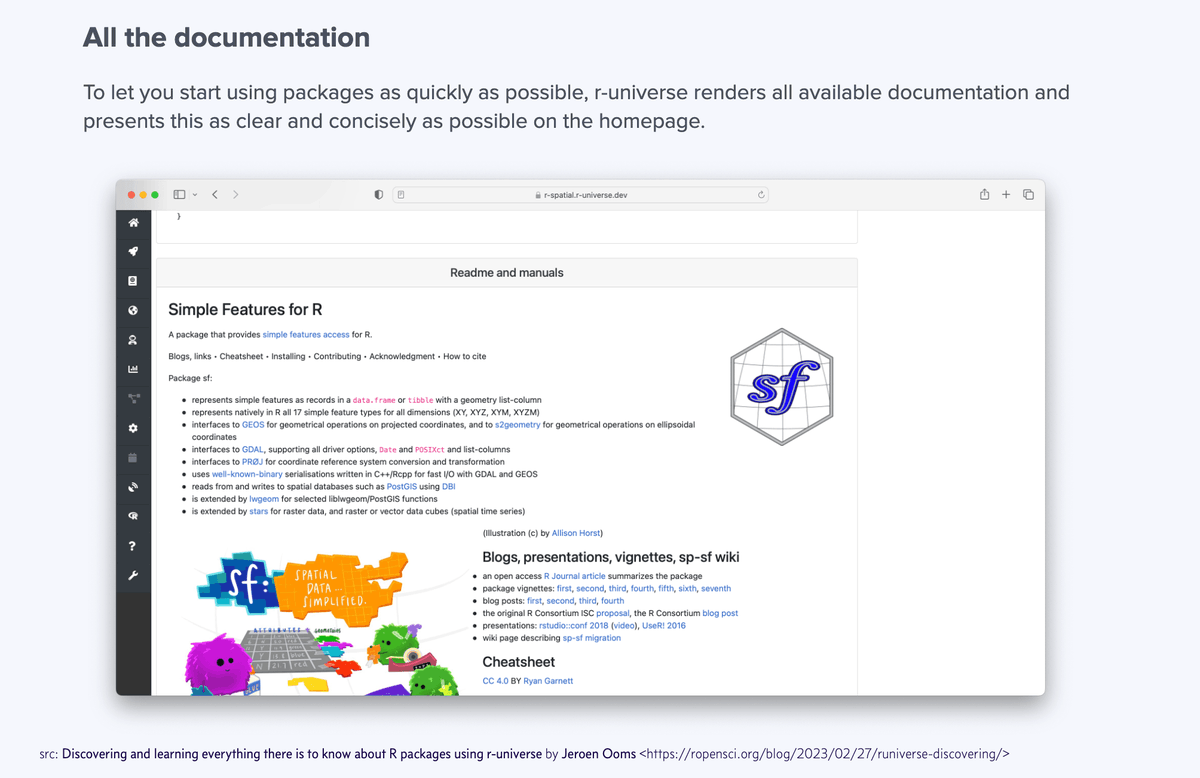
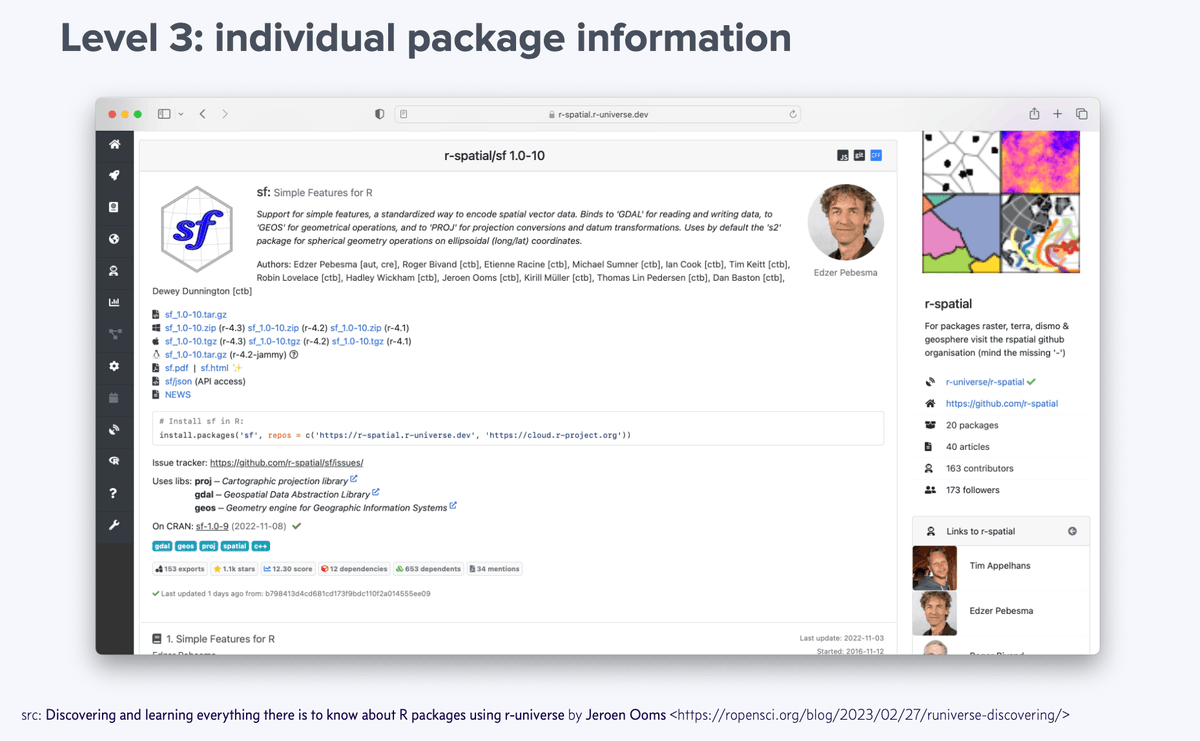
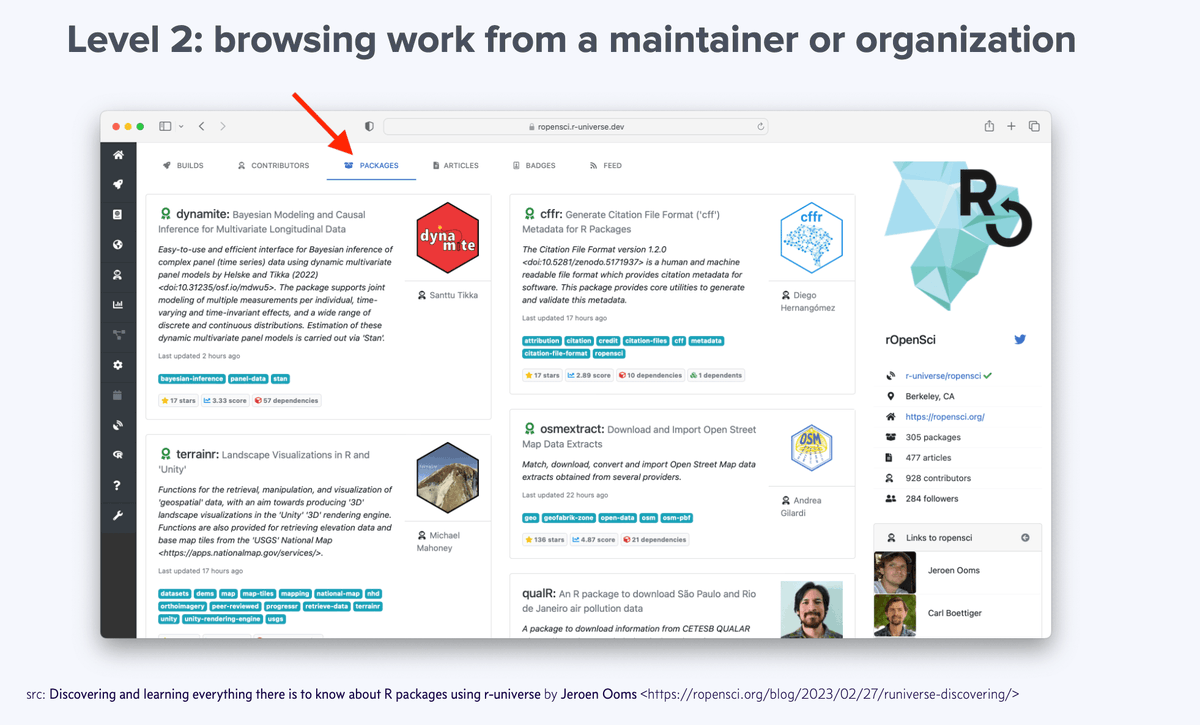
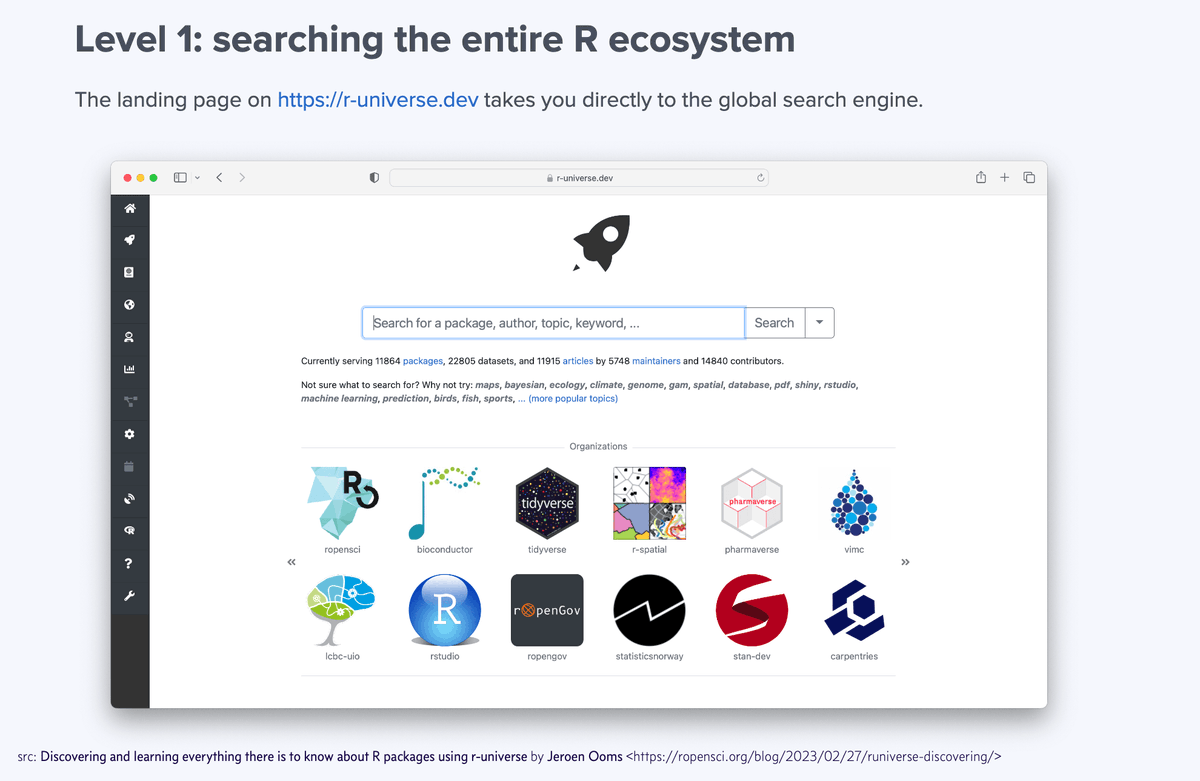
🔭 Get to know the immensely powerful r-universe:
🪐 “Discovering and learning everything there is to know about R packages using r-universe” by @opencpu
https://t.co/INE5XjbulU #RStats
We are excited to announce that #FOSS4GNA will be happening this year in Baltimore from October 23-25th this year. More details to come in the next few weeks. #FOSS4G#OSGeo#OSGeoUS