Top Tweets for #PostgresMarathon

#PostgresMarathon 2-013: Why keep your index set lean
Unused indexes are silent performance killers. They slow writes, bloat backups, and complicate query planning.
In this post I explore 6 reasons to audit your indexes regularly – essential practices we always use in production with databases of mid to large scale (100 GB to 10+ TiB):
https://t.co/MbjCDmFNNb

Nikolay Samokhvalov (@samokhvalov): #PostgresMarathon 2-013: Why keep your index set lean https://t.co/o02EfPygD4
#PostgresMarathon 2-012: Ultra-fast replica creation with pgBackRest https://t.co/htbWR2YQ2Q
Couldn't believe the numbers: 35 TiB/h copying PGDATA from one EC2 instance to another.
That's fast enough to clone a 10 TiB production database in ~17 minutes.
Modern hardware + pgBackRest trick = game changer for zero-downtime operations at scale
Credit: Maxim Boguk, Postgres expert I've known for years, who now helps the @postgres_ai team excel with really large systems
[Chart showing throughput progression from 3.9 TiB/hour to 35+ TiB/hour when involving more processes]
![samokhvalov's tweet photo. #PostgresMarathon 2-012: Ultra-fast replica creation with pgBackRest https://t.co/htbWR2YQ2Q
Couldn't believe the numbers: 35 TiB/h copying PGDATA from one EC2 instance to another.
That's fast enough to clone a 10 TiB production database in ~17 minutes.
Modern hardware + pgBackRest trick = game changer for zero-downtime operations at scale
Credit: Maxim Boguk, Postgres expert I've known for years, who now helps the @postgres_ai team excel with really large systems
[Chart showing throughput progression from 3.9 TiB/hour to 35+ TiB/hour when involving more processes]](https://pbs.twimg.com/media/G5DaaWubIAAfzrX.png)
Nikolay Samokhvalov (@samokhvalov): #PostgresMarathon 2-011: Prepared statements and partitioned tables — the par... https://t.co/6pNtH3wAzt
#PostgresMarathon 2-011: Prepared statements and partitioned tables – the paradox, part 3
In #PostgresMarathon 2-009 and 2-010, we explored why execution 6 causes a lock explosion when building a generic plan for partitioned tables -- the planner must lock all 52 relations because it can't prune without parameter values.
Today we'll test what actually happens with different plan_cache_mode settings.
Let's test empirically on Postgres 18 with the 12-partition table from the previous posts. This time, we'll insert 1M rows into each partition to get realistic query plans with index scans:
-- Insert 1M rows into each partition
do $$
declare
i int;
start_date date;
partition_name text;
begin
for i in 0..11 loop
start_date := '2024-01-01'::date + make_interval(months => i);
partition_name := 'events_' || to_char(start_date, 'YYYY_MM');
execute format(
'insert into %I (event_id, event_time, event_data)
select s, %L::timestamptz + (s * interval ''1 second''), ''data_'' || s
from generate_series(1, 1000000) s',
partition_name, start_date
);
end loop;
end $$;
vacuum analyze events;
Now let's see what different plan_cache_mode settings do.
Test 1: auto mode
As we already saw, with the default auto mode setting, Postgres decides whether to use custom or generic plans based on cost comparison. We saw, that first 5 runs it uses custom plan, then, on the important 6th call, it builds the generic plan (and we have the "lock explosion" we already studied), and then, on 7th call and further, it uses the generic plan.
But that was on empty tables. Here things will be different, because we have data. Let's see.
As before, prepare a statement and execute it multiple times, observing the number of relation-level locks and plan type counters:
prepare test (timestamptz) as
select event_id, event_data from events where event_time = $1;
-- Run this snippet to test each execution
begin;
explain (verbose) execute test(timestamptz '2024-06-06 00:00:00+00');
select
count(*) as lock_count,
array_agg(
distinct relation::regclass
order by relation::regclass
) filter (where relation is not null) as relations_locked
from pg_locks
where
pid = pg_backend_pid()
and relation::regclass::text ~ 'events';
select
generic_plans,
custom_plans
from pg_prepared_statements
where name = 'test';
rollback;
After running this 10 times:
generic_plans | custom_plans
--------------+-------------
0 | 10
With empty tables (as in part 1), Postgres switched to generic plans after execution 6 because the cost was acceptable. With data and index scans, the generic plan cost is too high due to accessing all partitions, so Postgres continues using custom plans indefinitely. Lock behavior: 8 locks on executions 1-5 and 7+ (parent table + 1 partition + their 6 indexes), but 52 locks on execution 6 when building the generic plan for cost evaluation (even though it's ultimately rejected).
Note: Our example uses only 12 partitions. With 365 daily partitions (1 year) or 1000+ partitions, the lock explosion becomes severe: 1000 partitions with 3 indexes each = 4000+ locks during generic plan building, with most of these locks acquired with fastpath=false. As explained in 2-004, only the first 16 locks can use the fastpath — locks beyond that require accessing the shared lock manager, causing significant performance degradation under contention.
Test 2: force_generic_plan
When we force Postgres to use generic plans, the behavior changes dramatically:
set plan_cache_mode = 'force_generic_plan';
prepare test2 (timestamptz) as
select event_id, event_data from events where event_time = $1;
Execution 1 has two phases:
QUERY PLAN:
Append (cost=0.00..8.50 rows=12 width=38)
Subplans Removed: 11
-> Index Scan using events_2024_06_event_time_idx on events_2024_06
Index Cond: (event_time = $1)
Planning phase: 52 locks (parent + 12 partitions + 36 indexes)
Execution phase: 13 locks (parent + 12 partitions, no indexes)
generic_plans: 1, custom_plans: 0
During the planning phase, Postgres must lock all relations (parent table + all partitions + all their indexes) to build the generic plan — 52 locks total. Then during the execution phase, AcquireExecutorLocks() locks only the parent and all partitions (13 locks), not the indexes.
Execution 2 and beyond use the cached generic plan:
QUERY PLAN:
Append (cost=0.00..8.50 rows=12 width=38)
Subplans Removed: 11
-> Index Scan using events_2024_06_event_time_idx on events_2024_06
Index Cond: (event_time = $1)
Locks: 13 (parent + ALL 12 partitions, no indexes)
Locked tables: events, events_2024_01, events_2024_02, ..., events_2024_12
generic_plans: 2+, custom_plans: 0
Even though runtime pruning eliminates 11 partitions and the EXPLAIN shows only events_2024_06 being scanned, AcquireExecutorLocks() locks all 12 partitions because they're all in the generic plan's range table. The 13 locks represent the parent table plus all 12 partitions — notably, no index locks are acquired during execution (indexes were locked during planning). This is the O(n) problem — with 1000 partitions, you'd lock 1001 relations on every execution.
Test 3: force_custom_plan
With force_custom_plan, behavior is consistent:
set plan_cache_mode = 'force_custom_plan';
prepare test3 (timestamptz) as
select event_id, event_data from events where event_time = $1;
Every execution produces:
QUERY PLAN:
Index Scan using events_2024_06_event_time_idx on events_2024_06
Index Cond: (event_time = '2024-06-06 00:00:00+00')
Locks: 8 (parent + 1 partition + their 6 indexes)
generic_plans: 0, custom_plans: 1+
Consistent, predictable, efficient — but requires re-planning every time.
Summary for testing with data:
Now here's where it gets weird. Remember why we use prepared statements with generic plans in the first place? From 2-008, we learned that prepared statements help reduce LWLock:LockManager contention by switching from planner locks to executor locks. And, of course, prepared statements, by design, are aimed to get rid of the planning time, which is supposed to improve overall latencies.
For unpartitioned tables, this works beautifully. Custom plans during executions 1-5 acquire 6 locks (planner locks on all indexes), while generic plans from execution 7 onward acquire only 1 lock (executor lock on the table). We invented this optimization to avoid lock contention.
But with partitioned tables, the solution becomes the problem. Custom plans acquire 8 locks (parent + 1 partition + indexes), which is efficient. Generic plan building in execution 1 causes a lock explosion of 52 locks. Subsequent executions with the cached generic plan acquire 13 locks (all partitions) every time. The optimization we came for actually increases lock contention.
Isn't it an irony? We use prepared statements to avoid re-planning and reduce lock contention, but with partitioned tables, we need to disable the prepared statement optimization (plan caching) to avoid lock contention.
The obvious question arises: doesn't re-planning on every execution have overhead? Yes, and this is the real trade-off. With force_custom_plan, you get consistent 8 locks every time and no lock explosion risk, but you pay planning overhead on every execution and lose plan caching benefits. With force_generic_plan, you pay planning cost once and cache the result, avoiding re-planning overhead, but execution 1 causes 52 locks (again, this is in our simple case, with just 12 partitions and 4 indexes) and execution 2+ causes 13 locks with O(n) scaling relative to partition count.
Is planning overhead worse than locking overhead? With partitioned tables, planning involves partition pruning logic. With 12 partitions, planning is fast. In some cases, planning may be expensive. The O(n) locking overhead typically dominates the planning cost, especially with many partitions.
Amit Langote has been working on this problem, with preparatory work in early 2025. The main optimization to move runtime pruning before AcquireExecutorLocks() is still work in progress, discussed in https://t.co/LSJSBiyvRv. When this lands, executor lock acquisition will only lock the partitions that survive runtime pruning, so generic plan execution 2+ would acquire only 8 locks (parent + 1 partition + indexes), making generic plans viable again for partitioned tables.
There's still a catch: the planner's cost estimation still sees generic plans as expensive, so even with the optimization, auto mode may keep choosing custom plans. As Amit notes in his 2022 blog post https://t.co/nAyJrO2yxe, "Till that's also fixed, users will need to use plan_cache_mode = force_generic_plan to have plan caching for partitions." This recommendation applies to future Postgres versions with his locking optimization — for current versions without it, the situation is different.
Note: Throughout this post, we've been examining SQL-level prepared statements (created with PREPARE/EXECUTE commands). Most applications use protocol-level prepared statements through drivers (JDBC, psycopg2, etc.). While the underlying behavior should be similar, protocol-level prepared statements warrant dedicated analysis due to driver-specific differences in plan caching control and visibility.
For current Postgres versions (without Amit's optimization), first check what's actually happening:
select name, query, generic_plans, custom_plans
from pg_prepared_statements
where query ~ 'your_partitioned_table';
Then consider these options:
1. If you observe auto choosing custom plans (generic_plans = 0):
- Consider force_custom_plan to avoid execution 6 lock explosion
- Accept re-planning overhead as lesser evil than lock contention
2. If planning is very expensive and partitions are few:
- Consider force_generic_plan despite O(n) locking
- Accept one-time lock explosion and ongoing validation overhead
3. If LWLock:LockManager contention isn't critical:
- Consider not using prepared statements at all
- Let planning-time pruning minimize locks naturally
The situation will change once Amit's optimization lands in future Postgres versions, where force_generic_plan will become more viable (as Amit recommends) because execution 2+ will only lock pruned partitions.
Key takeaways:
- with auto mode, Postgres evaluates generic plan cost on execution 6 (causing brief lock explosion — locking all relations: parent table and its indexes + all partitions and their indexes), then decides whether to use generic or custom plans based on cost comparison; in our test with data and index scans, it rejected generic plans and continued with custom plans, while with empty tables and seq scans (as in part 1), it accepted generic plans
- with force_generic_plan, execution 1 causes lock explosion (locking all relations — parent table and its indexes + all partitions and their indexes), and execution 2+ locks all partitions (13 locks in our test, scaling O(n) with partition count) even though runtime pruning eliminates most of them
- with force_custom_plan, all executions consistently use 8 locks (parent + 1 partition + indexes) with planning-time pruning, but require re-planning every execution
- the decision depends on your specific workload: partition count, planning cost, execution frequency, and whether LWLock:LockManager contention is a concern
- Amit Langote's ongoing work will fix the O(n) executor lock acquisition problem, making force_generic_plan viable for partitioned tables in future Postgres versions (though lock explosion on execution 1's planning phase will still occur — locking all relations: parent + all partitions + all indexes)
- these findings apply to SQL-level prepared statements; protocol-level prepared statements likely behave similarly but it is worth studying their behavior separately
- the prepared statement + partitioned table interaction reveals a fundamental paradox in database optimization: a solution optimized for one scenario (unpartitioned tables) becomes a problem in another (partitioned tables)
Sometimes the best optimization is knowing when not to use an optimization.

Nikolay Samokhvalov (@samokhvalov): #PostgresMarathon 2-010: Prepared statements and partitioned table lock explo... https://t.co/LxdCcXBNte
#PostgresMarathon 2-010: Prepared statements and partitioned table lock explosion, part 2
In 2-009, we focused on Lock Manager's behavior when dealing with prepared statements and partitioned tables.
And observed a lock explosion in our simple synthetic example: from 8 locks (custom plans) during first 5 calls, to 52 locks (building generic plan) in the 6th call, to 13 locks (using cached generic plan) in the 7th and subsequent calls.
We left with questions:
- this lock explosion at the 6th call – why is it so exactly and can it be avoided?
- why do we lock all 12 partitions even though runtime pruning removes 11 of them?
Let's dig deeper: why 52 locks at the 6th call?
In 2-008, we studied the code flow for unpartitioned tables. The same pattern applies here, but with a critical difference: while for the first 5 calls we had very efficient planning-time partition pruning, it is not used during generic plan building in the 6th call.
Let's trace the execution (using PG18 sources; `//` comments are mine):
Step 1: [Acquire planner locks](https://t.co/w105Tpgmx8)
GetCachedPlan() (https://t.co/E1lBjybxSf) starts by locking the Query tree via AcquirePlannerLocks() (https://t.co/FQI6rmC795):
AcquirePlannerLocks(plansource->query_list, true);
The Query tree (parser output) contains only the parent table reference. Result -- 4 locks acquired (parent table + 3 parent indexes). Partition locks will be acquired later during planning.
Step 2: Decide plan type (https://t.co/oloBV9IM3O)
Function choose_custom_plan() (https://t.co/OPwnnqzJUG) decides whether to use custom or generic plan:
if (plansource->num_custom_plans < 5)
return true; // NOT taken (num_custom_plans = 5)
if (plansource->generic_cost < avg_custom_cost)
return false; // TAKEN (generic_cost = -1, meaning "not yet calculated")
Result here: use generic plan.
Step 3: build generic plan https://t.co/bCb9rsEu4r)
Since no cached plan exists yet (CheckCachedPlan() -- https://t.co/4llGRz3UG2 -- returns false), we build one:
plan = BuildCachedPlan(plansource, qlist, NULL, queryEnv);
// ^^^^ NULL = no bound parameters
Next, inside step 3: partition pruning fails. Let's see:
During planning, prune_append_rel_partitions()(https://t.co/Wy5vMX7VK9) attempts to prune partitions. It calls get_matching_partitions()(https://t.co/WEbS4xS5BW), which eventually hits this critical check (https://t.co/JS2GbIVAGm):
paramids = pull_exec_paramids(expr);
if (!bms_is_empty(paramids)) // TRUE - $1 detected as PARAM_EXEC
{
context->has_exec_param = true;
if (context->target != PARTTARGET_EXEC) // TRUE - we're in planner
return PARTCLAUSE_UNSUPPORTED; // PRUNING FAILS
}
Why pruning fails:
- Our query has "WHERE event_time = $1"
- No boundParams provided (generic plan building)
- Parameter detected as PARAM_EXEC
- Context is PARTTARGET_PLANNER (not executor)
- Returns PARTCLAUSE_UNSUPPORTED
Result -- get_matching_partitions() returns all partitions:
/* If there's nothing usable, return all partitions */
if (pruning_steps == NIL)
return bms_add_range(NULL, 0, rel->nparts - 1); // ALL 12 PARTITIONS
Next, still inside step 3 -- expand all partitions
Since pruning failed, the planner opens every partition via try_table_open():
childrel = try_table_open(childOID, lockmode);
All 12 partitions and their 36 indexes are opened and added to the PlannedStmt's rtable (range table - the list of all tables and indexes referenced in the plan).
Next, back to the top level: cache the plan (https://t.co/1JgnWvj2zU)
After BuildCachedPlan() returns, the plan is cached:
plansource->gplan = plan; // Cache plan with ALL partitions
The generic plan is now cached with all 52 relations in its range table. The 52 planner locks remain held until transaction end.
To summarize the mechanics of the 6th call:
GetCachedPlan()
├─ AcquirePlannerLocks() → 4 locks
├─ choose_custom_plan() → decide generic
└─ BuildCachedPlan()
└─ pg_plan_queries()
└─ standard_planner()
└─ build_simple_rel() / expand_inherited_rtentry()
├─ prune_append_rel_partitions() → pruning fails
├─ try_table_open() for each partition → +12 locks (tables)
└─ get_relation_info() for indexes → +36 locks (indexes)
[returns plan with all 52 rels]
└─ Cache it → plansource->gplan = plan
So, on execution 6, we build a generic plan but cannot prune at planning time without parameter values. The planner must consider all partitions, locking all 52 relations.
To be continued.
#PostgresMarathon 2-009: Prepared statements and partitioned table lock explosion, part 1
In #PostgresMarathon 2-008, we discovered that prepared statements can dramatically reduce LWLock:LockManager contention by switching from planner locks (which lock everything) to executor locks (which lock only what's actually used). Starting with execution 7, we saw locks drop from 6 (table + 5 indexes) to just 1 (table only).
There we tested only a simple, unpartitioned table. What happens if the table is partitioned?
The following was tested on Postgres 18.0 with default settings:
- enable_partition_pruning = on
- plan_cache_mode = auto
Postgres behavior in this field might change in the future -- there are WIP patches optimizing performance.
Let's create a simple partitioned table with multiple partitions:
create table events (
event_id bigint,
event_time timestamptz,
event_data text
) partition by range (event_time);
-- Create 12 monthly partitions
do $$
declare
i int;
start_date date;
end_date date;
begin
for i in 0..11 loop
start_date := '2024-01-01'::date + make_interval(months => i);
end_date := start_date + interval '1 month';
execute format(
'create table events_%s partition of events for values from (%L) to (%L)',
to_char(start_date, 'YYYY_MM'),
start_date,
end_date
);
end loop;
end $$;
Result:
test=# \d+ events
Partitioned table "events"
Column | Type | Collation | Nullable | Default | Storage | Compression | Stats target | Description
------------+--------------------------+-----------+----------+---------+----------+-------------+--------------+-------------
event_id | bigint | | | | plain | | |
event_time | timestamp with time zone | | | | plain | | |
event_data | text | | | | extended | | |
Partition key: RANGE (event_time)
Partitions: events_2024_01 FOR VALUES FROM ('2024-01-01 00:00:00+00') TO ('2024-02-01 00:00:00+00'),
events_2024_02 FOR VALUES FROM ('2024-02-01 00:00:00+00') TO ('2024-03-01 00:00:00+00'),
events_2024_03 FOR VALUES FROM ('2024-03-01 00:00:00+00') TO ('2024-04-01 00:00:00+00'),
events_2024_04 FOR VALUES FROM ('2024-04-01 00:00:00+00') TO ('2024-05-01 00:00:00+00'),
events_2024_05 FOR VALUES FROM ('2024-05-01 00:00:00+00') TO ('2024-06-01 00:00:00+00'),
events_2024_06 FOR VALUES FROM ('2024-06-01 00:00:00+00') TO ('2024-07-01 00:00:00+00'),
events_2024_07 FOR VALUES FROM ('2024-07-01 00:00:00+00') TO ('2024-08-01 00:00:00+00'),
events_2024_08 FOR VALUES FROM ('2024-08-01 00:00:00+00') TO ('2024-09-01 00:00:00+00'),
events_2024_09 FOR VALUES FROM ('2024-09-01 00:00:00+00') TO ('2024-10-01 00:00:00+00'),
events_2024_10 FOR VALUES FROM ('2024-10-01 00:00:00+00') TO ('2024-11-01 00:00:00+00'),
events_2024_11 FOR VALUES FROM ('2024-11-01 00:00:00+00') TO ('2024-12-01 00:00:00+00'),
events_2024_12 FOR VALUES FROM ('2024-12-01 00:00:00+00') TO ('2025-01-01 00:00:00+00')
Now let's add a few indexes to each partition and collect stats + build visibility maps (without any data, but it's OK for our purposes):
create index on events (event_id);
create index on events (event_time);
create index on events (event_data);
vacuum analyze events;
With 12 partitions and 3 indexes each, we have:
- 1 parent table and its 3 indexes
- 12 partition tables
- 36 partition indexes (12 partitions × 3 indexes)
Total: 52 relations that could potentially be locked.
Before we begin, let's verify our environment:
show plan_cache_mode;
hould return auto (the default). This is critical because we want to observe the natural transition from custom plans (executions 1-5) to generic plans (execution 6+).
Note: We're intentionally testing with empty tables. Since we're studying lock behavior, not query execution performance, the presence or absence of data doesn't affect what gets locked. This keeps the test focused and reproducible.
Let's prepare a simple query that targets a single month:
prepare get_events (timestamptz) as
select event_id, event_data
from events
where event_time = $1;
Note: This query (event_time = $1 for a specific instant) isn't realistic — real systems use ranges. But it's perfect for studying lock behavior because:
- It triggers partition pruning reliably
- Empty tables mean the planner chooses SeqScan, avoiding index-lock complexity
- We can focus purely on the lock manager behavior without query execution noise
Now, similar to what we did in 2-008, let's execute this prepared statement multiple times and check locks:
-- Run this snippet 10 times
begin;
explain (verbose) execute get_events('2024-06-15');
select
count(*) as lock_count,
array_agg(
distinct relation::regclass
order by relation::regclass
) filter (where relation is not null) as relations_locked
from pg_locks
where
pid = pg_backend_pid()
and relation::regclass::text ~ 'events';
select
generic_plans,
custom_plans
from pg_prepared_statements
where name = 'get_events';
rollback;
Here's what happens (your results may vary based on your PostgreSQL version and configuration):
Executions 1-5 (custom plans):
QUERY PLAN
------------------------------------------------------------------------------------
Seq Scan on events_2024_06 events (cost=0.00..0.00 rows=1 width=40)
Output: events.event_id, events.event_data
Filter: (events.event_time = '2024-06-15 00:00:00+00'::timestamp with time zone)
Query Identifier: 7956826248783165125
lock_count | relations_locked
------------+---------------------------------------------------------------------------------------------------------------------------------------------------------------------------------
8 | {events,events_2024_06,events_event_id_idx,events_2024_06_event_id_idx,events_event_time_idx,events_2024_06_event_time_idx,events_event_data_idx,events_2024_06_event_data_idx}
(1 row)
generic_plans | custom_plans
---------------+--------------
0 | 1
Planning-time partition pruning successfully identifies that we only need partition events_2024_06. And we still lock the parent table and all its indexes, plus the specific partition and its indexes. 8 relation-level locks total (parent table + 3 parent indexes + partition + 3 partition indexes).
Execution 6 (building generic plan):
lock_count | relations_locked
------------+------------------
52 | {events,events_event_id_idx,events_event_time_idx,events_event_data_idx,
events_2024_01,events_2024_01_event_id_idx,events_2024_01_event_time_idx,events_2024_01_event_data_idx,
events_2024_02,...[all 52 relations]...}
BOOM
All 52 relations locked. We went from 8 relation-level locks to 52 relation-level locks. Imagine what happens if we have 1000 partitions...
Execution 7+ (using cached generic plan with runtime pruning):
Now something interesting happens — the locks drop dramatically:
QUERY PLAN
-------------------------------------------------------------------------------------
Append (cost=0.00..0.06 rows=12 width=40)
Subplans Removed: 11
-> Seq Scan on events_2024_06 events_1 (cost=0.00..0.00 rows=1 width=40)
Output: events_1.event_id, events_1.event_data
Filter: (events_1.event_time = $1)
Query Identifier: 7956826248783165125
lock_count | relations_locked
------------+----------------------------------------------------------------------------------------------------------------------------------------------------------------------------------------------
13 | {events,events_2024_01,events_2024_02,events_2024_03,events_2024_04,events_2024_05,events_2024_06,events_2024_07,events_2024_08,events_2024_09,events_2024_10,events_2024_11,events_2024_12}
generic_plans | custom_plans
---------------+--------------
2 | 5
13 relation-level locks — better than 52, but still problematic. Runtime partition pruning is working ("Subplans Removed: 11"), and we're locking ALL 12 partitions even though we only scan one.
Why 13 relation-level locks instead of just 2 (parent + the one partition we need)?
The executor acquires locks on all partitions in InitPlan() before runtime pruning occurs in ExecInitAppend(). This is a known limitation — the lock acquisition happens too early in the execution pipeline.
Enough for today, we'll continue tomorrow.
Nikolay Samokhvalov (@samokhvalov): #PostgresMarathon 2-009: Prepared statements and partitioned table lock explo... https://t.co/cvG2K6nEG1
I'm on a trip until 2025-10-22, and have only limited time with laptop – #PostgresMarathon will be continued when I'm back
Nikolay Samokhvalov (@samokhvalov): #PostgresMarathon 2-008: LWLock:LockManager and prepared statements https://t.co/CMtHvuQNxa
#PostgresMarathon 2-008: LWLock:LockManager and prepared statements
As was discussed in #PostgresMarathon 2-002, for a simple SELECT from a table, at planning time, Postgres locks the table and all of its indexes with AccessShareLock. A simple demo to remind it (let me be a bit weird here and save some bytes when typing SQL):
test=# create table t();
CREATE TABLE
test=# create index on t((1));
CREATE INDEX
test=# create index on t((1));
CREATE INDEX
test=# create index on t((1));
CREATE INDEX
test=# create index on t((1));
CREATE INDEX
test=# create index on t((1));
CREATE INDEX
test=# \d t
Table "public.t"
Column | Type | Collation | Nullable | Default
--------+------+-----------+----------+---------
Indexes:
"t_expr_idx" btree ((1))
"t_expr_idx1" btree ((1))
"t_expr_idx2" btree ((1))
"t_expr_idx3" btree ((1))
"t_expr_idx4" btree ((1))
test=#
test=# begin; explain select from t;
BEGIN
QUERY PLAN
-----------------------------------------------------
Seq Scan on t (cost=0.00..39.10 rows=2910 width=0)
(1 row)
test=*# select relation::regclass, mode from pg_locks where pid = pg_backend_pid();
relation | mode
-------------+-----------------
t_expr_idx2 | AccessShareLock
pg_locks | AccessShareLock
t_expr_idx3 | AccessShareLock
t_expr_idx4 | AccessShareLock
t_expr_idx | AccessShareLock
t_expr_idx1 | AccessShareLock
t | AccessShareLock
| ExclusiveLock
(8 rows)
test=*#
– indeed, all indexes locked.
## Using prepared statements to reduce locking
To mitigate it, we can just use prepared statements. Let's create one:
prepare test_query (int) as select from t;
And then run this snippet 7 times:
begin;
explain (verbose) execute test_query(1);
select relation::regclass, mode
from pg_locks
where pid = pg_backend_pid() and relation::regclass <> 'pg_locks'::regclass;
rollback;
Six (6) times, we'll see that all indexes are locked:
relation | mode
-------------+-----------------
t_expr_idx2 | AccessShareLock
t_expr_idx3 | AccessShareLock
t_expr_idx4 | AccessShareLock
t_expr_idx | AccessShareLock
t_expr_idx1 | AccessShareLock
t | AccessShareLock
(6 rows)
And on the 7th time, we'll see this:
relation | mode
----------+-----------------
t | AccessShareLock
(1 row)
– only the table is locked.
## The mystery of the 6th execution
I was surprised to see single lock on the 7th call, not on the 6th. I expected that for the first 5 times, so-called custom plan would be used and all 6 relations (table + 5 its indexes) locked, and on the 6th time, we switch to generic plan and lock only the table itself.
Why 5 calls? Per the docs:
https://t.co/QaErVFJYL7
> By default (that is, when plan_cache_mode is set to auto), the server will automatically choose whether to use a generic or custom plan for a prepared statement that has parameters. The current rule for this is that the first five executions are done with custom plans and the average estimated cost of those plans is calculated. Then a generic plan is created and its estimated cost is compared to the average custom-plan cost. Subsequent executions use the generic plan if its cost is not so much higher than the average custom-plan cost as to make repeated replanning seem preferable.
But why do we see, the locking behavior changes only on the 7th call, not 6th?
Checking prepared statements stats:
test=# select * from pg_prepared_statements \gx
-[ RECORD 1 ]---+-------------------------------------------
name | test_query
statement | prepare test_query (int) as select from t;
prepare_time | 2025-10-15 02:06:25.570003+00
parameter_types | {integer}
result_types | {}
from_sql | t
generic_plans | 2
custom_plans | 5
-- indeed, we had custom plan used 5 and then it switched to generic plan, using it for 6th and 7th call. But why on the 6th, call we saw all indexes being locked? That's a mystery.
So, why does the 6th execution use generic plan but still locks all indexes?
The answer lies in two different locking mechanisms in PostgreSQL's plan cache:
1. Planner locks - lock everything in the Query tree (all potential access paths)
2. Executor locks - lock only what's in the PlannedStmt (what's actually used)
Let's look at source code (I use PG18 code here).
## The first five
As already mentioned, for the first 5 executions, it uses custom plans. Looking inside GetCachedPlan, we see the sequence of steps:
https://t.co/pVKBExlJGn
1. Acquire planner locks:
https://t.co/LOylLH0eXn
AcquirePlannerLocks(plansource->query_list, true);
- Locks the Query tree (parser output)
- Query tree contains: table + all 5 indexes in our case
- In result, it locks the table and its 5 indexes – overall, 6 locks
2. Decide plan type:
https://t.co/ICEoV2Pb5w
/* Generate custom plans until we have done at least 5 (arbitrary) */
if (plansource->num_custom_plans < 5)
return true; // Use custom plan
3. Build custom plan:
https://t.co/iqjnABNnts
plan = BuildCachedPlan(plansource, qlist, boundParams, queryEnv);
// ^^^^^^^^^^^ actual parameter value
- Planner creates plan with specific parameter value
- Plan is not cached (thrown away after execution)
- Result: 6 planner locks remain until the end of transaction
## The number six
On the 6th execution, the start is the same as for the first five. It all looks the same, except one thing – the process of building cached plan is different.
1. Acquire planner locks – the same as before (see above)
2. Decide plan type – now it's different, for default plan_cache_mode (auto), the switch to generic plan happens:
https://t.co/fdLW8qWxoi
/*
* Prefer generic plan if it's less expensive than the average custom
* plan. (Because we include a charge for cost of planning in the
* custom-plan costs, this means the generic plan only has to be less
* expensive than the execution cost plus replan cost of the custom
* plans.)
*
* Note that if generic_cost is -1 (indicating we've not yet determined
* the generic plan cost), we'll always prefer generic at this point.
*/
if (plansource->generic_cost < avg_custom_cost)
return false; // Use generic plan
- this time num_custom_plans = 5, so threshold reached
- generic_cost = -1 (not calculated yet)
- -1 < avg_custom_cost – this means try generic plan
3. Check for cached plan:
https://t.co/UipKLz9ZGz
if (CheckCachedPlan(plansource)) // Returns FALSE - no plan yet
4. Build generic plan:
https://t.co/isPzuC0MPJ
plan = BuildCachedPlan(plansource, qlist, NULL, queryEnv);
// ^^^^ NULL here means 'generic'
plansource->gplan = plan; // Cache it
- Planner builds plan without parameter values
- Creates PlannedStmt with only table in our case (seq scan chosen)
- Plan is cached for future use
- Result: still 6 planner locks (from Step 1) - no executor locks acquired yet (!!)
So, here is what I didn't understand properly when I was reading just the docs: on execution 6, we build the generic plan but don't go through the "use cached plan" path that would acquire executor locks. We still use planner locks – it means, we lock all indexes.
## Finally there – number seven and beyond
Starting with execution 7 and further, we use cached generic plan, and executor locks – in our case (seq scan), it means only the table is locked:
1. Acquire planner locks (table + 5 indexes)
2. Decide plan type → use generic
3. Check for cached plan:
https://t.co/k3MXWSkQoc
if (CheckCachedPlan(plansource)) // Returns TRUE - plan exists!
{
plan = plansource->gplan; // Use cached plan
}
4. Inside CheckCachedPlan executor locks are acquired:
AcquireExecutorLocks(plan->stmt_list, true);
- Locks the PlannedStmt (planner output)
- PlannedStmt contains: only table (seq scan chosen) in our case
- 1 executor lock acquired
- Result: Only 1 lock
## What we learned
To summarize, here is what's happening:
| Execution | Plan type | What happens | Locks |
|-----------|-----------|------------------------------------------|-----------------------|
| 1-5 | Custom | Build plan with params → planner locks | 6 (table + 5 indexes) |
| 6 | Generic | Build generic plan → planner locks | 6 (table + 5 indexes) |
| 7+ | Generic | Use cached generic plan → executor locks | 1 (table only) |
Prepared statements can dramatically reduce LWLock:LockManager contention - but only starting with the 7th execution, not 6th. During executions 1-6, with default plan_cache_mode (auto), Postgres still uses planner locks that lock all tables involved in the query, with all their indexes.
@BenjDicken easy: make a lot of backends do writes on the primary and watch how replication tries to do the same amount of writes on standby
I'll probably need to explore this in #PostgresMarathon one day
Nikolay Samokhvalov (@samokhvalov): #PostgresMarathon 2-007: Should we worry about pg_blocking_pids()'s observer ... https://t.co/YTYpJKoGZw
#PostgresMarathon 2-007: Should we worry about pg_blocking_pids()'s observer effect?
Many years ago, when developing complex automated procedures for a large company, I realized that my automation needs monitoring components. Including understanding heavyweight lock contention – for example, to recognize situations when a poorly designed change is blocked by things like autovacuum running in transaction ID wraparound prevention mode (it doesn't yield to anybody, when in this mode).
This led me to pg_blocking_pids() and analysis described in "Useful queries to analyze PostgreSQL lock trees (a.k.a. lock queues)" https://t.co/KPL2q862Ow.
Unfortunately, there is a catch – as the docs for pg_blocking_pids() (https://t.co/FM4dBwX3W9) describe:
> Frequent calls to this function could have some impact on database performance, because it needs exclusive access to the lock manager's shared state for a short time.
But how bad is it?
First, let's study the code (I use PG18 sources here), it starts here: https://t.co/sQZvhbYlXU. The comment to the function itself doesn't reveal extra secrets compared to the docs (though it has an interesting consideration for parallel-query cases, which is touched on in the docs too), so let's go deeper, function GetBlockerStatusData () https://t.co/JbXLsUPMiP, its comment has some words about potential observer effect:
* The design goal is to hold the LWLocks for as short a time as possible;
* thus, this function simply makes a copy of the necessary data and releases
* the locks, allowing the caller to contemplate and format the data for as
* long as it pleases.
And inside, we see this https://t.co/ruWdgm4o57:
/*
* Acquire lock on the entire shared lock data structure. See notes
* in GetLockStatusData().
*/
for (i = 0; i < NUM_LOCK_PARTITIONS; i++)
LWLockAcquire(LockHashPartitionLockByIndex(i), LW_SHARED);
So, it acquires ALL 16 partition locks (NUM_LOCK_PARTITIONS = 16, we discussed it before), using LW_SHARED. Potentially blocking attempts coming from backends to acquire an exclusive LWLock or a few (if multiple partitions need to be locked).
As promised, these locks are quickly released -- a few lines below https://t.co/47Z56xbP0z we see it (notice considerations about the order -- interesting design decision to release them going backwards!):
/*
* And release locks. We do this in reverse order for two reasons: (1)
* Anyone else who needs more than one of the locks will be trying to lock
* them in increasing order; we don't want to release the other process
* until it can get all the locks it needs. (2) This avoids O(N^2)
* behavior inside LWLockRelease.
*/
for (i = NUM_LOCK_PARTITIONS; --i >= 0;)
LWLockRelease(LockHashPartitionLockByIndex(i));
During this brief period of time if some backend attempts to acquire an exclusive LWLock (LW_EXCLUSIVE) to one or a few of 16 partitions of the main lock table, it will be briefly waiting for us, and it will be sitting with wait event LWLock:LockManager.
What kinds of workload can suffer from this the most? Well, those that acquire exclusive LW_EXCLUSIVE frequently -- for example, those that already experience LWLock:LockManager contention, and our actions can "make things worse".
Another aspect here: if we have many rows to analyze in pg_stat_activity and pg_locks, there is a good chance that we'll be calling pg_blocking_pids() multiple times during a single call of our monitoring query. This is how SQL works: if we put pg_blocking_pids() to the SELECT clause of our query, it's going to be executed for each row in the result set.
I like the idea pganalyze has https://t.co/vHkwdVG5HJ -- running the function only for rows that have wait event 'Lock':
select pid, pg_blocking_pids(pid)
from pg_stat_activity
where wait_event_type = 'Lock';
They also allow disabling lock analysis completely, recognizing the risks of pg_blocking_pids()'s observer effect.
Let's do a simple benchmark. Adding a hundred of extra indexes to pgbench_accounts (as we did before) and running --select-only workload, we'll make backends work with the main lock table a lot, causing LWLock:LockManager contention already. Then we'll be running the "monitoring" function in a loop, calling pg_blocking_pids() ~10 times per second for *each* backend analyzed.
I'm going to run it on my macbook m1 this time -- partially because I'm curious to see LWLock:LockManager contention on a smaller machine. Last time we checked 16 vCPUs (Intel), this time it will be 8 (ARM).
pgbench initialized with -s10, and we'll be calling it twice, 10 minutes each, first without the "monitoring" part, and then with it. Here is pgbench call:
pgbench -r -n -T600 -P10 --select-only -j8 -c8 -U postgres postgres
The "monitoring" part:
do $$
declare
start_time timestamptz := clock_timestamp();
begin
while clock_timestamp() - start_time < interval '600 seconds' loop
perform pg_blocking_pids(pid) from pg_stat_activity;
pg_sleep(0.01); -- 10ms = 100 calls/second
end loop
end $$;
I used Cursor to run Postgres 18 in container, with all settings default (doesn't matter here), so max_locks_per_transaction is default, 64. Having 101 indexes is enough to cause contention.
Using new Browser feature I also asked Cursor to install postgres_ai monitoring https://t.co/ZEahIqXf5B – it was fun to see how it looks at the browser, troubleshooting various issues but successfully having monitoring for our experiment.
And here is the result:
Comparing main SELECT's latencies from the pgbench output:
phase 1 (without monitoring query):
0.459 0 SELECT abalance FROM pgbench_accounts WHERE aid = :aid;
phase 2 (with background pg_blocking_pids()):
0.505 0 SELECT abalance FROM pgbench_accounts WHERE aid = :aid;
– First of all, we do have LWLock:LockManager contention on this smaller machine (notice the red area on the second graph). It confirms the idea that we all should be aware of this problem. Though in this particular experiment it wasn't huge – 8 competing backends is quite low.
- When we started calling pg_blocking_pids(), it only moderately affected the latency of the main workload's SELECT, increasing it from 0.459 ms to 0.505 ms – ~10% (accordingly, TPS dropped from 17,394 to 15,812).
Noticeable change, yet not significant. Of course, it can be more significant on a larger server, with hundreds of active sessions observed during performance issues.
Still, I would pay this "price" for having good lock analysis with history. What about you?

Nikolay Samokhvalov (@samokhvalov): #PostgresMarathon 2-006: Mysterious max_locks_per_transaction https://t.co/I506u7jwzo
X doesn't let me post #PostgresMarathon 2-006 -- some bug blocks the piece I wrote. Going to post somehow else.
Nikolay Samokhvalov (@samokhvalov): #PostgresMarathon 2-005: More LWLock:LockManager benchmarks for Postgres 18 https://t.co/5b36dez3fH
#PostgresMarathon 2-005 More LWLock:LockManager benchmarks for Postgres 18
In 2023-2024, after incidents that multiple customers of PostgresAI experienced, when production nodes were down because of LWLock:LockManager contention, we studied it in synthetic environments.
At that time, we managed to reproduce the issue only on large machines – ~100 or more vCPUs.
With PG18 release, this question started to bother me again: can we experience LWLock:LockManager on smaller machines?
Denis Morozov just published results of benchmarks that successfully reproduce LWLock:LockManager contention in PG18 on 16-vCPU VMs: https://t.co/pUzTSCBAAm.
As before, we took standard pgbench, with -s100 (no partitioning), and started running the standard "--select-only" workload that SELECTs random rows in "pgbench_accounts". Originally, the table has only 1 index – so at planning time, Postgres locks 2 relations with AccessShareLock; then we add one more index at each step.
Then we change max_locks_per_transaction from default 64 down to 32 and up to 1024. We couldn't set it to 16 (which, I expect, would make behavior of PG18 similar to PG17 in terms of fast-path locking – 16 slots only), because in our setup, Postgres is managed by Patroni, and there, as it turned out, there is a hardcoded minimum for max_locks_per_transaction, 32: https://t.co/ejCdoNqeGX.
And here is what we have for the planning time:
-- it is clear that when we're out of fast-path lock slots and Lock Manager starts using the main lock table, it affects the planning time. The infamous LWLock:LockManager performance cliff, reproduced on a moderately sized machine.
For max_locks_per_transaction=1024, the issue wasn't observed, with the number of extra indexes up to 200 (total number of locked relations 202).
The wait event analysis clearly confirms the LWLock:LockManager contention:
We plan to conduct this benchmark for PG17 to have a clear comparison, and then, perhaps, revisit smaller machines, e.g., with 8 vCPUs – I'm very curious to understand if smaller Postgres instances can experience this type of problem.
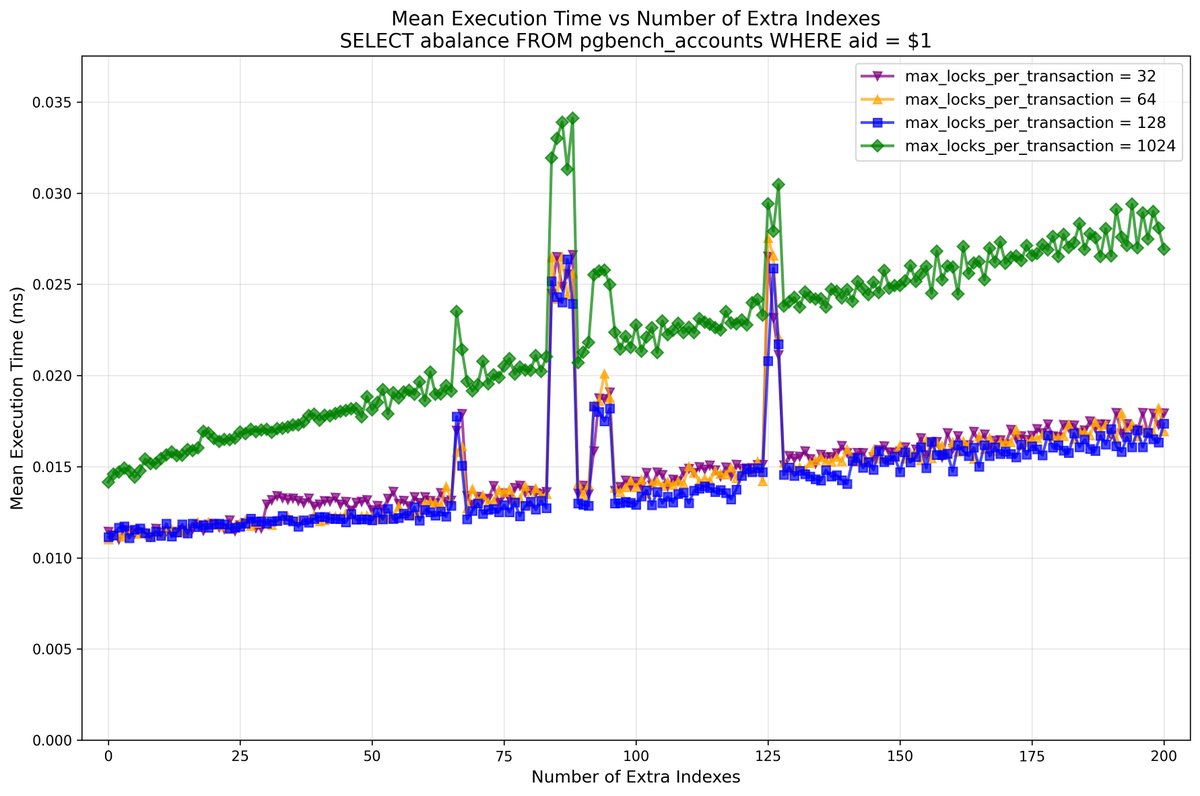
Another interesting observation was execution time:
I'm not really concerned by occasional spikes, this could be noisy neighbors (for a specific number of indexes / relations locked, we run iterations of all variants of max_locks_per_transaction at ~ the same time, this explains the nature of the spikes).
But notice the very different growth of execution time for max_locks_per_transaction=1024. Remember I ended 2-004 with a question: are there downsides of the optimization in PG18? I couldn't find any so far, in the optimization itself. But the downsides of having too large a max_locks_per_transaction (except the obvious one – memory consumed), definitely exist, and this looks like one of them. Worth a separate analysis?
Let me know what you think about all this, what questions you have, and what max_locks_per_transaction you're going to have in your production systems -- default 64 or something else.


Nikolay Samokhvalov (@samokhvalov): #PostgresMarathon 2-004: Fast-path locking explained https://t.co/UFiserkypQ
Trends for you
Most Popular Users

Elon Musk 
@elonmusk
240.1M followers

Barack Obama
@barackobama
119.3M followers

Donald J. Trump
@realdonaldtrump
111.6M followers

Cristiano Ronaldo
@cristiano
108.8M followers

Narendra Modi
@narendramodi
106.9M followers

Rihanna
@rihanna
97.2M followers

NASA
@nasa
92.1M followers

Justin Bieber
@justinbieber
90.5M followers

KATY PERRY
@katyperry
86.7M followers

Taylor Swift
@taylorswift13
80.5M followers

Lady Gaga
@ladygaga
72.1M followers

Kim Kardashian
@kimkardashian
69.3M followers

YouTube
@youtube
68.6M followers

Virat Kohli
@imvkohli
68.4M followers

Bill Gates
@billgates
63.4M followers

The Ellen Show
@theellenshow
62.5M followers

CNN
@cnn
61.9M followers

Neymar Jr
@neymarjr
61M followers

X
@x
60.9M followers

CNN Breaking News
@cnnbrk
59.9M followers