

Top Tweets for #PriceTrap

#Gold #XAUUSD #PriceTrap
SELL TARGET HIT: 4,007 → GOLD NOW AT 3,973
The bearish setup played out.
Gold failed to reclaim the $4,050–$4,066 resistance zone and continued lower, reaching the $4,007 target.
Price has now moved further down to around $3,973.
That's another $34 below the original target.
The important part wasn't predicting every candle. It was identifying the rejection zone, defining the downside target, and waiting for price to confirm the setup.
A bounce doesn't invalidate a bearish structure. And a successful target doesn't mean it's time to chase the move.
The next question is whether sellers remain in control below $4,000.
One setup. One target. Let price do the work.
#Gold #XAUUSD #PriceTrap
Sell > Taget: 4007
Gold keeps bouncing. But every rebound is running into selling pressure.
On the 30-minute chart, XAUUSD failed to hold above $4,065 and dropped toward $4,023 before bouncing to around $4,035.
The next move matters more than the bounce itself.
If price retests $4,050–$4,066 and gets rejected, another move toward $4,022 and potentially $4,005 becomes possible.
If buyers reclaim $4,066 and hold above it, the bearish setup weakens.
A green candle is a reaction. It isn't confirmation.
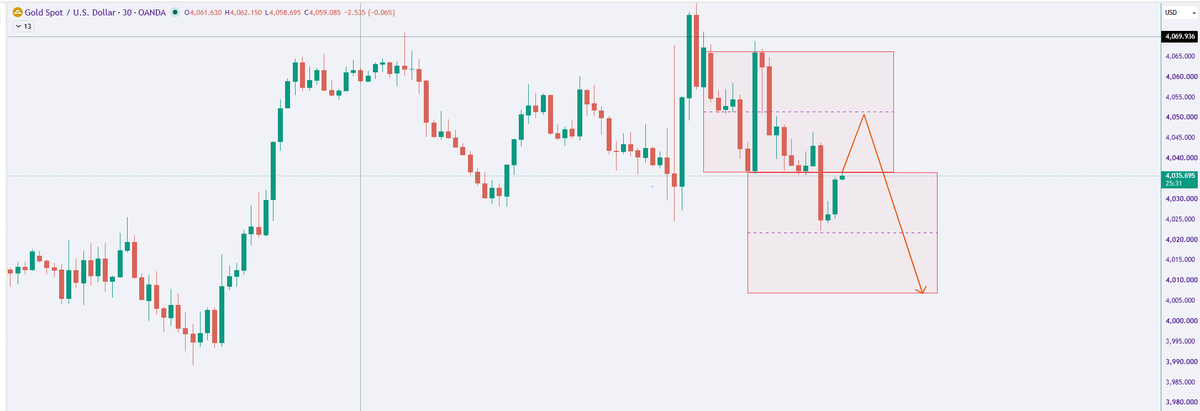
#Gold #XAUUSD #PriceTrap
Sell > Taget: 4007
Gold keeps bouncing. But every rebound is running into selling pressure.
On the 30-minute chart, XAUUSD failed to hold above $4,065 and dropped toward $4,023 before bouncing to around $4,035.
The next move matters more than the bounce itself.
If price retests $4,050–$4,066 and gets rejected, another move toward $4,022 and potentially $4,005 becomes possible.
If buyers reclaim $4,066 and hold above it, the bearish setup weakens.
A green candle is a reaction. It isn't confirmation.
🚨 #GOLD: WHY DID GOLD RALLY WHILE THE DOLLAR STRENGTHENED? | #PriceTrap
Tuesday’s market action delivered a notable divergence.
🟡 Gold: $4,048 — up 1.07%
⚪ Silver: $54.42 — up 0.81%
🛢️ WTI crude: near $101.40 — down about 1.3%
💵 DXY: around 102.3 — up about 0.3%
📈 US 10Y yield: near 5.00%
Gold advanced even as the dollar strengthened.
One possible explanation: falling oil prices eased some inflation concerns, helping precious metals recover despite pressure from the dollar and elevated yields.
But this is not yet a confirmed trend reversal.
🎯 The next catalyst: the Fed.
Markets expect rates to remain unchanged. The real test is whether policymakers signal that tighter policy may still be needed in December.
A hawkish message could renew pressure on gold. A less hawkish tone could extend the rebound.
🚨 GOLD vs SILVER: A REBOUND BEFORE THE FED — OR A TRAP? | #PriceTrap
Gold and silver both recovered on Oct. 27, but the bigger picture tells a more complicated story.
🟡 Gold: $4,060/oz — up about 1.1%
⚪ Silver: $54.42/oz — up about 0.8%
📊 Gold/Silver ratio: around 74.6
The key divergence: silver recently hit an 11-month low, while gold held the $3,990 area and reclaimed $4,050.
Meanwhile, oil prices fell and eased some inflation pressure — a potential tailwind for precious metals. But a firmer dollar and elevated Treasury yields remain risks.
🎯 Today’s catalyst: the Fed.
A cautious or hawkish message could revive pressure on metals. A softer tone may support the rebound.
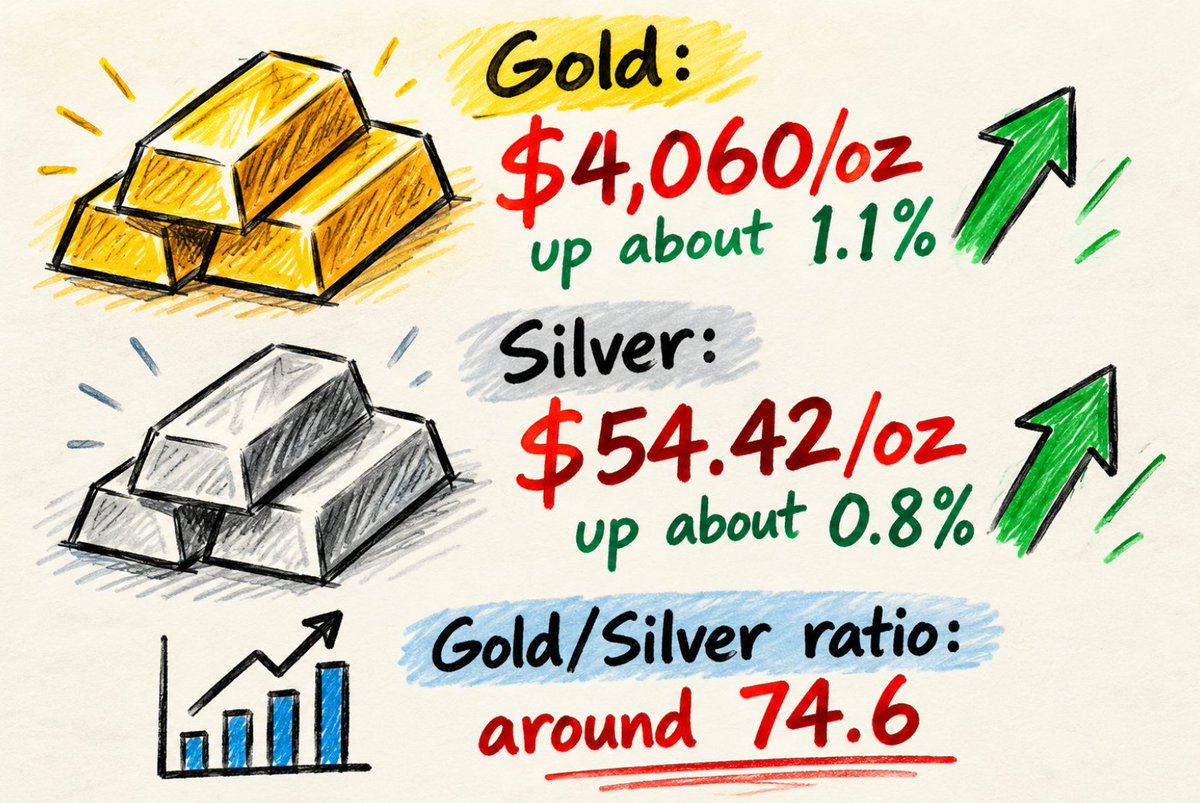
🚨 GOLD vs SILVER: A REBOUND BEFORE THE FED — OR A TRAP? | #PriceTrap
Gold and silver both recovered on Oct. 27, but the bigger picture tells a more complicated story.
🟡 Gold: $4,060/oz — up about 1.1%
⚪ Silver: $54.42/oz — up about 0.8%
📊 Gold/Silver ratio: around 74.6
The key divergence: silver recently hit an 11-month low, while gold held the $3,990 area and reclaimed $4,050.
Meanwhile, oil prices fell and eased some inflation pressure — a potential tailwind for precious metals. But a firmer dollar and elevated Treasury yields remain risks.
🎯 Today’s catalyst: the Fed.
A cautious or hawkish message could revive pressure on metals. A softer tone may support the rebound.
🚨 #GOLD: ANALYSTS LOWER THEIR 2026 FORECAST — BUT GOLD IS BREAKING ABOVE RESISTANCE!
A notable contradiction in the gold market on October 27:
📉 Reuters poll: The average gold price forecast for 2026 has been lowered from $4,509 to $4,495/oz.
📈 However, the average forecast for 2027 has risen from $4,610 to $4,650/oz.
Meanwhile, gold rebounding strongly from the $3,992 zone, breaking above $4,030.83 and advancing toward $4,058, according to the TradingView screenshot.
The market is telling two different stories:
• Short-term macro pressures remain in place, with a strong USD, elevated yields, and expectations that the Fed will maintain a restrictive monetary policy.
• Price action, however, shows buyers pushing gold above a key short-term resistance zone.

🚨 #BTC: TRADING IN A TIGHT RANGE, WAITING FOR A BREAKOUT | #PriceTrap
₿ BTC: ~$79,750
📍 Trading range: $79.5K–$80.9K
🎯 Key resistance to break: $80.7K–$80.9K
BTC needs to break above the $80.7K–$80.9K resistance zone to open the door for a potential recovery. Until then, price remains at risk of continuing to trade sideways within the current range.
#Bitcoin #BTC #Crypto #Trading

XAUUSD – Gold Analysis (D1) | #PriceTrap
The chart shows gold shifting from a strong uptrend into a correction, with the $4,000 zone serving as a key level that could determine the next directional move.
1. Price Structure: Lower Highs
Gold peaked around $5,400 before dropping sharply. The subsequent rebound stalled near $4,700, followed by renewed weakness. This structure suggests that sellers currently have the upper hand on the daily timeframe.
2. The $4,000 Zone: Key Support
Gold is currently trading around $4,017, testing a horizontal support zone that has triggered multiple price reactions in the past.
This level deserves close attention: holding above it could trigger a rebound, while a decisive breakdown would strengthen the bearish scenario.
3. What Comes Next?
Bearish scenario: If the daily candle closes below $4,000 and price fails to reclaim this level, the next level to watch is $3,900, followed by the long-term target zone around $3,200–$3,300 shown on the chart.
PriceTrap: What to Watch
Price: Gold is testing a critical support zone.
Structure: Lower highs favor further downside.
Confirmation: Wait for the daily candle to close and observe price action on a retest of the $4,000 zone.

XAUUSD – Gold Analysis (D1) | #PriceTrap
The chart shows gold shifting from a strong uptrend into a correction, with the $4,000 zone serving as a key level that could determine the next directional move.
1. Price Structure: Lower Highs
Gold peaked around $5,400 before dropping sharply. The subsequent rebound stalled near $4,700, followed by renewed weakness. This structure suggests that sellers currently have the upper hand on the daily timeframe.
2. The $4,000 Zone: Key Support
Gold is currently trading around $4,017, testing a horizontal support zone that has triggered multiple price reactions in the past.
This level deserves close attention: holding above it could trigger a rebound, while a decisive breakdown would strengthen the bearish scenario.
3. What Comes Next?
Bearish scenario: If the daily candle closes below $4,000 and price fails to reclaim this level, the next level to watch is $3,900, followed by the long-term target zone around $3,200–$3,300 shown on the chart.
PriceTrap: What to Watch
Price: Gold is testing a critical support zone.
Structure: Lower highs favor further downside.
Confirmation: Wait for the daily candle to close and observe price action on a retest of the $4,000 zone.
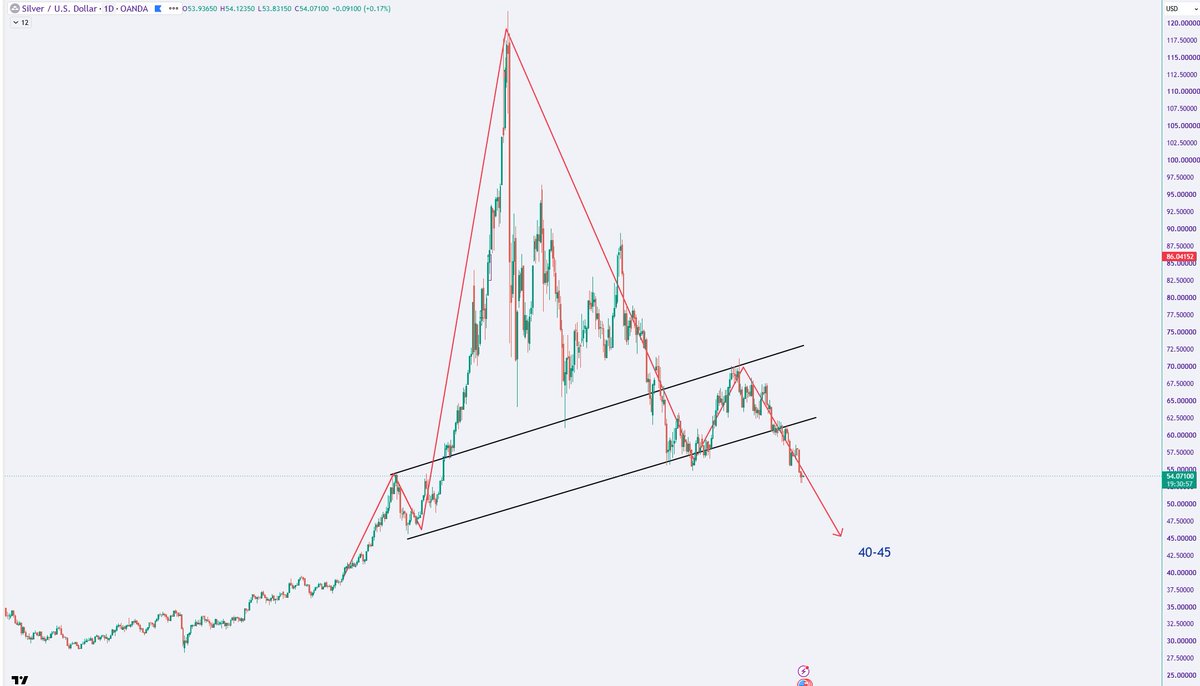
🚨 SILVER: HAS THE LONG-TERM TREND BROKEN DOWN? | #PriceTrap
🥈 XAGUSD: ~$53.9
📉 Price structure: Breakdown below the medium-term ascending channel
🎯 Long-term target zone: $40–45/oz
PRICE → STRUCTURE → TARGET
Silver is weakening after peaking near $120 and repeatedly forming lower highs. The break below the ascending channel’s lower boundary increases the risk of further downside.
⚠️ If silver fails to reclaim the $60–62 zone soon, selling pressure could push the price toward $50, with $40–45 as a more distant target under the chart’s bearish scenario.
This is a long-term technical target, not a guaranteed forecast. Watch how price reacts at key support levels before confirming further downside.
#SILVER #XAGUSD #Commodities #Trading
🚨 BTC: REAL YIELDS DOWN 12 BPS — NASDAQ RALLIES, BUT BITCOIN STAYS FLAT! | #PriceTrap
📉 US 10Y real yield: 2.64% — down 12 bps
📈 Nasdaq: +1.02%
💵 DXY: −0.31%
₿ BTC: around $80,184 — virtually unchanged
💧 US net liquidity: estimated at $5.77T, down $37.3B since Wednesday
MACRO → LIQUIDITY → PRICE
Normally, falling real yields and a weaker dollar ease pressure on risk assets. Yet BTC has not responded in line with the Nasdaq.
The key divergence: macro conditions are becoming more supportive, while US net liquidity continues to decline.
This is not yet a confirmed bullish signal for BTC. The next step is to see whether spot buying flows can validate a potential rebound.

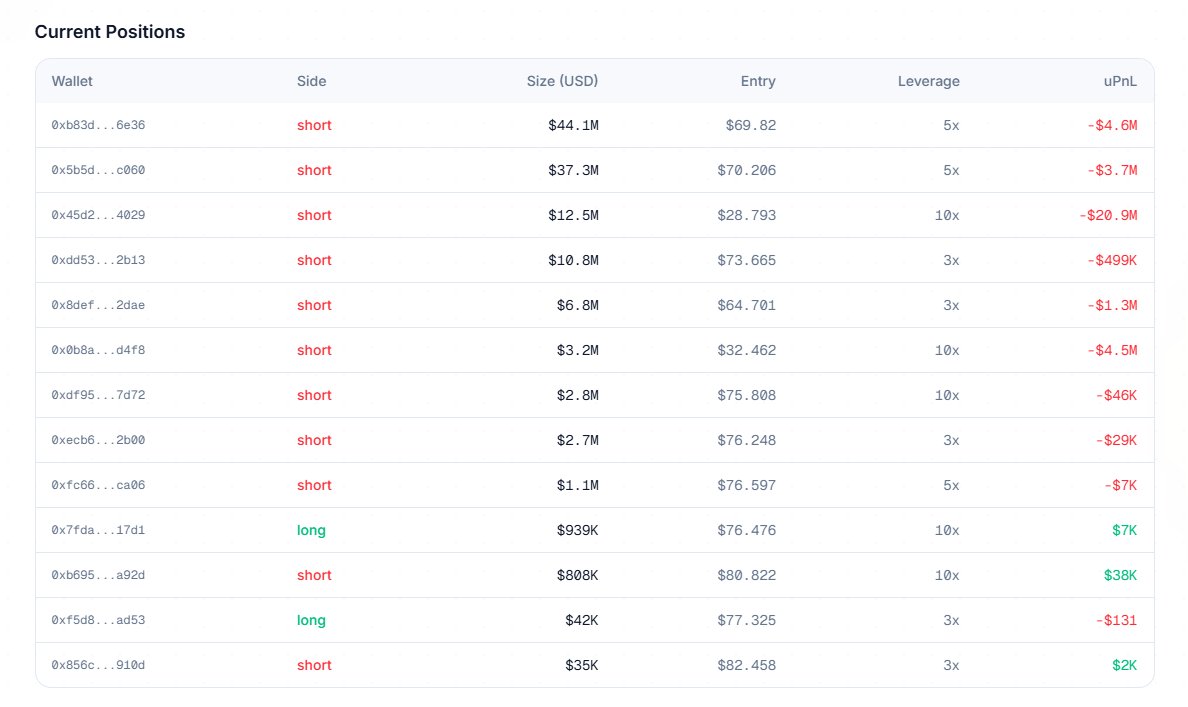
🚨 WHALES: $198.7M BTC SHORT — DOWN $9.8M! | #PriceTrap
📉 Wallet 0x5b5d…c060:
🔻 BTC Short: $198.7M | PnL: −$9.8M
🔻 ETH Short: $247.2M | PnL: +$292K
🔻 SOL Short: $67.9M | PnL: −$4.7M
📉 Wallet 0xb83d…6e36:
🔻 BTC Short: $196.5M | PnL: −$5.0M
🔻 ETH Short: $155.6M | PnL: +$3.6M
🔻 ZEC Short: $70.2M | PnL: +$5.6M
PRICE → POSITIONING → TRAP
The key takeaway: multiple BTC short positions worth nearly $200M each are sitting on millions of dollars in unrealized losses, while other short positions held by the same wallets remain profitable.
⚠️ These are unrealized PnL figures at the time of the snapshot, not realized losses. There is also insufficient data to conclude that these wallets are close to liquidation.
🎯 What to watch: Will further BTC upside increase pressure on these large short positions, or will a price reversal allow the whales to reduce their risk?

🚨 SILVER: HAS THE LONG-TERM TREND BROKEN DOWN? | #PriceTrap
🥈 XAGUSD: ~$53.9
📉 Price structure: Breakdown below the medium-term ascending channel
🎯 Long-term target zone: $40–45/oz
PRICE → STRUCTURE → TARGET
Silver is weakening after peaking near $120 and repeatedly forming lower highs. The break below the ascending channel’s lower boundary increases the risk of further downside.
⚠️ If silver fails to reclaim the $60–62 zone soon, selling pressure could push the price toward $50, with $40–45 as a more distant target under the chart’s bearish scenario.
This is a long-term technical target, not a guaranteed forecast. Watch how price reacts at key support levels before confirming further downside.
#SILVER #XAGUSD #Commodities #Trading
🚨 WTI OIL: $500 BY 2028? THE CHART IS POINTING TO AN EXTREME SCENARIO | #PriceTrap
Crude oil is trading near $101, but this long-term monthly chart raises a much bigger question:
Could WTI be approaching another historic expansion?
📈 Current chart price: ~$101/barrel
🎯 Extreme technical projection: ~$500 by 2028
📍 Key structure: The upper boundary of a multi-decade rising channel
The chart draws parallels with previous major oil cycles, including the surge into 2008. But history rarely repeats in exactly the same way.
PRICE → STRUCTURE → SUPPLY → CATALYST
The EIA’s October 2026 outlook expects Brent prices to ease as Middle Eastern supply disruptions gradually unwind, although it warns that geopolitical risks could keep volatility elevated.
#WTI #CrudeOil #OilPrice #Commodities #Trading

🚨 WHALES: $198.7M BTC SHORT — DOWN $9.8M! | #PriceTrap
📉 Wallet 0x5b5d…c060:
🔻 BTC Short: $198.7M | PnL: −$9.8M
🔻 ETH Short: $247.2M | PnL: +$292K
🔻 SOL Short: $67.9M | PnL: −$4.7M
📉 Wallet 0xb83d…6e36:
🔻 BTC Short: $196.5M | PnL: −$5.0M
🔻 ETH Short: $155.6M | PnL: +$3.6M
🔻 ZEC Short: $70.2M | PnL: +$5.6M
PRICE → POSITIONING → TRAP
The key takeaway: multiple BTC short positions worth nearly $200M each are sitting on millions of dollars in unrealized losses, while other short positions held by the same wallets remain profitable.
⚠️ These are unrealized PnL figures at the time of the snapshot, not realized losses. There is also insufficient data to conclude that these wallets are close to liquidation.
🎯 What to watch: Will further BTC upside increase pressure on these large short positions, or will a price reversal allow the whales to reduce their risk?
🚨 BTC: $31.2B IN OPTIONS OPEN INTEREST — WILL $78,000 BECOME A PRICE MAGNET? | #PriceTrap
₿ BTC: Around $80,000
📊 Deribit options OI: $31.2B
🎯 Max Pain for the Oct 30 expiry: $78,000
⚖️ Put/Call ratio for Oct 30 expiry: 0.55
🏦 Fed meeting: Oct 27–28
PRICE → OPTIONS → CATALYST
BTC is trading near $80K, while the major upcoming options expiry has a Max Pain level at $78K.
The market is also facing the Fed’s interest-rate decision. Volatility could increase as traders adjust their positions ahead of the event.
⚠️ But Max Pain is not a guaranteed price target. To assess BTC’s next move, watch price action, spot flows, and changes in implied volatility (IV) as the Fed meeting approaches.
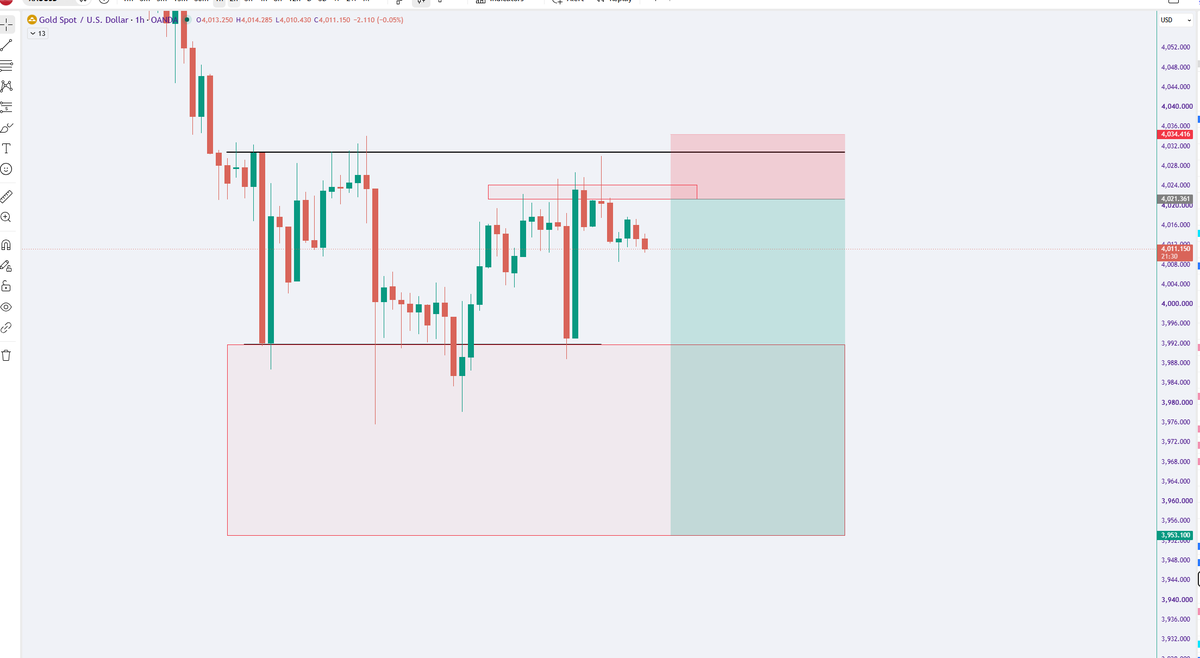
H1 #GOLD Trading Plan | #PriceTrap
📍 Entry : Now
🛑 Stop Loss: 4,035
🎯 TP1: 3,992
🎯 TP2: 3,970
🎯 TP3: 3,953
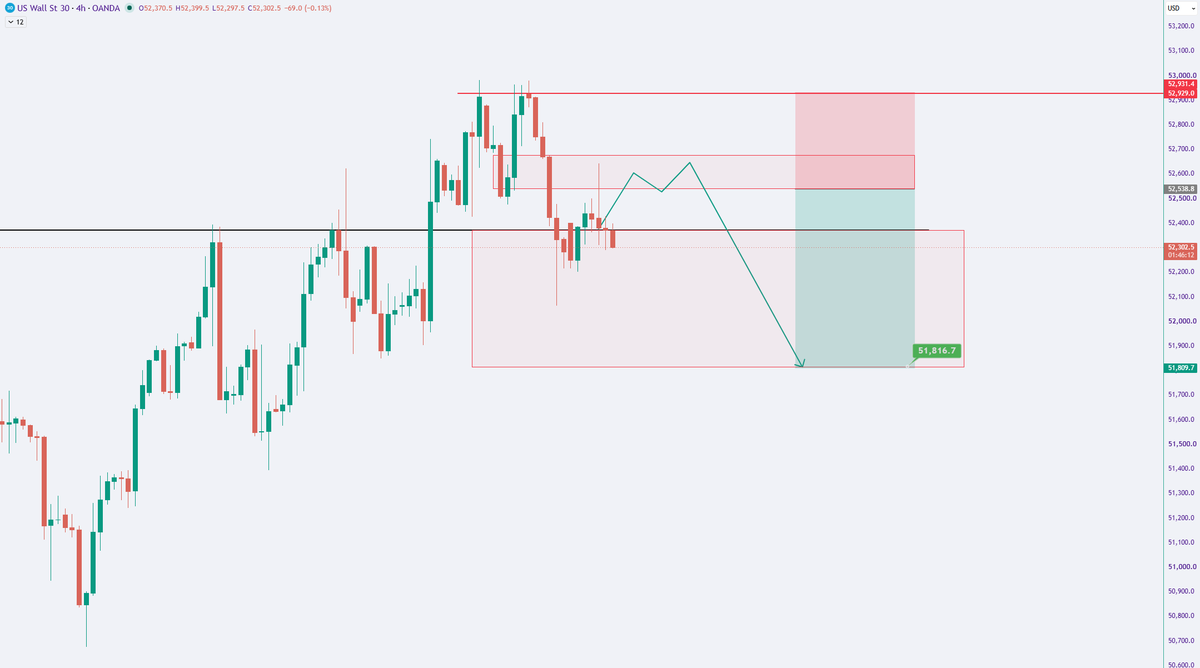
#US30 is still moving according to plan.
🚨 DXY: WILL HISTORY REPEAT ITSELF? A MOVE TO 122–123 BEFORE A REVERSAL? | #PriceTrap
💵 DXY is currently trading around 102
🎯 Chart projection: a potential move toward 122–123
🔻 Thereafter: a possible correction toward 114–115
DXY → USD → GOLD & SILVER
The weekly chart shows DXY recovering from its 2026 lows within a long-term ascending channel that began forming in 2022.
⚠️ Impact on gold and silver: A sharp rise in DXY typically puts downward pressure on XAUUSD and XAGUSD, potentially extending their corrections — especially if U.S. real yields rise as well.
#DXY #GOLD #SILVER #XAUUSD #XAGUSD

🚨 GOLD (XAUUSD): LAST LINE OF WEEKLY SUPPORT? — DOWNSIDE RISK TO $3,200–$3,300 | #PriceTrap
🥇 Gold is trading around $4,018/oz, testing a key support zone near $4,000 on the weekly (W1) chart.
🥈 Silver has weakened sharply. Is silver sending an early warning signal for gold?
📉 PriceTrap:
If gold closes the weekly candle below the $3,990–$4,000 zone, the support structure could break, increasing the risk of a deeper correction.
🎯 Key levels to watch:
• $4,000: Critical support
• $3,800: Next level to watch if the breakdown occurs
• $3,200–$3,300: Long-term target in a deeper bearish scenario
⚠️ This scenario is not yet confirmed. If gold holds support, prices could still rebound before choosing their next direction.
Don’t watch gold in isolation. Track silver’s reaction and wait for weekly candle confirmation.
#Gold #XAUUSD #Silver #Trading

🚨 BTC: $31.2B IN OPTIONS OPEN INTEREST — WILL $78,000 BECOME A PRICE MAGNET? | #PriceTrap
₿ BTC: Around $80,000
📊 Deribit options OI: $31.2B
🎯 Max Pain for the Oct 30 expiry: $78,000
⚖️ Put/Call ratio for Oct 30 expiry: 0.55
🏦 Fed meeting: Oct 27–28
PRICE → OPTIONS → CATALYST
BTC is trading near $80K, while the major upcoming options expiry has a Max Pain level at $78K.
The market is also facing the Fed’s interest-rate decision. Volatility could increase as traders adjust their positions ahead of the event.
⚠️ But Max Pain is not a guaranteed price target. To assess BTC’s next move, watch price action, spot flows, and changes in implied volatility (IV) as the Fed meeting approaches.
**2 AM. The screen is still glowing.**
My family is asleep. All I can hear is the hum of my computer fan as red and green candles dance before my eyes.
I add one more piece to the puzzle, trying to complete the final pattern as accurately as possible. Then I ask myself: *“Am I reading the market correctly, or am I just seeing what I want to see?”*
“Just one more hour.”
I’ve told myself those words more nights than I can count.
But the truth is, I’m not staying up for the charts alone. I’m staying up because of the bills waiting for me tomorrow. Because of my financial responsibilities to my family. Because of a silent promise I’ve made to the people I love: that one day, I’ll give them a life with fewer worries.
Perhaps this is the quiet, bittersweet side of trading that no one ever sees.
When I lose, I sit alone with that sinking feeling in my chest. When I get it right, I still have no one to share it with. From the outside, people just see me “sitting alone, keeping the computer company.”
Sometimes, I start doubting myself. I even question the path I’ve chosen.
No one told me that trading was about more than reading charts. It’s a battle with yourself — a test of patience, discipline, and mental strength.
But through blown accounts, sleepless nights, and countless hours of research until my eyes can barely stay open, I’ve noticed myself changing.
Slowly. Quietly.
I’ve learned that not every setup is worth taking. Not every loss needs to be recovered today. And falling a few times doesn’t mean the journey is over.
Maybe the greatest reward won’t be the day I close a massive winning trade. Maybe it will be the day I realize I’m no longer the person I used to be — the person who entered trades out of fear of missing out, rushed decisions under pressure, and measured his self-worth by a few green and red numbers on a screen.
I don’t know whether this journey will lead to success. I know it won’t be easy. There is still so much to learn, so much more discipline to build, and the weight of my responsibilities hasn’t become any lighter.
But I hope that one day, when I look back on these quiet nights, I’ll feel grateful.
Not because every sacrifice was rewarded, and not because success was ever guaranteed. But because I didn’t give up. Because I learned to hold on to what truly matters. And because, step by step, I became a better version of myself.
**To you, fellow trader, sitting alone in front of your screen tonight:**
I hope you reach the success you work so hard for every single day.
But even more than that, I hope that one day, you’ll be sitting beside the people you love, with a heart at peace, knowing that the burden of those endless bills no longer weighs so heavily on your shoulders.
Until then, take care of yourself. The market will still be there tomorrow.
#TraderLife #Trading #Crypto
🚨 WTI OIL: $500 BY 2028? THE CHART IS POINTING TO AN EXTREME SCENARIO | #PriceTrap
Crude oil is trading near $101, but this long-term monthly chart raises a much bigger question:
Could WTI be approaching another historic expansion?
📈 Current chart price: ~$101/barrel
🎯 Extreme technical projection: ~$500 by 2028
📍 Key structure: The upper boundary of a multi-decade rising channel
The chart draws parallels with previous major oil cycles, including the surge into 2008. But history rarely repeats in exactly the same way.
PRICE → STRUCTURE → SUPPLY → CATALYST
The EIA’s October 2026 outlook expects Brent prices to ease as Middle Eastern supply disruptions gradually unwind, although it warns that geopolitical risks could keep volatility elevated.
#WTI #CrudeOil #OilPrice #Commodities #Trading
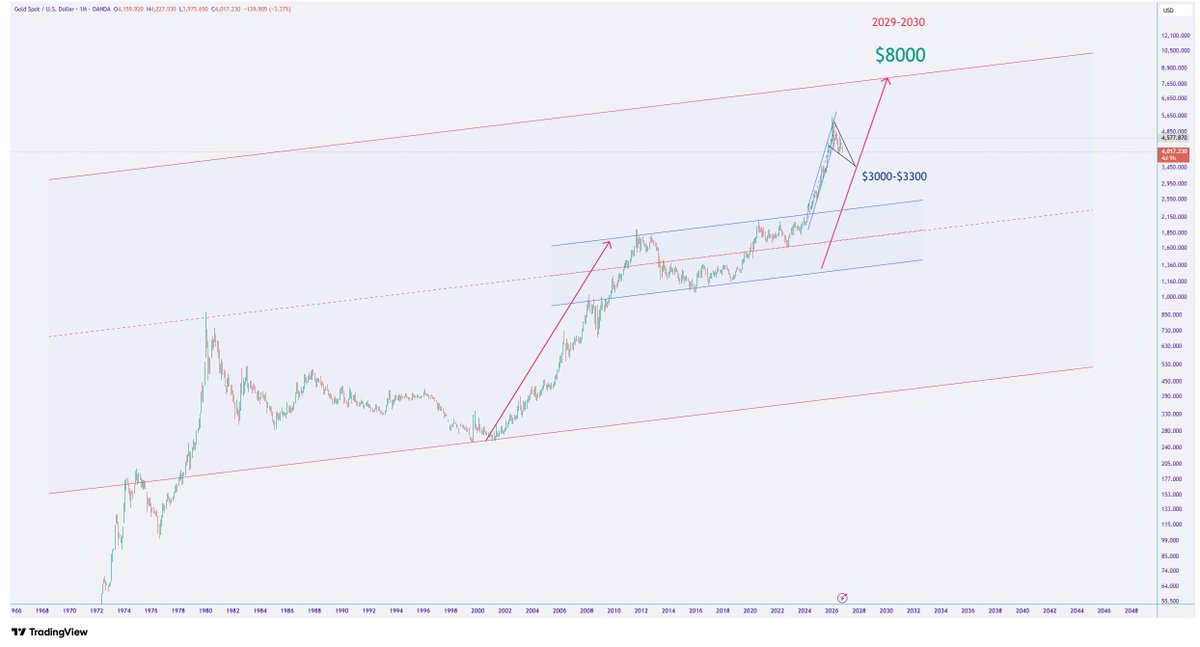
🚨 **GOLD: $4,000 IS THE LINE IN THE SAND — COULD $3,200 COME BEFORE $8,000?** | #PriceTrap
Gold is approaching a critical turning point.
📉 **Current area:** $4,000/oz
🎯 **Downside scenario:** $3,100–$3,300 by late 2026–early 2027
🚀 **Long-term upside projection:** $8,000 by 2029–2030
The chart outlines a possible path: further downside toward the lower boundary of the long-term rising channel, followed by a potential recovery toward new highs.
But there is a crucial distinction:
**A projected path is not a confirmed trend.**
If gold breaks below $4,000 and fails to reclaim it, downside risk could increase. A move toward $3,100–$3,300 remains a chart-based scenario, not a certainty.
If the long-term channel holds and price forms a convincing base, the bullish structure could remain intact — keeping the $8,000 projection on the table.
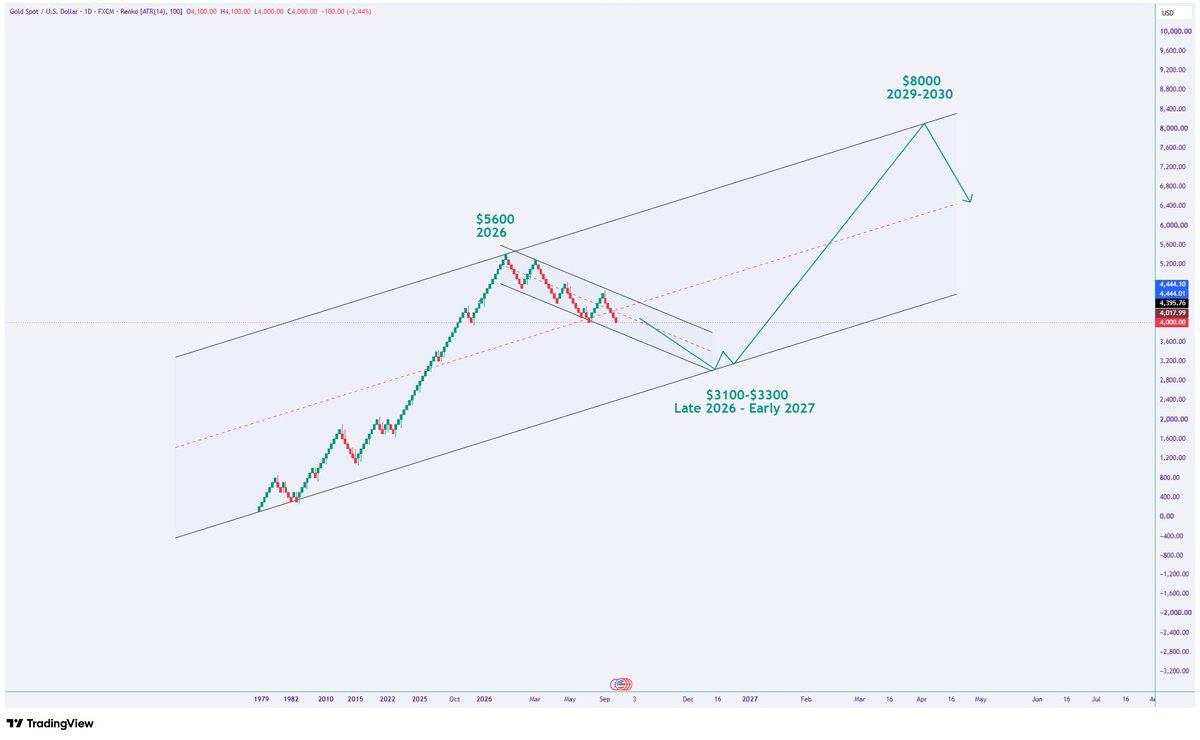
🚨 **GOLD: $4,000 IS THE LINE IN THE SAND — COULD $3,200 COME BEFORE $8,000?** | #PriceTrap
Gold is approaching a critical turning point.
📉 **Current area:** $4,000/oz
🎯 **Downside scenario:** $3,100–$3,300 by late 2026–early 2027
🚀 **Long-term upside projection:** $8,000 by 2029–2030
The chart outlines a possible path: further downside toward the lower boundary of the long-term rising channel, followed by a potential recovery toward new highs.
But there is a crucial distinction:
**A projected path is not a confirmed trend.**
If gold breaks below $4,000 and fails to reclaim it, downside risk could increase. A move toward $3,100–$3,300 remains a chart-based scenario, not a certainty.
If the long-term channel holds and price forms a convincing base, the bullish structure could remain intact — keeping the $8,000 projection on the table.
🚨 GOLD LONG-TERM: $8,000 BY 2029–2030? | #PriceTrap
📈 The monthly chart shows gold correcting after a strong rally toward $5,600. Price has now pulled back to the $4,000 area on the weekly chart.
🎯 My outlook: Gold could extend its correction toward $3,000–$3,300 before preparing for another major rally.
🚀 #XAU long-term target: $8,000, potentially by 2029–2030.
#XAU #GOLD #PriceTrap

🚨 HYPERLIQUID WHALES SHORT $1.99B — BTC SHORTS DOWN MORE THAN $15M? | #PriceTrap
🐋 16 large accounts | 495 open positions
💰 Total notional at entry: $1.99B
🔻 LONG share: just 2%
⚠️ The two largest BTC SHORT positions:
• $200.6M — unrealized loss of $10.3M
• $196.5M — unrealized loss of $5.4M
🔥 Combined unrealized losses on these two positions: $15.7M.
POSITIONING → PAIN → LIQUIDITY → TRAP
The key signal: tracked accounts are heavily skewed toward SHORT, yet some of the largest BTC short positions are under pressure.
If BTC continues to rise, short-covering pressure could amplify volatility. If BTC falls, these positions could see some of that pressure ease.
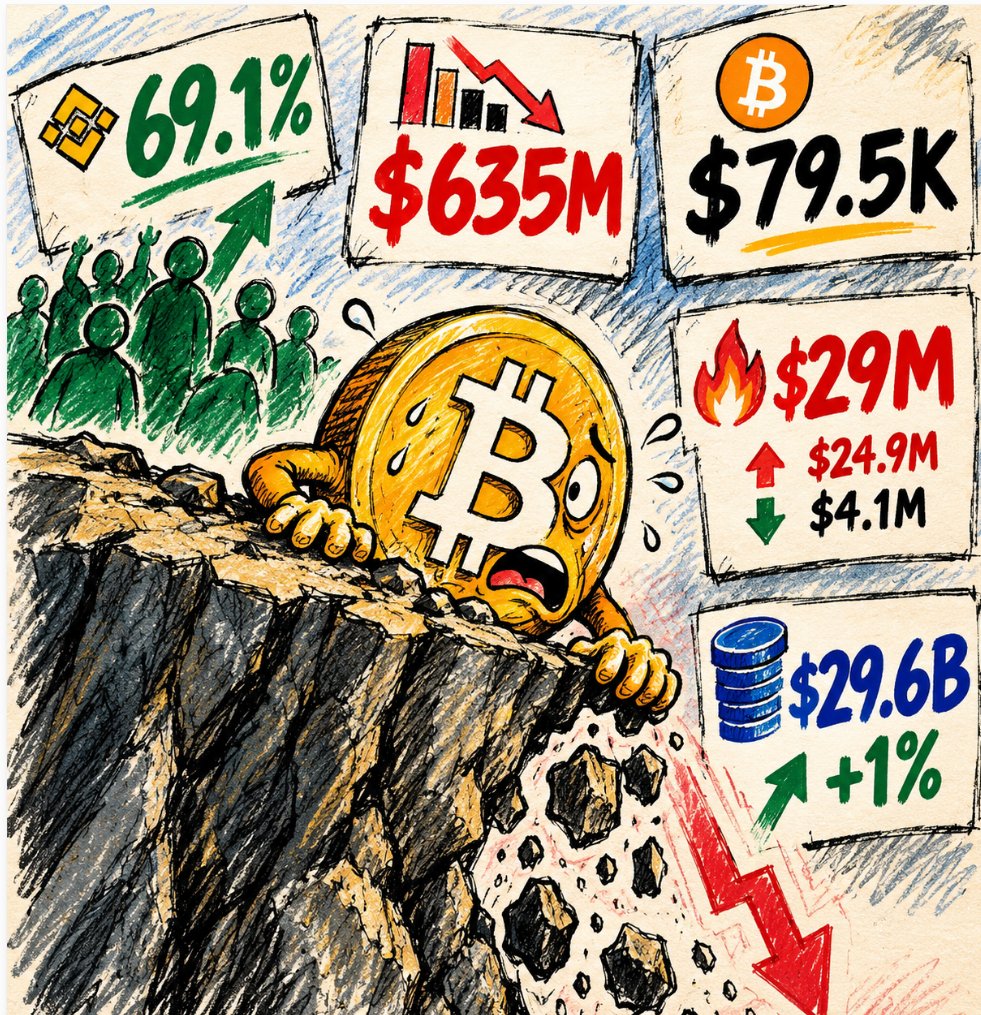
🚨 BTC: 69% LONG — $635M IN ETF OUTFLOWS. LONG SQUEEZE RISK? | #PriceTrap
₿ BTC: Around $80K
👥 Binance: 69.1% of accounts with open positions are LONG
💥 BTC liquidations (24h): $29M — $24.9M Longs, $4.1M Shorts
📉 Total exchange OI: $29.6B, up 1% over 24h
💸 One data dashboard reports $635M in net outflows from U.S. spot ETFs over 24h.
Price → Flow → Positioning → Trap
Price is weak, Long liquidations are significantly higher than Short liquidations, yet the share of accounts positioned Long remains elevated. If spot buying fails to return, remaining Long positions could become a source of selling pressure if BTC falls further.
⚠️ A squeeze is not yet confirmed. Rising OI may reflect either new positions or repositioning.
What to watch next: Can BTC hold the $79K zone? OI falling alongside price would point toward deleveraging, while a price rebound accompanied by improving spot demand would provide a more credible recovery signal.#Bitcoin #BTC #Crypto #PriceTrap
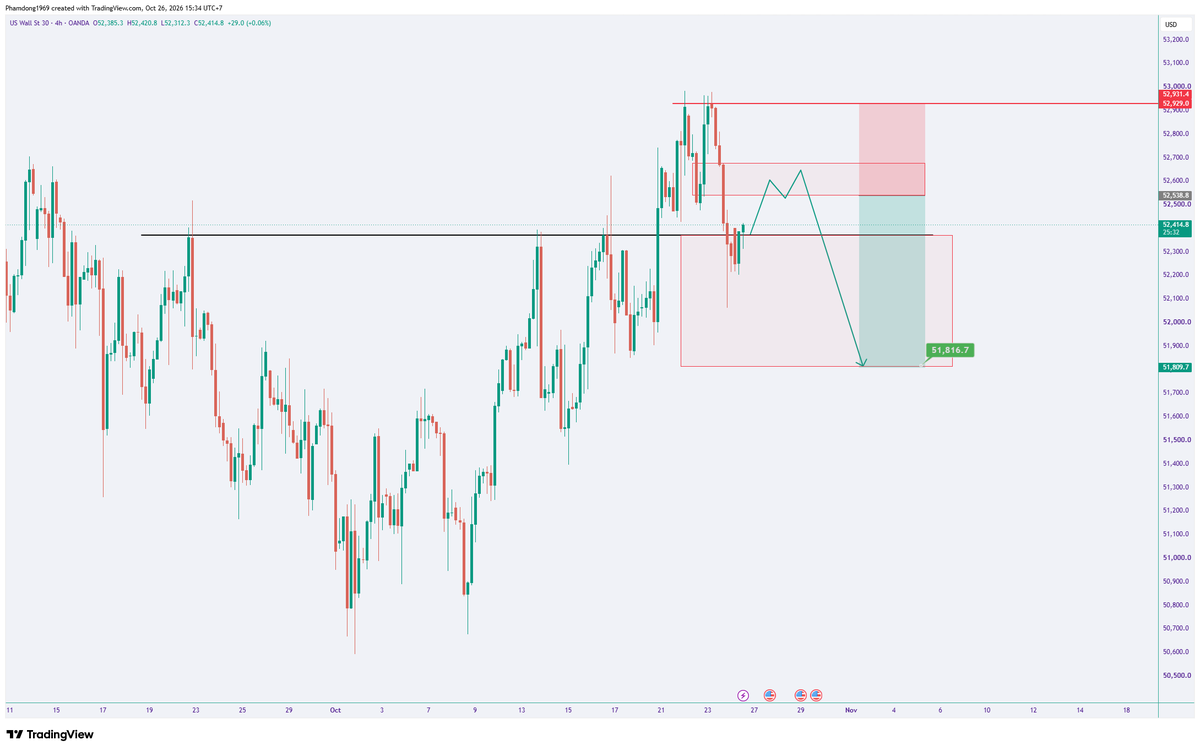
📉 #US30 H4: SELL THE REBOUND | #PriceTrap
US30 is facing resistance after being rejected near 52,930, with price pulling back toward the 52,380 support zone.
🎯 Trade Setup: SELL
• Entry Zone: 52,550–52,680
• Stop Loss: Above 52,930
• Take Profit 1: 52,090
• Take Profit 2: 51,817
📌 Trade Idea: Wait for price to rebound into the 52,550–52,680 zone before entering. If the retest fails, price could resume its decline toward 51,817.
⚠️ Invalidation: A decisive breakout above 52,930 would invalidate the bearish setup.
Don't chase price. Be patient, wait for confirmation, and manage your risk.
#US30 #DowJones #Trading #PriceTrap
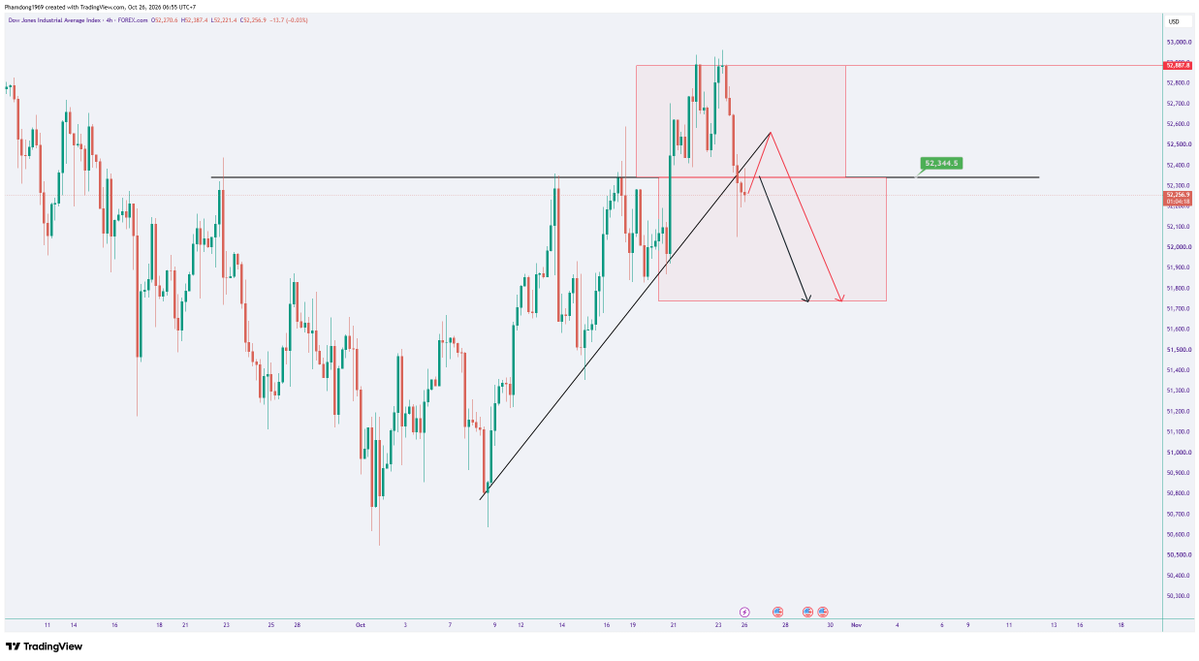
📉 H4 #US30 Trading Plan | PriceTrap
H4 has broken the bullish market structure. Price is currently around the 52,345 zone.
🎯 Bias: SELL
• Initial entry: 40% of planned position size.
• If price rebounds to retest the trendline, add the remaining 60% of the planned position size, subject to bearish confirmation.
• Take Profit: 51,740.
• Invalidation: If price breaks above 52,887, the SELL setup is no longer valid.
#US30 #TradingPlan #PriceTrap
🚨 BTC: 69% LONG — $635M IN ETF OUTFLOWS. LONG SQUEEZE RISK? | #PriceTrap
₿ BTC: Around $80K
👥 Binance: 69.1% of accounts with open positions are LONG
💥 BTC liquidations (24h): $29M — $24.9M Longs, $4.1M Shorts
📉 Total exchange OI: $29.6B, up 1% over 24h
💸 One data dashboard reports $635M in net outflows from U.S. spot ETFs over 24h.
Price → Flow → Positioning → Trap
Price is weak, Long liquidations are significantly higher than Short liquidations, yet the share of accounts positioned Long remains elevated. If spot buying fails to return, remaining Long positions could become a source of selling pressure if BTC falls further.
⚠️ A squeeze is not yet confirmed. Rising OI may reflect either new positions or repositioning.
What to watch next: Can BTC hold the $79K zone? OI falling alongside price would point toward deleveraging, while a price rebound accompanied by improving spot demand would provide a more credible recovery signal.#Bitcoin #BTC #Crypto #PriceTrap
🚨 ETH IS TAKING A MUCH BIGGER LEVERAGE HIT THAN BTC! | #PriceTrap
October 26 liquidation data reveals a notable imbalance:
📉 XOOMAR: $25.7M in ETH liquidations versus just $3.4M for BTC — ETH’s total is 7.6× higher.
⚠️ 80% of total liquidations across https://t.co/F9MBheXXFz, HTX, and OKX came from LONG positions.
Data from another tracker also shows ETH leading liquidations across the exchanges it monitors.
What to watch: Is this a long-side flush before a rebound, or is selling pressure still building?
If ETH absorbs the selling pressure and reclaims the price level it just lost, the flush may have cleared out weaker leveraged positions. If price continues to fall alongside Open Interest, the risk of cascading liquidations remains.
Don’t assume a long squeeze marks the bottom. Watch how price and OI respond after the flush.
#Ethereum #ETH #Bitcoin #BTC #Crypto

🚨 GOLD (XAUUSD): LAST LINE OF WEEKLY SUPPORT? — DOWNSIDE RISK TO $3,200–$3,300 | #PriceTrap
🥇 Gold is trading around $4,018/oz, testing a key support zone near $4,000 on the weekly (W1) chart.
🥈 Silver has weakened sharply. Is silver sending an early warning signal for gold?
📉 PriceTrap:
If gold closes the weekly candle below the $3,990–$4,000 zone, the support structure could break, increasing the risk of a deeper correction.
🎯 Key levels to watch:
• $4,000: Critical support
• $3,800: Next level to watch if the breakdown occurs
• $3,200–$3,300: Long-term target in a deeper bearish scenario
⚠️ This scenario is not yet confirmed. If gold holds support, prices could still rebound before choosing their next direction.
Don’t watch gold in isolation. Track silver’s reaction and wait for weekly candle confirmation.
#Gold #XAUUSD #Silver #Trading
🚨 SILVER (XAGUSD): WEEKLY SUPPORT BREAKDOWN — LONG-TERM TARGET: $40–$41 | #PriceTrap
Silver’s weekly chart structure is increasingly bearish.
📉 Price has broken below the $55.70–$56.00 support zone. Successively lower highs suggest weakening bullish momentum.
🎯 Key levels to watch:
• $55.70–$56.00: Resistance on a rebound
• $52–$53: Near-term support
• $47–$48: Intermediate downside target
• $41.35–$42.00: Potential target if selling pressure intensifies
⚠️ #PriceTrap:
If silver rebounds toward $55.70–$56.00 but gets rejected, selling pressure could push prices toward lower support zones.
Conversely, if price reclaims this zone and holds above it on the weekly close, the breakdown could prove false, opening the way for a recovery toward $60–$62.
Strategy: Don’t chase the sell-off after a sharp decline. Wait for the price reaction at resistance and confirmation from price action.
#Silver #XAGUSD #PriceTrap

🚨 SILVER (XAGUSD): WEEKLY SUPPORT BREAKDOWN — LONG-TERM TARGET: $40–$41 | #PriceTrap
Silver’s weekly chart structure is increasingly bearish.
📉 Price has broken below the $55.70–$56.00 support zone. Successively lower highs suggest weakening bullish momentum.
🎯 Key levels to watch:
• $55.70–$56.00: Resistance on a rebound
• $52–$53: Near-term support
• $47–$48: Intermediate downside target
• $41.35–$42.00: Potential target if selling pressure intensifies
⚠️ #PriceTrap:
If silver rebounds toward $55.70–$56.00 but gets rejected, selling pressure could push prices toward lower support zones.
Conversely, if price reclaims this zone and holds above it on the weekly close, the breakdown could prove false, opening the way for a recovery toward $60–$62.
Strategy: Don’t chase the sell-off after a sharp decline. Wait for the price reaction at resistance and confirmation from price action.
#Silver #XAGUSD #PriceTrap
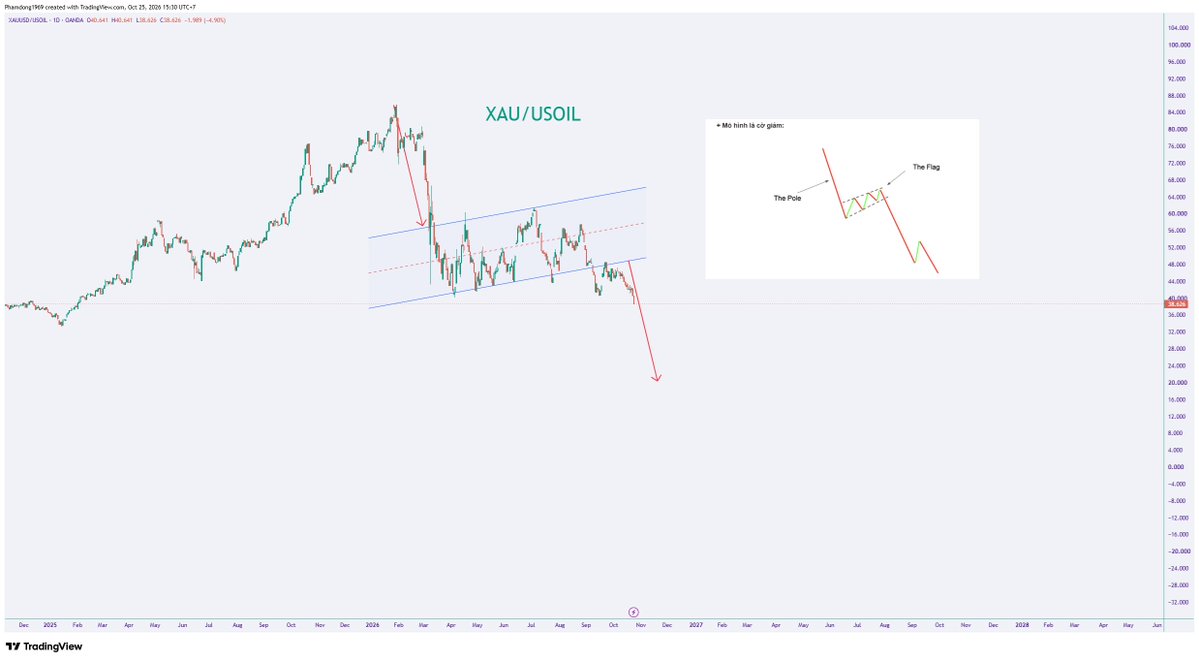
🚨 BRENT OIL TO $170 — WHILE GOLD/OIL BREAKS DOWN? | #PriceTrap
🛢️ Brent is breaking above a multi-year resistance zone near $115. The long-term chart projects a potential move toward $150-$170, with an even more aggressive extension if the breakout accelerates.
📉 Meanwhile, the XAU/USOIL ratio is breaking below its rising channel, with price near 38.6 on the chart.
⚠️ If oil keeps outperforming gold, the ratio could fall further. The chart sketches a possible downside toward 20 — but that is a technical projection, not a confirmed target.
The key divergence: Oil may be gaining on supply risks, while gold faces pressure from the USD and yields.
🔎 Watch Brent's breakout, the XAU/USOIL channel breakdown, DXY and US real yields.
PriceTrap: Gold doesn't have to rise just because inflation risks increase. If oil surges faster, gold can lose ground relative to oil.
#GOLD #BRENT #USOIL #XAUUSD

🚨 BTC SHORT WHALE DOWN $10.4 MILLION! | #PriceTrap
One Hyperliquid wallet: 0x5b5d…c060
🔻 BTC Short: $211,29M
Entry: $76,331
Unrealized PnL: −$9,76M
But BTC is not the whole story.
This wallet is also short ETH and SOL. The combined PnL across all three positions listed by XOOMAR is approximately −$16.7M.
This is a position risk worth watching — not proof that the whale is about to be liquidated.
#Bitcoin #Crypto

📉 H4 #US30 Trading Plan | PriceTrap
H4 has broken the bullish market structure. Price is currently around the 52,345 zone.
🎯 Bias: SELL
• Initial entry: 40% of planned position size.
• If price rebounds to retest the trendline, add the remaining 60% of the planned position size, subject to bearish confirmation.
• Take Profit: 51,740.
• Invalidation: If price breaks above 52,887, the SELL setup is no longer valid.
#US30 #TradingPlan #PriceTrap
Last Seen Hashtags on Sotwe
Most Popular Users

Elon Musk 
@elonmusk
241.5M followers

Barack Obama
@barackobama
118.8M followers

Cristiano Ronaldo
@cristiano
114.5M followers

Donald J. Trump
@realdonaldtrump
111.9M followers

Narendra Modi
@narendramodi
107.1M followers

Rihanna
@rihanna
98.7M followers

NASA
@nasa
92.3M followers

Justin Bieber
@justinbieber
91.8M followers

KATY PERRY
@katyperry
90M followers

Taylor Swift
@taylorswift13
84M followers

Lady Gaga
@ladygaga
75.5M followers

Virat Kohli
@imvkohli
73.4M followers

Kim Kardashian
@kimkardashian
70.8M followers

YouTube
@youtube
68.7M followers

Neymar Jr
@neymarjr
66.4M followers

Bill Gates
@billgates
65.2M followers

Selena Gomez
@selenagomez
63.1M followers

The Ellen Show
@theellenshow
62.2M followers

CNN
@cnn
61.7M followers

X
@x
60.7M followers