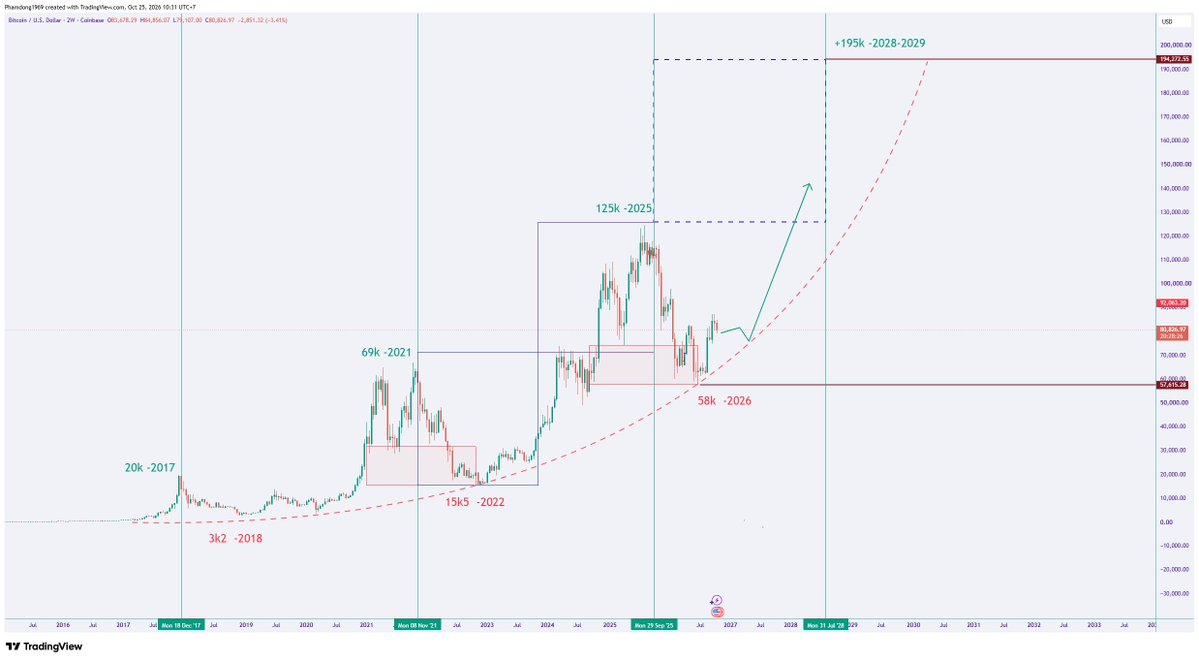
🟠 #BITCOIN: WHERE WILL THE NEXT BTC CYCLE TAKE US? | #PriceTrap
Millions of people are asking: Has Bitcoin bottomed? Where is BTC headed in this cycle? And are $100K, $150K, or even $200K+ still milestones worth looking forward to?
Millions of opinions are shared every day. Some believe BTC’s bull cycle has ended. Others think the market still has another deep decline ahead. Meanwhile, others expect an unprecedented rally.
As for #PriceTrap, I choose to step back, look at the bigger picture, and reflect on the cycle.
I don't try to predict every candlestick. I don't follow the crowd's bullish calls or fear. I want to put every piece of the puzzle on the same chart: price, time, market sentiment, and Bitcoin's different market phases.
From there, a long-term cycle scenario takes shape, and I hope it reaches those who need it.
📍 THE BTC CYCLE THROUGH THE LENS OF PRICETRAP
🟠 10/2025 – 6/2026 | BOTTOMING PHASE
Bottom zone: $58K (completed, according to the analysis)
🟡 7/2026 – 3/2027 | ACCUMULATION PHASE
BTC enters a phase that tests market confidence. This could be a period when investors lose patience, while long-term capital begins positioning for the next leg of the journey.
Key level to watch: BTC reclaiming $82.2K (confirmed to have occurred)
🟢 4/2027 – 11/2027 | GROWTH PHASE
If the market structure continues to strengthen, Bitcoin could enter a more pronounced growth phase. Capital flows, liquidity, and investor sentiment will determine whether the market has enough strength to extend the trend.
🔴 12/2027 – 8/2028 | EXPANSION PHASE?
Scenario target: $195K+
This is the long-term target zone projected by the #PriceTrap chart, not a price level that is guaranteed to be reached. This scenario needs to be reassessed as actual data changes.
━━━━━━━━━━━━━━
WHY DID PRICETRAP CREATE THIS CHART?
Because the important question is not just how high Bitcoin will go, but also:
→ Which phase of the cycle are we currently in?
→ What needs to happen for the market to transition from accumulation to growth?
→ Which price levels will confirm the scenario, and what could invalidate the entire thesis?
I don't believe I can see the future. I simply want to build a roadmap that helps us understand where we are, what we need to watch, and when we need to change our perspective.
The market may follow the chart. Or Bitcoin may surprise us all.
But without a cycle roadmap, every move up or down can cause investors to change their views along with the crowd.
📌 PriceTrap doesn't try to make predictions to please the majority. PriceTrap builds scenarios to offer everyone an additional long-term perspective, with conditions for confirmation and clear limits to what can go wrong.
This is a cycle roadmap that must be validated against real-world data, not a promise about BTC's future price.
PriceTrap View | Read the cycle – Track capital flows – Validate the scenario.
#Bitcoin #BTC #PriceTrap #CryptoCycle
🚨 GOLD LONG-TERM: $8,000 BY 2029–2030? | #PriceTrap
📈 The monthly chart shows gold correcting after a strong rally toward $5,600. Price has now pulled back to the $4,000 area on the weekly chart.
🎯 My outlook: Gold could extend its correction toward $3,000–$3,300 before preparing for another major rally.
🚀 #XAU long-term target: $8,000, potentially by 2029–2030.
#XAU #GOLD #PriceTrap
#BTC#BNB#BINANCE
The key takeaway goes beyond the $6.3 billion figure
Trust risk: Users may reassess the risks of holding assets on centralized exchanges.
Liquidity risk: The temporary suspension of withdrawals could increase risk aversion, even while trading services remain operational.
Contagion risk: Watch whether the pressure spreads to BNB, other exchange tokens, and stablecoins.
#GOLD#XAUUSD
Gold falling from $4,000 to $3,000 could trigger panic among many investors. But looking at the monthly chart, the real story may be the possibility of $8,000 gold by 2029–2030.
WTI – Speculative Positioning Remains Bearish
The data refers to ICE WTI First Line contracts, not NYMEX WTI contracts:
Non-commercial Long: 1,039 contracts.
Short: 7,601 contracts.
Net Short: 6,562 contracts.
Net Short increased by 229 contracts over the week.
Open Interest increased by 1,361 contracts.
Speculators remain heavily tilted toward the Short side. However, it is important to distinguish this ICE data from NYMEX WTI COT data, as the two should not be combined directly.
SILVER – Speculative positioning remains largely unchanged
Long: 35,633 contracts.
Short: 15,930 contracts.
Net Long: 19,703 contracts.
Net Long declined by just 92 contracts week over week.
Open Interest increased by 2,234 contracts.
Silver has come under price pressure, but this week's COT data does not yet show a broad exit from Long positions by major speculators. The key question is whether next week's report will reveal a more significant decline in Net Long positioning.
BITCOIN – Two trader groups are taking different sides
Non-commercial Net Long: +2,720 contracts, up 302.
Commercial Net Short: -2,880 contracts.
Leveraged Funds: Net Short 3,979 contracts, an improvement of 963 contracts from the previous week.
Open Interest: 20,791 contracts.
Key takeaway: Large speculators remain net long, while Leveraged Funds are still net short. However, Leveraged Funds have reduced their net short exposure for the fourth consecutive week.
SILVER – Speculative positioning remains largely unchanged
Long: 35,633 contracts.
Short: 15,930 contracts.
Net Long: 19,703 contracts.
Net Long declined by just 92 contracts week over week.
Open Interest increased by 2,234 contracts.
Silver has come under price pressure, but this week's COT data does not yet show a broad exit from Long positions by major speculators. The key question is whether next week's report will reveal a more significant decline in Net Long positioning.
#GOLD#XAUUSD
GOLD – Long positions remain elevated, but are declining
Non-commercial Long: 223,724 contracts.
Short: 37,273 contracts.
Net Long: 186,451 contracts, down 13,414 week over week.
Open Interest fell by 5,469 contracts.
Key takeaway: Speculators have significantly reduced their Long positions, while Short positions have barely increased. This points more toward Long position closures than a major wave of new Short positions.
#GOLD#XAUUSD#BTC
Something unusual is happening across markets.
On October 30:
Gold dropped 2.7% to $3,910.53, its lowest level in a year.
Silver fell 5.8% to $49.34, breaking below $50.
Bitcoin slipped toward $77,000.
The Nasdaq fell 2%.
Why does this matter?
1. Interest rates: Stronger US inflation and rising oil prices are increasing expectations of higher interest rates. That puts pressure on assets that generate no yield.
2. Technology stocks: Heavy losses in major tech companies have raised concerns about AI investment returns and triggered broader risk reduction.
3. Forced selling: When leveraged positions come under pressure, investors may sell even assets they originally bought as protection.
#GOLD#XAUUSD
Gold falling from $4,000 to $3,000 could trigger panic among many investors. But looking at the monthly chart, the real story may be the possibility of $8,000 gold by 2029–2030.
#GOLD#XAUUSD
Gold falling from $4,000 to $3,000 could trigger panic among many investors. But looking at the monthly chart, the real story may be the possibility of $8,000 gold by 2029–2030.
#GOLD#XAUUSD#XAGUSD
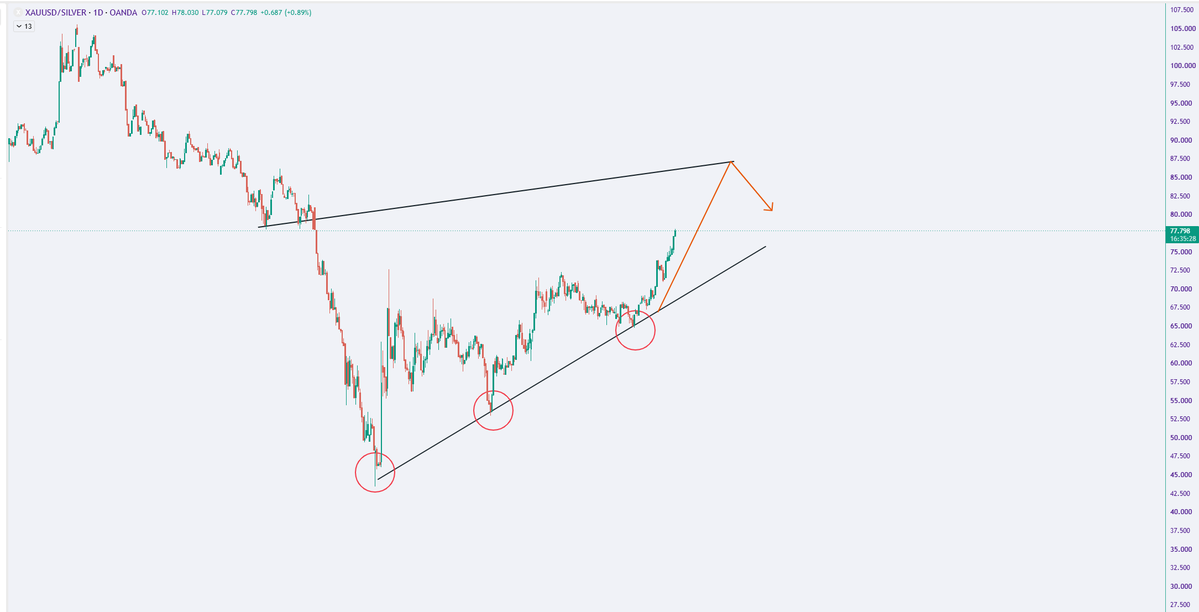
ANALYZING SILVER WITHOUT LOOKING AT THE GOLD/SILVER RATIO IS NOT ENOUGH!
Medium- and long-term gold analysis is already familiar territory for traders. But when it comes to silver, looking at the XAGUSD chart alone is not enough.
One of the most important indicators to watch is the Gold/Silver Ratio.
Why?
When the Gold/Silver Ratio declines, silver is outperforming gold. If both metals are rising, silver may gain faster.
When the ratio rises, silver is underperforming gold. If both metals are falling, silver typically faces greater downside pressure.
When the ratio reaches extreme levels on the long-term chart, the relationship between the two metals may be approaching a significant shift.
That's why you cannot simply read the headlines and conclude that silver is going up or down.
@cz_binance In crypto, one careless click can cost more than a bad trade. I believe Binance remains one of the most trusted and secure platforms for its users.
#Nasdaq#AI#Intel#Amazon
1. Amazon: Shares fell 7.2% in pre-market trading after the company reported weaker free cash flow and signaled higher capital expenditure for next year.
2. Intel: Shares plunged around 25% following a disappointing business outlook. The company expects to continue spending heavily in 2026 amid weak PC demand, expansion costs, and manufacturing bottlenecks.
3. The bigger picture: The market is no longer pricing AI based on its potential alone. Investors are increasingly demanding proof that hundreds of billions of dollars invested in AI infrastructure can generate returns that justify the spending.
This marks an important shift in how the market values AI.
AI may still be a long-term growth trend. But that doesn't mean every company spending heavily on AI will automatically be rewarded with a higher valuation.
The next thing to watch is whether selling pressure spreads across the broader semiconductor and technology sectors.
#Gold#XAUUSD#PriceTrap
SELL TARGET HIT: 4,007 → GOLD NOW AT 3,973
The bearish setup played out.
Gold failed to reclaim the $4,050–$4,066 resistance zone and continued lower, reaching the $4,007 target.
Price has now moved further down to around $3,973.
That's another $34 below the original target.
The important part wasn't predicting every candle. It was identifying the rejection zone, defining the downside target, and waiting for price to confirm the setup.
A bounce doesn't invalidate a bearish structure. And a successful target doesn't mean it's time to chase the move.
The next question is whether sellers remain in control below $4,000.
One setup. One target. Let price do the work.
#Gold#XAUUSD#PriceTrap
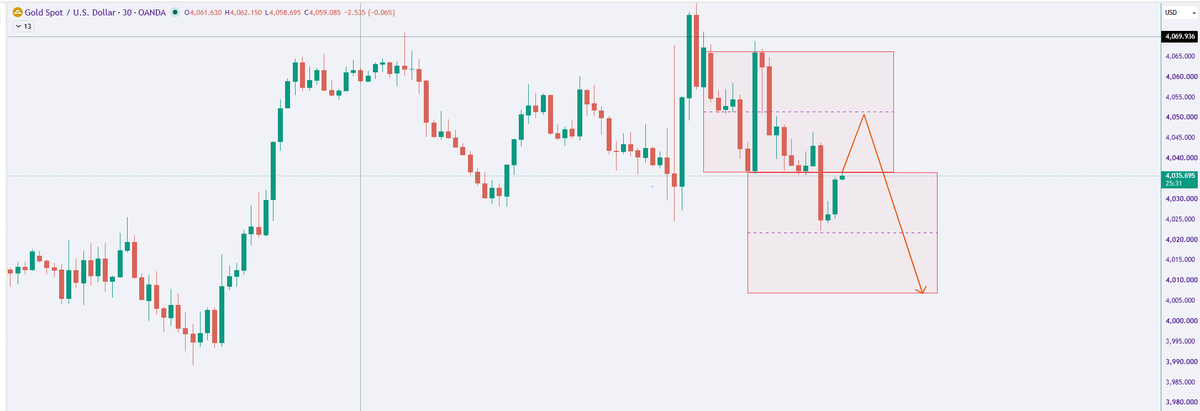
Sell > Taget: 4007
Gold keeps bouncing. But every rebound is running into selling pressure.
On the 30-minute chart, XAUUSD failed to hold above $4,065 and dropped toward $4,023 before bouncing to around $4,035.
The next move matters more than the bounce itself.
If price retests $4,050–$4,066 and gets rejected, another move toward $4,022 and potentially $4,005 becomes possible.
If buyers reclaim $4,066 and hold above it, the bearish setup weakens.
A green candle is a reaction. It isn't confirmation.
#GOLD#XAUUSD#XAGUSD
ANALYZING SILVER WITHOUT LOOKING AT THE GOLD/SILVER RATIO IS NOT ENOUGH!
Medium- and long-term gold analysis is already familiar territory for traders. But when it comes to silver, looking at the XAGUSD chart alone is not enough.
One of the most important indicators to watch is the Gold/Silver Ratio.
Why?
When the Gold/Silver Ratio declines, silver is outperforming gold. If both metals are rising, silver may gain faster.
When the ratio rises, silver is underperforming gold. If both metals are falling, silver typically faces greater downside pressure.
When the ratio reaches extreme levels on the long-term chart, the relationship between the two metals may be approaching a significant shift.
That's why you cannot simply read the headlines and conclude that silver is going up or down.
#GOLD#XAUUSD
Gold is approaching a critical decision zone around $4,000–$4,050/oz. The current scenario points to a potential support breakdown, followed by a retest and further downside. This setup has a technical basis, but price confirmation is still needed.
Market Structure: From a Strong Rally to Weakening Momentum
Phase 1 – Strong Rally
Gold surged from around $3,600 to a peak near $5,250. The rally showed strong momentum, but the market subsequently failed to sustain its bullish structure.
Phase 2 – A Lower High Forms
After the major peak, price rebounded toward $4,600 but failed to surpass the previous high. This signals a weakening long-term bullish structure, with selling pressure gaining the upper hand.
Phase 3 – Support Under Pressure
Gold is currently trading around $4,046, close to the horizontal support zone at $4,000–$4,050. This is a critical area because price has reacted to it in the past.
If the weekly candle closes below $4,000 and price fails to reclaim that level, the bearish structure would be reinforced.
🎯 Potential downside targets:
• $3,900
• $3,800
• $3,427–$3,200 as an extended downside target zone.
#Gold #XAUUSD #PriceTrap
The Nasdaq fell 1.4% on Thursday.
But the broader market didn't follow.
The S&P 500 lost just 0.3%, while the Russell 2000 gained 1%. Most stocks on Wall Street actually finished higher.
The main drag was Alphabet, which suffered its worst decline on record after reporting weaker-than-expected summer growth.
The market's concern wasn't simply about earnings.
It was whether the massive investment in AI infrastructure will generate returns fast enough to justify the spending.
This is an important distinction.
A falling index doesn't always mean broad selling. Sometimes, the weakness is concentrated in a few heavily weighted stocks.
Watch whether selling spreads beyond the AI leaders.
#Nasdaq #SP500 #PriceTrap
#Bitcoin#Crypto
Bitcoin's latest drop wasn't just another move in the charts.
On October 30, BTC fell to a six-week low of $77,646 after Binance reported a potential security issue.
ETH also hit a two-month low of $2,238.76, while BNB dropped more than 8% in 24 hours.
The important detail: Binance said more than $2.5B in assets had been frozen.
Frozen doesn't mean stolen. But security concerns at a major exchange can quickly affect confidence across the crypto market.
The question now is whether this remains an exchange-specific shock, or develops into broader selling pressure.
Watch how the market responds as more details emerge.
#BTC#XAUUSD#XAG
Why are all three markets falling?
Three key factors are worth watching:
BTC: Risks surrounding Binance have weakened market confidence and triggered a broader risk-off sentiment.
Gold and silver: Expectations that US interest rates could rise further are putting pressure on non-yielding assets.
Market sentiment: Investors are reducing their risk exposure. Silver is more volatile than gold, which explains its sharper decline.
Announcement date: October 28, 2026.
Market capitalization: Over $2.4 billion, according to Ripple's official announcement. Market tracking platforms currently report approximately $2.6 billion.
Supported networks: XRP Ledger, Ethereum, and Base.
Important: Coinbase Global Exchange integration and the use of RLUSD as collateral have been announced for a later rollout. They should not be described as already live.
Ripple's RLUSD is now available across Coinbase's retail and institutional platforms.
The stablecoin can be accessed through Coinbase Prime, Coinbase Exchange and the retail app, with support across XRP Ledger, Ethereum and Base.
RLUSD has already surpassed $2.4B in market capitalization, according to Ripple.
The important part isn't simply another exchange listing.
It's distribution.
A stablecoin becomes more useful when users can access it through the platforms they already use for trading, custody and settlement.
But wider access doesn't automatically mean more payment activity.
The next thing to watch is whether this new distribution translates into actual usage.
BTC can sweep both sides before choosing a direction.
Over the past 24 hours, $146.1M in crypto positions were liquidated.
70% came from Longs. 30% from Shorts.
BTC accounted for $23.6M.
The interesting part isn't just who got liquidated.
It's what happens next.
If BTC keeps falling, more Longs could be forced out.
If it reclaims higher levels, late Shorts could become the next source of liquidity.
A liquidation imbalance tells you who got hurt.
It doesn't tell you where price goes next.
Watch the reaction after the sweep.
#BTC #PriceTrap