

Top Tweets for #TcellExpansion

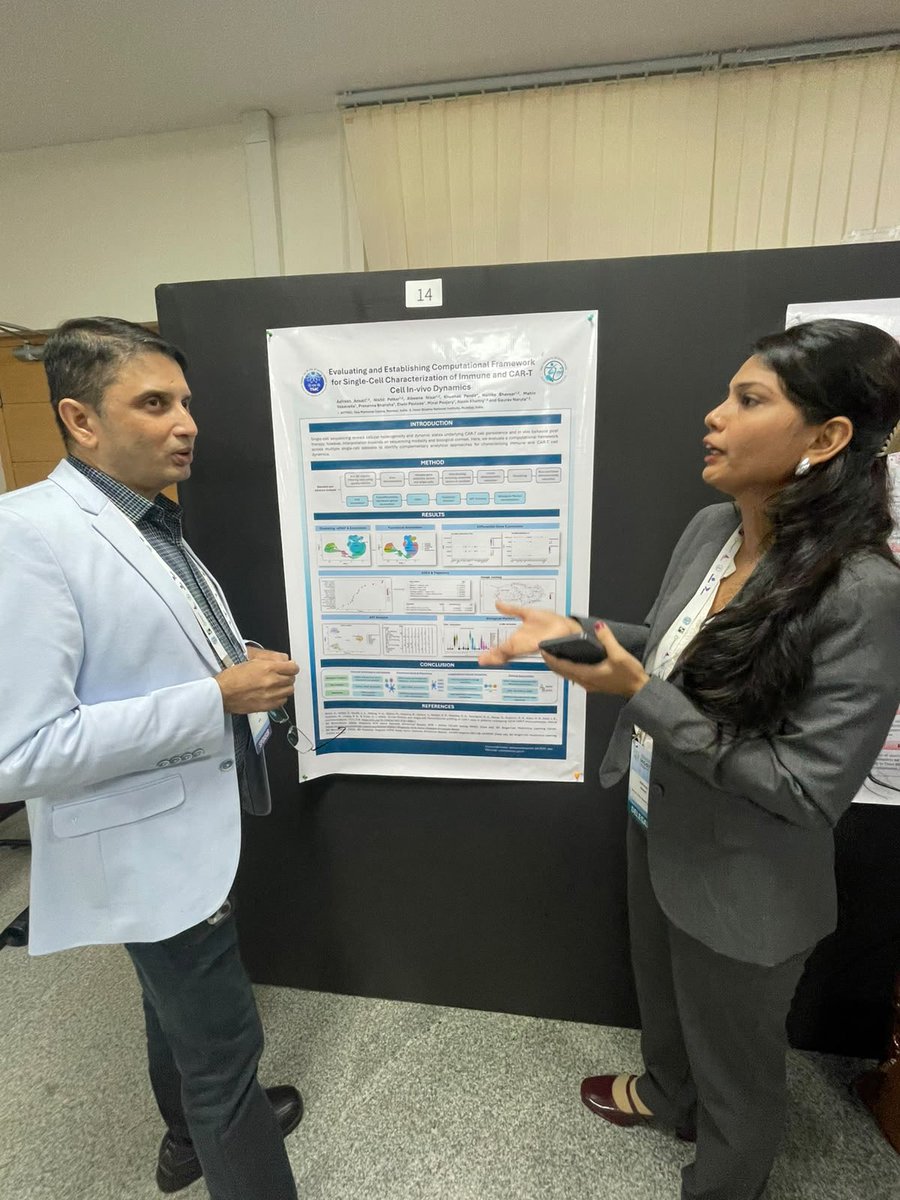
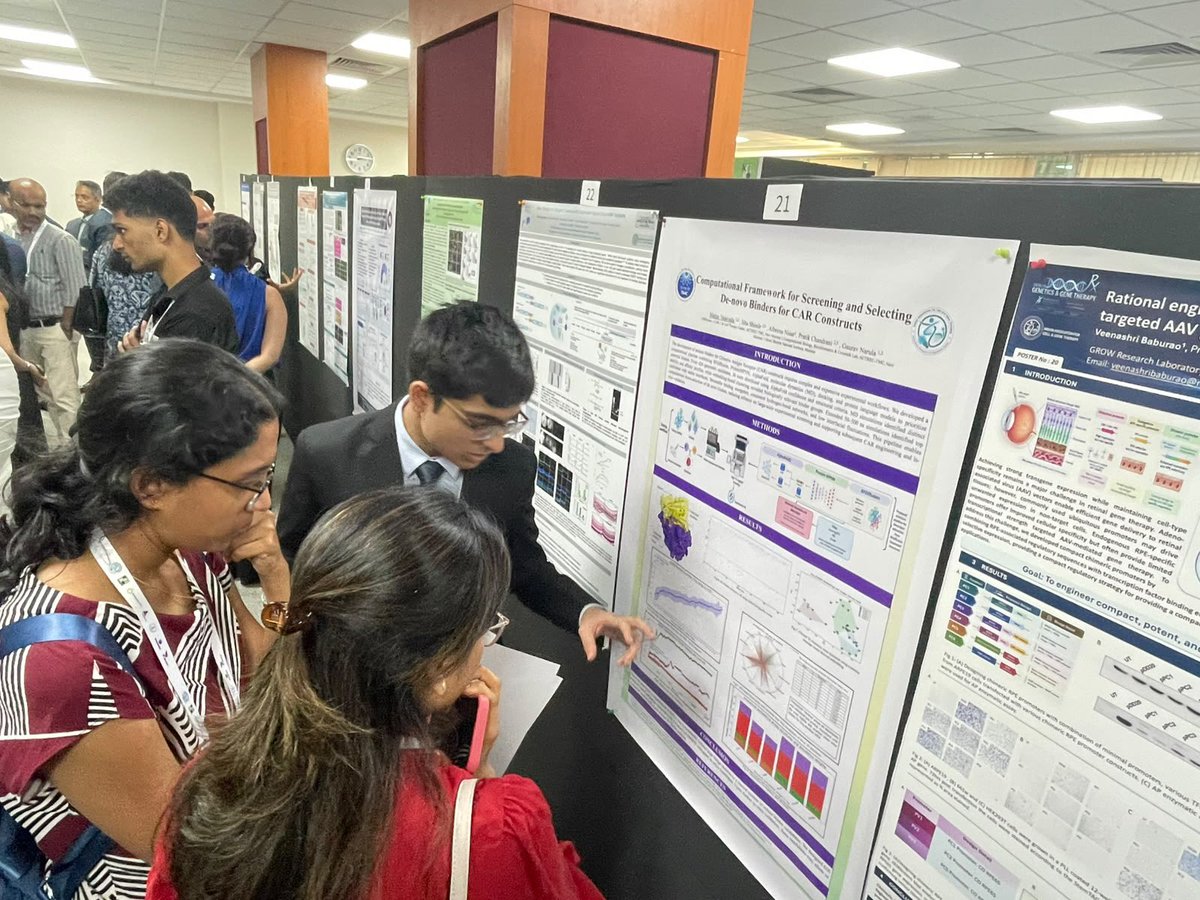
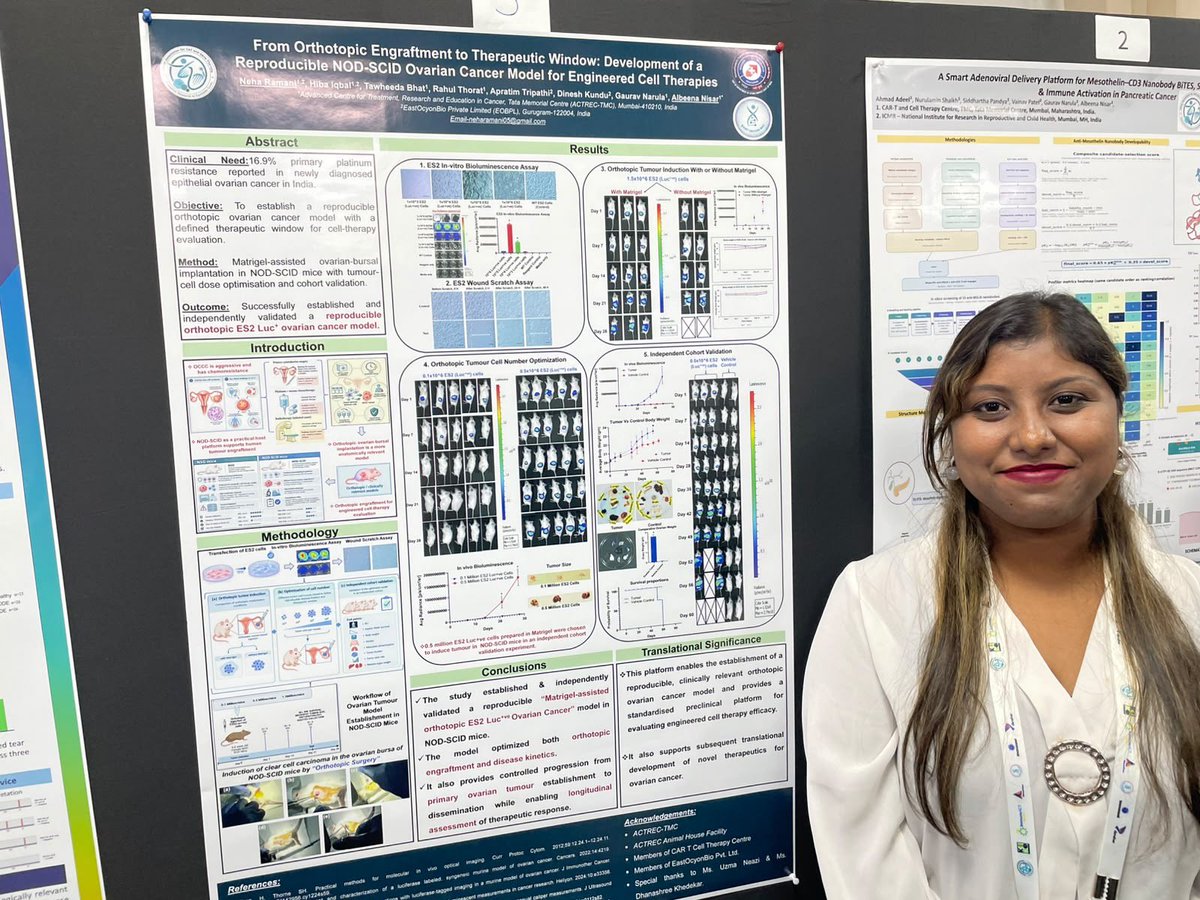
#TeamCTCTC at #IACGT2026, presenting our work through insightful poster presentations. - Part 1
Featuring : @AafreenAnsari44, Dr. Neha Ramani, @MahinVasavada, Ms. Uzma Neazi
@IndiACGT @ACTREC_TMC
#InVivoDynamics #AnimalModels #CARConstructs #TcellExpansion


🎭🧠🧬 The Loop Closes
How the $NWBO #DCVax #Eden Patent Solves the Failure Mode — Why $MRK Built the Same Framework Under the Name “APC” — and Why This Looks Like #AWS, Not a Drug
#CancerImmunotherapy #TCellExpansion #SystemsBiology #CellTherapy #Immunology #BioprocessDesign #APC #ImmuneOS #AWSModel
At this point, the arc is complete.
The Nature Immunology 2025 paper defined the failure mode that has quietly limited every generation of cancer immunotherapy:
Durable control fails not because tumors are invisible,
but because the immune system runs out of the only T cells that matter.
That paper showed:
• Exhaustion is a programmed fate, not fatigue
• Durable immunity depends on a rare, stem-like CD8⁺ reservoir
• Chronic, monotonic stimulation destroys that reservoir
• Metabolic and mechanical stress lock cells into terminal states
• Fate is plastic only before infusion
In short: durability is a population-maintenance problem.
The patent does not argue with that conclusion.
It implements it.
Every figure maps directly onto a failure mode the paper identifies:
• FIG. 1 — expansion as a system, not a container
• FIG. 2 — chamber geometry and flow to control stress
• FIG. 3 — motion to pattern contact in time
• FIG. 4 — a closed loop so exposure is reproducible
• FIG. 5 — sustained kinetics without early collapse
• FIG. 6 — absolute scale that satisfies population math
• FIGS. 7 & 8 — preserved phenotype and hierarchy
• FIG. 10 — low toxicity, no stress-driven die-off
• FIG. 11 — serial APC refresh, enabling expansion without exhaustion
Nothing here is decorative.
But FIGURE 12 is the quiet tell.
FIGURE 12 demonstrates that the same serial APC-guided expansion logic can be executed across alternate physical configurations and sequencing choices.
In systems terms, this establishes degeneracy: multiple implementations executing the same immune algorithm.
That is the signature of a platform, not a fragile device.
This is where the AWS analogy becomes precise.
AWS did not sell applications.
It sold execution under rules:
• standardized primitives
• enforced constraints
• telemetry and audit
• repeatability across locations
• scale without owning endpoints
This patent does the same thing for immunotherapy.
It does not sell a therapy.
It defines how immune instruction is executed, regardless of where the hardware sits.
That is why the language matters.
The patent uses “APC” rather than a product name because it is claiming a function, not a brand: repeated, high-quality immune instruction without exhaustion. In practice, professional dendritic cells are the only APCs capable of fulfilling this role at scale. In the Northwest Biotherapeutics system, those APCs are DCVax-class dendritic cells — the reference implementation that already embodies this biology.
But FIGURE 12 shows that the execution logic is not tied to one machine, one site, or one layout.
That is what makes EDEN licensable.
This abstraction also explains Merck’s strategy.
Across its infrastructure, manufacturing design, and program language, $MRK consistently describes its next-generation immune work as “APC-based therapy.” Not dendritic. Not vaccine. APC.
That phrasing is not vague. It is deliberate.
Merck built a global immune manufacturing framework — modular cleanrooms, deep cryogenic storage, kit-level traceability, APC-compatible booster serialization, and real-time automation — that is clearly designed to run dendritic-cell instruction logic, while avoiding naming a specific, already-protected method.
In other words:
• DCVax is the biological reality
• APC is the legal abstraction
• FIGURE 12 proves the platform can run anywhere
• Merck built the immune OS the way AWS built cloud compute: execution first, payload abstracted
The Nature paper explains why durability collapses.
The patent shows how to prevent that collapse.
FIGURE 12 shows it won’t break when scaled.
Merck shows how a global pharma deploys it without naming the payload.
Taken together, they point to one conclusion:
Cancer immunotherapy does not fail at recognition.
It fails at sustaining the immune population under pressure.
This system — from biology, to patent, to platform — was built to solve that problem.
That is why T-cell expansion is the whole game.

🔁 $NWBO #DCVax #Eden FIGURE 11 — Expansion as a Loop, Not a Burst
Why the APC Is DCVax — and Why the Platform Stays Broad
#TCellExpansion #CellTherapy #Immunotherapy #BioprocessDesign #SystemsBiology #Microfluidics #DCVax #PlatformIP
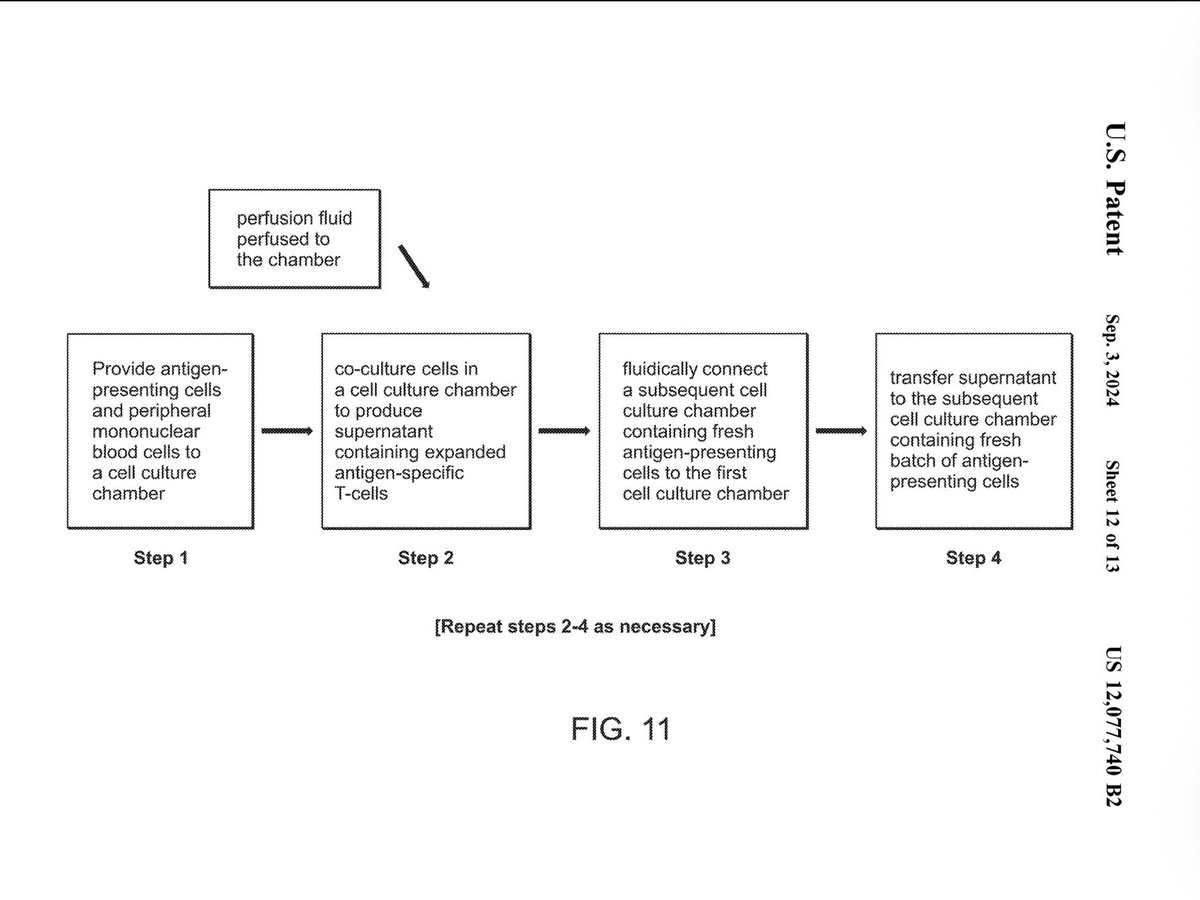
FIGURE 11 reveals the governing logic of the entire system: how expansion actually unfolds over time.
This figure depicts a serial expansion loop, not a single, continuous culture. The steps are explicit:
1️⃣ Antigen-presenting cells (APCs) and peripheral blood cells are co-cultured in a chamber.
2️⃣ Antigen-responsive T cells expand into the supernatant.
3️⃣ That supernatant is transferred to a new chamber with fresh APCs.
4️⃣ The cycle repeats as needed.
This is not a minor optimization.
It is a philosophical decision.
Most expansion systems assume that once activation begins, it should be maintained continuously. FIGURE 11 rejects that assumption. Instead, it treats expansion as a sequence of encounters, each bounded in time and context.
Several consequences follow directly from this design:
• APCs are refreshed, preventing exhaustion or signal decay in the presenting population.
• T-cell engagement is pulsed, not monotonic, introducing recovery windows between stimulation events.
• Signal saturation is avoided by resetting the interaction context each cycle.
• Selection is reinforced at every pass—only responsive cells continue forward.
This loop transforms expansion from brute-force amplification into a patterned process.
In practice, the APC that best fulfills this role is a professional dendritic cell. In the Northwest Biotherapeutics system, those APCs are DCVax dendritic cells—autologous, mature, whole-tumor–lysate–loaded dendritic cells optimized specifically for repeated, high-quality immune instruction.
DCVax cells are uniquely suited to this loop because they:
• present broad tumor antigen repertoires
• provide balanced costimulation
• sustain IL-12–dominant, Th1-polarizing signals
• tolerate serial refresh without losing instructional fidelity
That is the biological reality of FIGURE 11.
At the same time, the patent deliberately uses the term “APC” rather than naming DCVax. That choice is intentional.
FIGURE 11 defines the APC by function, not by branding. Any APC that can meet the instructional demands of the loop can, in principle, be used. This abstraction is what makes the expansion engine licensable as a platform, rather than hard-coded to a single product.
Biology and IP converge cleanly here:
• DCVax is the reference APC implementation
• APC is the protected functional class
Another key point is scalability. The loop does not require higher intensity to achieve higher yield. Scale is achieved by repetition, not escalation. Additional cycles add opportunity for division without increasing stress per cycle.
FIGURE 11 also clarifies why earlier figures matter:
• FIGURE 2 defined a chamber that supports controlled exposure.
• FIGURE 3 showed how motion patterns contact in time.
• FIGURE 5 demonstrated sustained growth kinetics.
• FIGURE 6 showed absolute yields reaching therapeutic scale.
• FIGURES 7 & 8 confirmed phenotype preservation.
• FIGURE 10 established low toxicity.
FIGURE 11 ties all of that together into a repeatable expansion algorithm—one that preserves immune quality while allowing scale.
The loop enforces discipline. It prevents the system from “turning up the volume” to chase numbers. Instead, it lets numbers accrue through structured repetition.
Expansion achieved by escalation often collapses.
Expansion achieved by looping can continue.
If FIGURE 1 declared expansion to be architectural,
and FIGURES 2–10 showed how that architecture preserves scale, identity, and safety,
FIGURE 11 shows the rule that makes the system durable—while keeping it extensible.
Expansion is not a burst.
It is a loop.
And in this system, DCVax is the APC that makes the loop biologically real, while the APC abstraction ensures the platform can endure, evolve, and be licensed.
☠️ $NWBO #DCVax #Eden — FIGURE 10: Selectivity Without Toxicity
#CellTherapy #TCellExpansion #Immunotherapy #CellDeath #Biomanufacturing #ProcessSafety
FIGURE 10 addresses a concern that often hides behind impressive expansion numbers:
Are cells being expanded selectively, or are they being driven through stress and replacement?
This figure uses dead Jurkat cells as a negative control, providing a clear reference for what indiscriminate activation or toxic handling would look like. Jurkat cells are a T-cell leukemia line that responds predictably to stress, making them an ideal sentinel for nonspecific damage.
The comparison is unambiguous:
• Dead Jurkat controls show high levels of cell death
• Expansion conditions show low levels of cell death, even at higher input cell numbers
This immediately tells us something important about how the system operates.
Expansion here is not being achieved by:
• overwhelming stimulation
• harsh mechanical agitation
• toxic accumulation of waste
• indiscriminate activation followed by die-off
Instead, the system supports proliferation without first pushing cells into apoptosis.
Why this matters:
In many expansion protocols, apparent growth masks a destructive cycle. Cells are overstimulated, a fraction dies, and the survivors repopulate the culture. The final yield looks large, but the process quietly selects for stress-resistant phenotypes rather than functionally fit ones.
FIGURE 10 argues against that failure mode.
Low death rates under expansion conditions indicate that:
• cells are not being forced past their stress limits
• proliferation is not coupled to widespread apoptosis
• expansion remains within a tolerable biological envelope
This conclusion aligns with earlier figures showing:
• sustained growth over time (FIG. 5)
• high absolute yields without plateau (FIG. 6)
• preserved phenotype and viability (FIGS. 7 & 8)
FIGURE 9 independently reinforces this interpretation by confirming that functional and phenotypic integrity is maintained under expansion conditions, ruling out stress-selection as the driver of observed growth.
FIGURE 10 therefore closes a critical safety loop. It shows that the system’s control logic—geometry, flow, motion, and staged interaction—does more than preserve identity. It prevents unnecessary cell loss.
Selectivity matters because durable immune responses depend on preserving cells that retain proliferative and functional potential over time. Toxic expansion strategies may produce numbers, but they do so by burning through that future.
If earlier figures established that the system scales and preserves phenotype,
FIGURE 10 establishes that it does so without collateral damage.


🧬 $NWBO #DCVax #Eden FIGURE 8 — Robustness Is the Point, Not the Edge Case
#CellTherapy #TCellExpansion #FlowCytometry #ProcessRobustness #Immunotherapy #Biomanufacturing
FIGURE 8 answers a question that determines whether an expansion system is practical or fragile:
Does the behavior we saw in FIGURE 7 hold when conditions change?
This figure extends the phenotype analysis across multiple culture formats and conditions, rather than presenting a single optimized snapshot. It is explicitly designed to test robustness, not best-case performance.
What FIGURE 8 shows:
• Across different culture configurations, lymphocyte gating remains intact.
• CD8⁺ and CD4⁺ proportions remain within physiologic ranges.
• Viability stays high across conditions.
• No condition produces runaway skewing or collapse.
This matters because most expansion systems perform acceptably only under narrow, tightly tuned conditions. Small deviations in media composition, timing, or handling often lead to:
• disproportionate subset expansion
• helper cell loss
• stress-selected populations
• reduced functional diversity
FIGURE 8 shows that this system behaves differently.
The expansion outcome is stable across variation, indicating that the controlling factors are architectural rather than incidental. When geometry, flow, and interaction timing are doing the regulatory work, modest changes in external conditions do not derail the result.
Another important point is what FIGURE 8 does not show:
• no evidence of cumulative damage across conditions
• no progressive loss of viability
• no emergence of abnormal populations
This suggests that the system is not operating at the edge of biological tolerance. It is operating within a wide, forgiving envelope.
That distinction is critical for real-world use.
Reproducibility in cell therapy does not mean every run is identical. It means that meaningful properties are preserved despite normal process variation.
FIGURE 8 demonstrates that:
• expansion logic is not brittle
• outcomes are not dependent on a single narrow parameter set
• phenotype preservation is an emergent property of the system
When read together:
• FIGURE 5 showed that controlled expansion scales
• FIGURE 6 showed it reaches real therapeutic numbers
• FIGURE 7 showed identity is preserved
• FIGURE 8 shows that all of this holds under variation
That is the definition of a manufacturable process.
FIGURE 8 is therefore less about any one condition and more about confidence. It tells you that the behavior observed in earlier figures is not a coincidence. It is the result of a system designed to produce the same kind of outcome repeatedly.
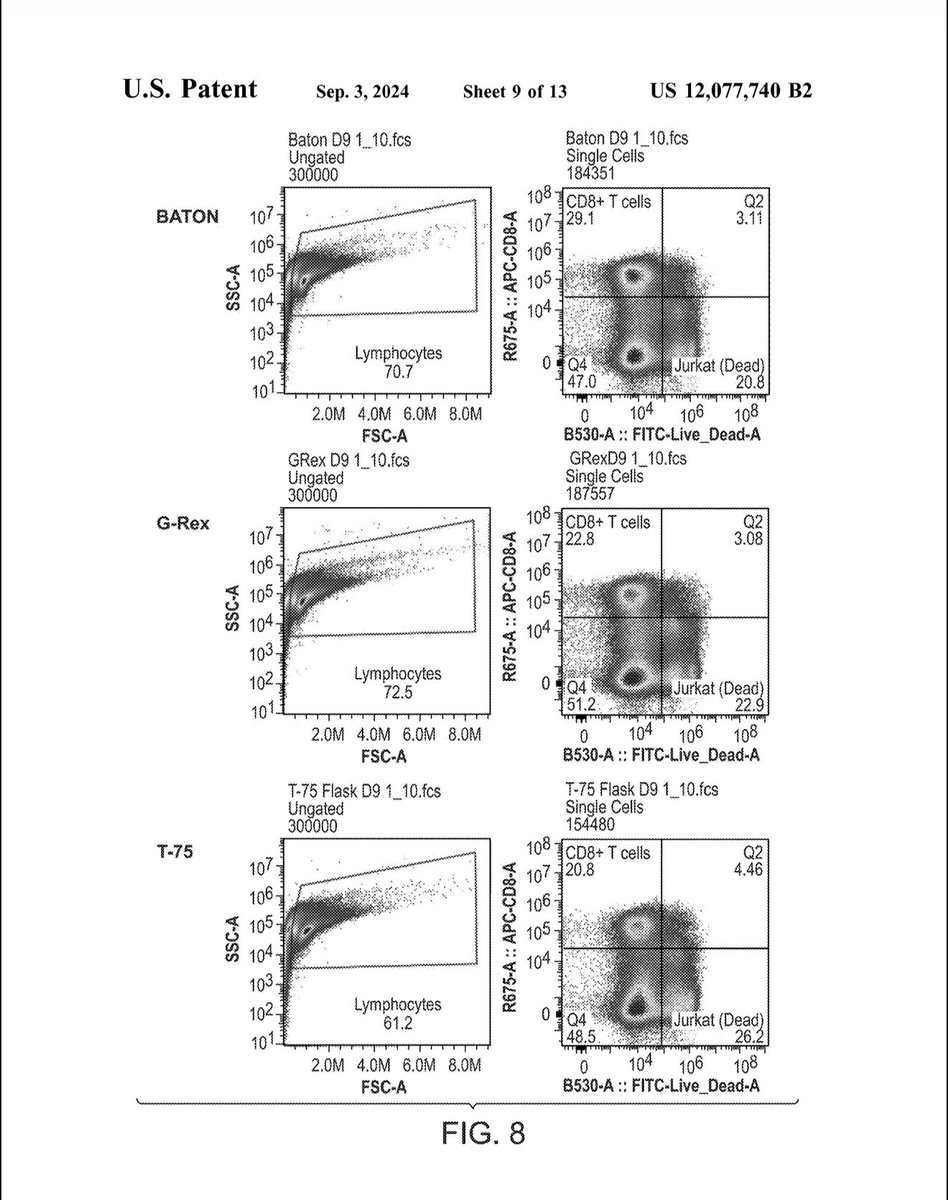
🧬 $NWBO #DCVax #Eden FIGURE 7 — Expansion Without Identity Collapse
#TCellPhenotype #CellTherapy #Immunotherapy #FlowCytometry #Biomanufacturing #TCellExpansion
FIGURE 7 asks a question that raw growth curves cannot answer:
What kind of cells were actually produced?
This figure presents flow cytometry data comparing post-expansion populations across systems, focusing on:
• lymphocyte gating
• CD8⁺ T-cell fractions
• CD4⁺ T-cell fractions
• live/dead discrimination
These measurements are not cosmetic. They determine whether expansion preserved immune hierarchy or destroyed it.
Several points stand out immediately:
• Lymphocyte populations remain well defined, with no evidence of collapse into debris or non-specific cell mass.
• CD8⁺ T cells expand robustly without eliminating CD4⁺ support populations.
• Viability remains high, indicating that proliferation was not achieved through stress-induced apoptosis and replacement.
Why this matters:
Expansion systems that rely on intense, continuous stimulation often produce impressive numbers while quietly erasing critical structure. They skew populations, exhaust helper subsets, and select for cells that survive stress rather than cells that retain function.
FIGURE 7 shows the opposite.
The expanded population maintains:
• compositional balance
• phenotypic clarity
• viability consistent with sustained proliferative reserve
This suggests that cells were allowed to divide without being forced into terminal states.
Another important implication of FIGURE 7 is what it does not show:
• no runaway dominance of a single subset
• no collapse of helper populations
• no massive dead-cell fraction hiding beneath total counts
This figure demonstrates that the expansion architecture preserves who the cells are, not just how many exist at the end.
When FIGURE 7 is read alongside FIGURES 5 and 6, a critical conclusion emerges:
The system did not trade identity for scale.
It achieved scale while preserving structure.
That combination is rare.
FIGURE 7 is therefore the first clear checkpoint that this expansion logic produces usable immune populations, not just large ones.


🔢 $NWBO #DCVax #Eden FIGURE 6 — Absolute Numbers Are the Constraint
#TCellExpansion #CellTherapy #Immunotherapy #Biomanufacturing #GMP #ProcessEngineering
FIGURE 6 answers the question that ultimately decides whether any expansion system is clinically relevant:
Can it produce enough cells to matter?
This figure moves beyond fold-change curves and shows absolute T-cell numbers, comparing starting cell counts (Day 0) to final yields (Day 7). The distinction is crucial. Fold expansion can look impressive while still producing too few cells for therapy. Absolute numbers expose whether a system actually clears the dose threshold.
The result is unambiguous:
• Final yields reach hundreds of millions to approximately one billion T cells within the culture window.
• Output from the patterned system is comparable to or greater than conventional static formats.
• No evidence of early plateauing that would cap total yield.
Why this matters:
Immune populations that determine durable control are rare at baseline. Any system that preserves quality but fails to scale quantity cannot succeed clinically. Conversely, systems that scale quantity by brute force often destroy proliferative reserve before reaching meaningful totals.
FIGURE 6 shows that this system satisfies population math without relying on stress-inducing shortcuts.
Another important observation is the trajectory implied by the bars. Growth is not front-loaded into a brief surge. It accumulates steadily over time, consistent with sustained proliferative capacity rather than forced division.
That pattern aligns with a process designed to:
• maintain nutrient availability
• prevent waste accumulation
• avoid prolonged saturation
• support repeated cell-cycle entry
The figure also dispels the idea that disciplined expansion is inherently “boutique.” The yields shown are squarely in the range required for real-world therapeutic dosing. This is not a proof-of-concept scale. It is production scale.
FIGURE 6 therefore closes a critical loop opened by FIGURE 5:
• FIGURE 5 showed that control does not limit rate of growth.
• FIGURE 6 shows that control does not limit total output.
Together, they demonstrate that expansion can be both managed and massive.
If FIGURE 5 dismantled the durability-versus-scale myth in principle,
FIGURE 6 dismantles it in practice.

📈 $NWBO #DCVax #Eden FIGURE 5 — Control Does Not Limit Growth
#TCellExpansion #CellTherapy #Bioprocessing #Immunotherapy #GMP #ProcessDesign
FIGURE 5 confronts the most common objection to disciplined expansion:
If you add control, don’t you cap proliferation?
The answer in the data is no.
This figure plots fold expansion over time, comparing the system described in the patent (BATON) against a widely used static expansion format (G-Rex). Both conditions support T-cell growth. What matters is how that growth is achieved.
Several observations are immediate:
• BATON achieves equal or greater fold expansion across the measured time window.
• Growth curves are smooth and sustained, not spiky.
• There is no early plateau that would suggest growth inhibition.
This matters because the dominant narrative in cell therapy has been that:
• maximal stimulation is required for maximal expansion
• control necessarily trades off with yield
FIGURE 5 directly contradicts that assumption.
What it shows instead is that patterned, controlled exposure can sustain proliferation without inducing early collapse. Cells continue to divide because they are not pushed into stress responses that prematurely limit growth.
Another important feature of this figure is what it does not show:
• no explosive early spike followed by stagnation
• no sudden inflection suggesting toxicity or exhaustion
Those patterns are common in brute-force expansion systems. They look impressive early and then stall as cells lose proliferative reserve.
FIGURE 5 shows the opposite: managed kinetics.
This suggests that growth is being supported by:
• maintained nutrient availability
• waste removal before accumulation
• controlled interaction timing
• avoidance of continuous saturation
In other words, the system is not forcing cells to divide faster than their biology can support. It is allowing them to divide longer.
That distinction matters.
Sustained expansion over time is more valuable than rapid expansion that collapses. FIGURE 5 shows that control does not slow growth—it extends it.
This figure reframes a key misconception:
The choice is not between scale and discipline.
The real choice is between short-lived acceleration and durable proliferation.
FIGURE 5 demonstrates that when expansion is engineered as a process, not a blast of stimulus, scale follows naturally.

🔗 $NWBO #DCVax #Eden FIGURE 4 — When Expansion Becomes Part of the Therapy
#CellTherapy #TCellExpansion #Biomanufacturing #ClosedSystems #GMP #ProcessEngineering
FIGURE 4 answers a question that most expansion platforms never confront: where does expansion actually sit in the therapy?
This figure places expansion inside a closed, end-to-end clinical loop:
• cell collection
• cell separation
• cell expansion
• washing and concentration
• formulation
• cold chain
• reinfusion
Expansion is not shown as an isolated laboratory step. It is shown as a node in a continuous circuit with defined inputs and outputs.
That framing matters.
When expansion is treated as a standalone step, variability is tolerated and corrected downstream. When expansion is embedded in a closed loop, variability becomes exposure. The history of how cells were handled becomes part of what the patient receives.
Several implications are built into FIGURE 4:
• Exposure is defined by process, not just by dose.
• Each transition is explicit, not inferred.
• Cells move through stages with documented transformations.
• The system enforces continuity from collection to infusion.
This is not simply about logistics or compliance. It is about interpretability.
If cell fate is shaped upstream, then outcomes downstream can only be understood if the upstream process is stable and traceable. FIGURE 4 makes that stability a design requirement.
Another subtle but important point: FIGURE 4 does not assume genetic modification. It allows for optional branches, but the core logic stands without them. Expansion is treated as a primary determinant of behavior, not a secondary amplification step.
By closing the loop, the system turns expansion into a repeatable intervention rather than an artisanal procedure. Cells are not just grown; they are processed through a sequence whose structure can be reproduced.
FIGURE 4 also clarifies why the earlier figures matter. The chamber geometry in FIGURE 2 and the motion control in FIGURE 3 are not isolated optimizations. They are prerequisites for a loop in which each run must be comparable to the last.
When expansion is part of a closed loop:
• uncontrolled drift cannot be ignored
• ad-hoc corrections are not acceptable
• the process itself becomes the product
FIGURE 4 is the moment where expansion stops being “how many cells did we get?” and becomes “what experience did these cells undergo?”
That shift is foundational.
If FIGURE 1 defined expansion as a system,
and FIGURES 2–3 defined how that system shapes cell behavior,
FIGURE 4 defines why expansion must be reproducible to be meaningful at all.

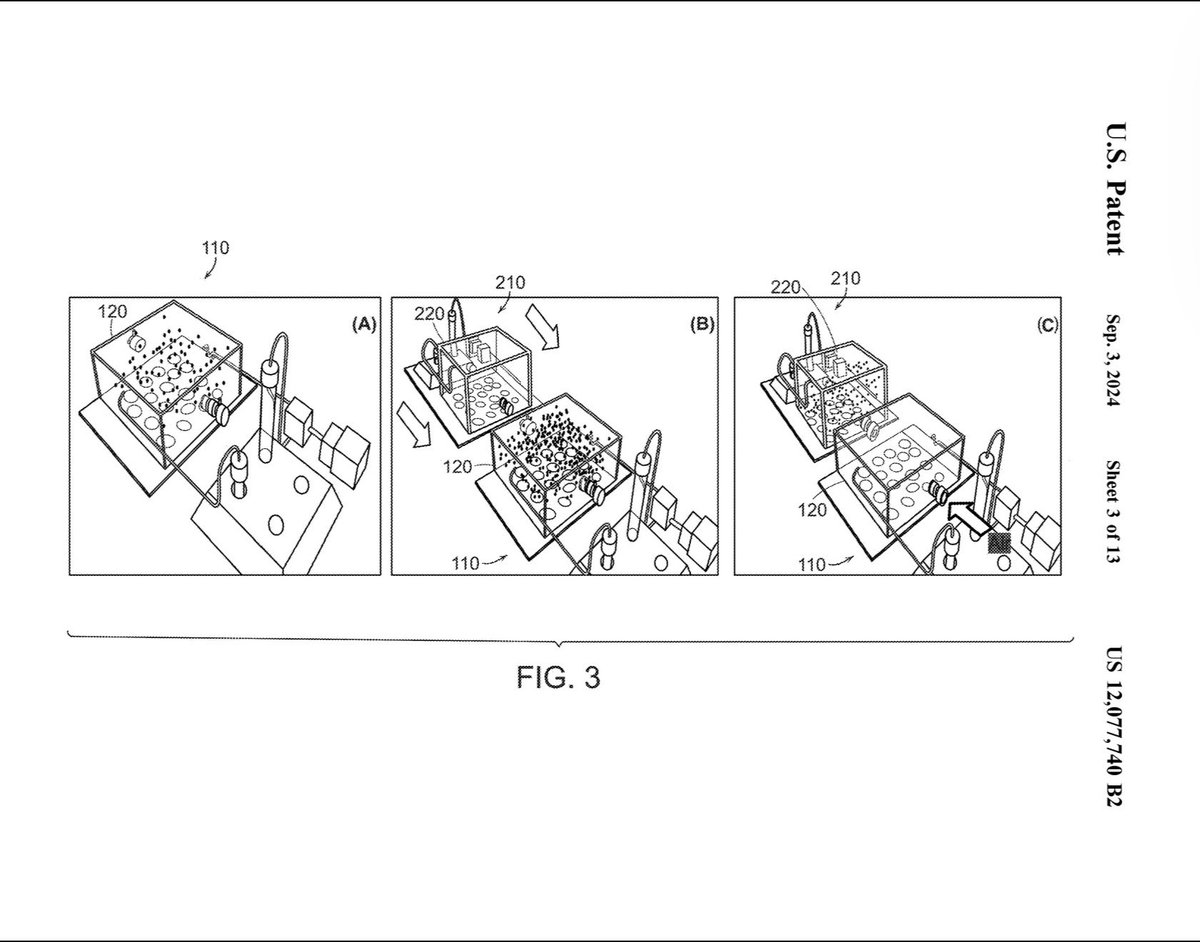
🔬 $NWBO #DCVax #Eden FIGURE 3 — Motion Turns Contact into a Variable
#CellTherapy #TCellExpansion #BioprocessEngineering #Immunotherapy #Microfluidics #CellDynamics
FIGURE 3 answers the next question the system poses: how are cell–cell interactions controlled in time?
This figure introduces motion as an active design element. Cells are not left to collide randomly, nor are they held in continuous contact. Instead, the system uses directed movement to regulate when, where, and for how long cells interact.
Key features in FIGURE 3:
• Chambers are tilted and repositioned, creating predictable circulation paths.
• Cells are redistributed repeatedly, rather than settling into static clusters.
• Contact events occur in bursts, separated by periods of disengagement.
• Interaction frequency and duration are governed by mechanics, not chance.
This is a fundamental departure from static culture.
In conventional expansion, cells experience:
• continuous proximity
• prolonged receptor engagement
• accumulating local stress
Those conditions make interaction monotonic. Once contact begins, it does not stop.
FIGURE 3 replaces monotonic contact with patterned engagement.
By forcing cells to move through the chamber, the system:
• limits how long any two cells remain engaged
• prevents signal saturation
• avoids prolonged receptor occupancy
• introduces recovery windows between interactions
This matters because immune signaling is time-dependent, not just concentration-dependent. Cells interpret duration and frequency of engagement as information. Continuous engagement conveys a very different message than repeated, transient contact.
Another important point: the motion in FIGURE 3 is gentle and repeatable. There is no indication of turbulent mixing or harsh agitation. The goal is not to maximize collisions. It is to shape exposure.
FIGURE 3 shows that the inventors are not relying on cytokine dose or receptor density alone to control behavior. They are using physical timing as a regulatory lever.
This turns mechanics into biology.
When movement controls contact, and contact controls signaling, then motion becomes a way to govern cell fate without adding more stimulus.
FIGURE 3 does not yet tell us how fast cells expand or how many are produced. It establishes the rules of engagement that expansion will follow.
If FIGURE 2 defined the chamber as the control surface,
FIGURE 3 defines motion as the control knob.
Together, they show that expansion in this system is designed to be patterned by physics, not driven by brute-force stimulation.
🧪 $NWBO #DCVax #Eden FIGURE 2 — The Chamber Is the Control Surface
#CellTherapy #TCellExpansion #Bioprocessing #Microfluidics #Immunotherapy #CellManufacturing #SystemsBiology
FIGURE 2 takes us inside the system and answers the next critical question:
How do cells actually experience this device?
What you see in FIGURE 2 is not just a container. It is a designed environment, where geometry, flow paths, and compartmentalization determine how immune cells behave over time.
Several elements are doing real biological work here:
• The chamber is not uniform. Different regions serve different functions.
• Fluidic inlets and outlets are positioned deliberately, creating controlled flow rather than random mixing.
• Cells are exposed to continuous perfusion, not static media.
• Physical boundaries separate zones of interaction from zones of transit.
This matters because static culture assumes that:
• signal strength is the same everywhere
• nutrients and waste distribute evenly
• cells experience identical conditions over time
That assumption is false for immune cells.
In static systems, local depletion of nutrients, accumulation of waste products, and prolonged contact all happen simultaneously. Cells are forced into chronic exposure whether or not that exposure is biologically appropriate.
FIGURE 2 replaces that with engineered heterogeneity.
By controlling where fluid enters, where it exits, and how it moves through the chamber, the system can:
• maintain nutrient availability
• remove metabolic waste before it accumulates
• limit uncontrolled crowding
• prevent prolonged, unbroken exposure to the same conditions
In other words, the chamber geometry itself becomes a regulatory mechanism.
Another subtle but important point: cells are not immobilized in FIGURE 2. They are carried, redistributed, and reintroduced through defined paths. That means exposure is governed by movement and timing, not just concentration.
This is the opposite of brute-force expansion.
The design assumes that:
• cell fate depends on duration and frequency of exposure
• prolonged, unmodulated contact is harmful
• environment shapes identity as much as molecular signals
FIGURE 2 is where expansion stops being “add cytokines and wait” and starts being process engineering.
It does not yet show interaction patterns or growth curves. It establishes the physical rules that make those later results possible.
If FIGURE 1 declared expansion to be a system,
FIGURE 2 defines the chamber as the system’s control surface.
Everything that follows—cell interaction patterns, expansion kinetics, phenotype preservation—depends on this physical foundation.

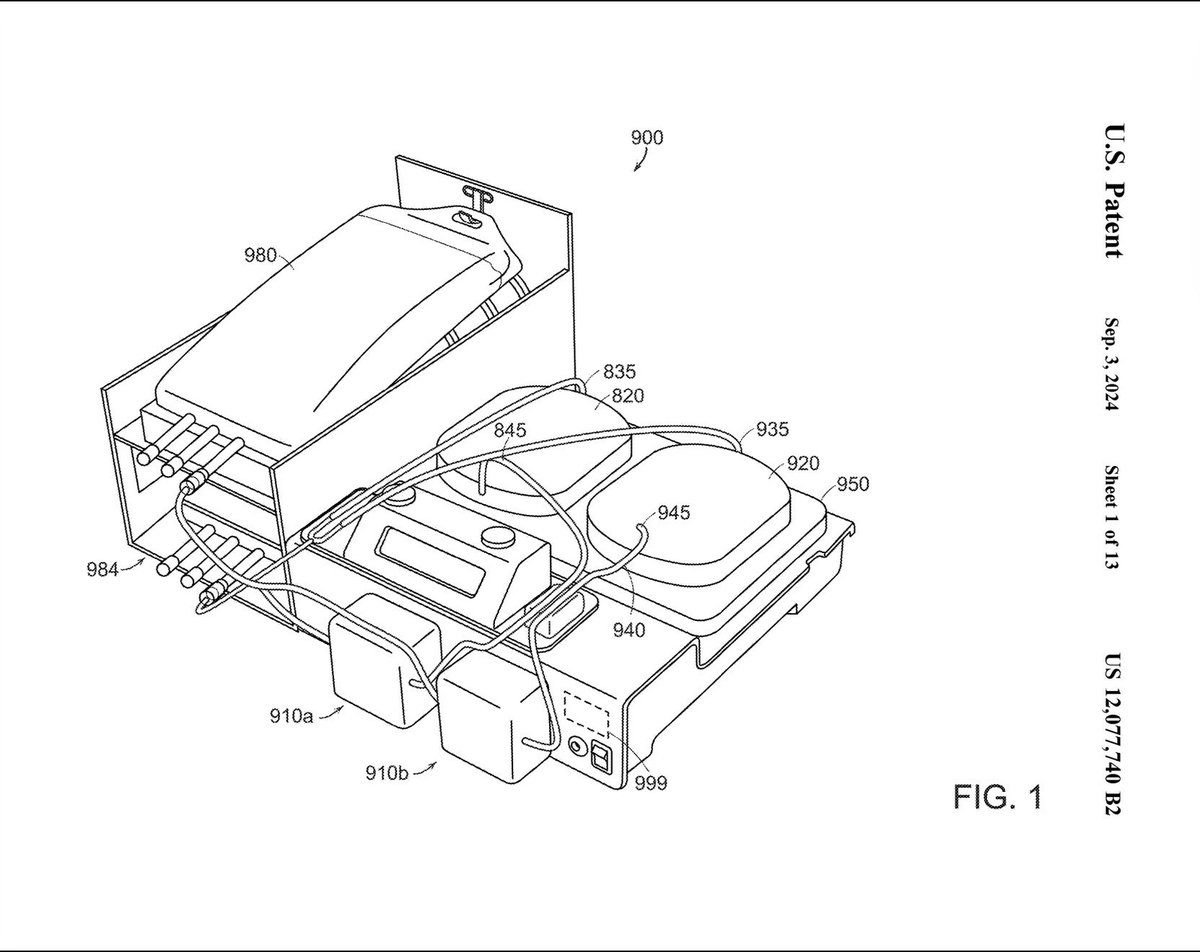
🧩 $NWBO #DCVax #Eden FIGURE 1 — Expansion Is an Architecture, Not a Container
#CellTherapy #TCellExpansion #Biomanufacturing #Immunotherapy #GMP #Microfluidics #SystemsEngineering
FIGURE 1 answers a deceptively simple question: what kind of thing is this invention?
It is not a flask.
It is not a bag.
It is not a single bioreactor with a fixed set of conditions.
FIGURE 1 shows a multi-module, fluidically connected system designed to move immune cells through distinct stages of handling and expansion. The key idea is architectural: expansion is treated as a sequence of controlled environments, not as one static culture step.
Several features stand out immediately:
• Multiple functional modules are connected by defined fluidic pathways. Cells are expected to move, not sit.
• Inputs and outputs are explicit. Fluids, cells, and signals enter and exit the system at defined points.
• Processing is staged in space and time. Different phases of immune handling occur in different places, under different conditions.
• The system is closed by design. There is no implication of manual transfers or ad-hoc intervention.
This matters because most expansion failures are not due to an inability to make cells divide. Immune cells will proliferate under almost any sufficiently strong stimulus. The problem is what happens when everything is forced to occur in one container, at one intensity, for too long.
FIGURE 1 rejects that premise outright.
By separating functions across modules, the system allows:
• different physical conditions at different stages
• changes in exposure over time
• modulation of stress, contact, and signaling as cells progress
In other words, expansion is treated as a process with phases, not as a single event.
The closed nature of the system is not just a regulatory convenience. It is a biological control. When inputs, transitions, and outputs are defined, the “history” of the cells becomes reproducible. Exposure is no longer inferred; it is engineered.
FIGURE 1 does not yet tell you how cells interact or how fast they grow. It establishes something more fundamental:
T-cell expansion is being designed as a system-level behavior.
Everything in the later figures—chamber geometry, motion, interaction patterns, growth curves, phenotype data—follows from this first decision.
This figure is the declaration that expansion will be governed by architecture, not improvisation.
Last Seen Hashtags on Sotwe
Trends for you
Most Popular Users

Elon Musk 
@elonmusk
241.7M followers

Barack Obama
@barackobama
119M followers

Cristiano Ronaldo
@cristiano
114.5M followers

Donald J. Trump
@realdonaldtrump
111.9M followers

Narendra Modi
@narendramodi
107.2M followers

Rihanna
@rihanna
98.7M followers

NASA
@nasa
92.4M followers

Justin Bieber
@justinbieber
91.8M followers

KATY PERRY
@katyperry
90M followers

Taylor Swift
@taylorswift13
84M followers

Lady Gaga
@ladygaga
75.4M followers

Virat Kohli
@imvkohli
73.4M followers

Kim Kardashian
@kimkardashian
70.9M followers

YouTube
@youtube
68.8M followers

Neymar Jr
@neymarjr
66.4M followers

Bill Gates
@billgates
65.2M followers

Selena Gomez
@selenagomez
63.1M followers

The Ellen Show
@theellenshow
62.3M followers

CNN
@cnn
61.8M followers

X
@x
60.7M followers