

Top Tweets for #cmdtyview

📈 The 2027 Nov soybean/Dec corn ratio is approaching 2.50, above the mid-Nov levels of the last two years.
That favors soybeans over corn on relative profitability, though it's well below decade-ago levels associated with record U.S. soy plantings. #cmdtyView


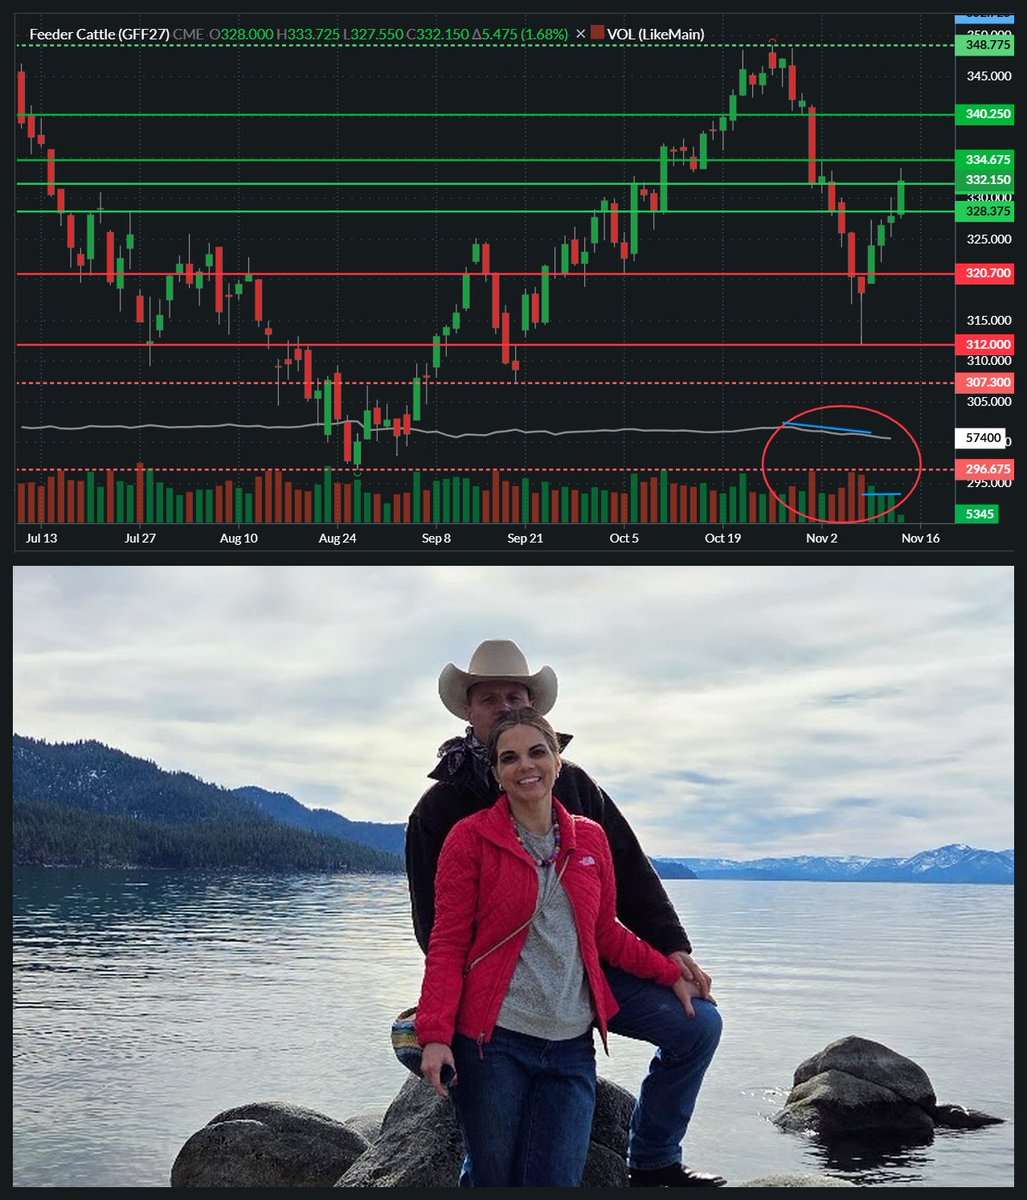
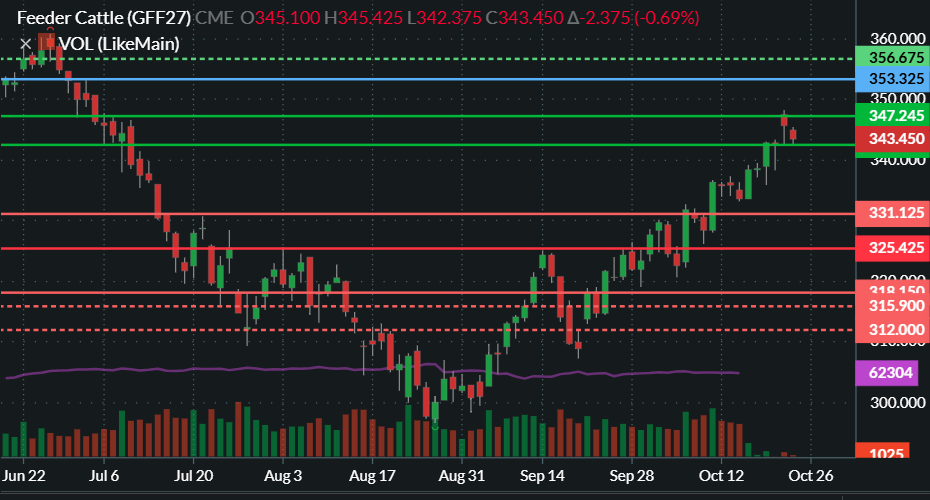
This picture of me smiling is brought to you by the current cattle rally. Declining open interest during the recent selloff keeps hope alive for another attempt at $353. Low volume the last 2 days suggests a possible profit-taking correction.
@BarchartAg @Barchart #cmdtyview

Grain Report Chart of the Day
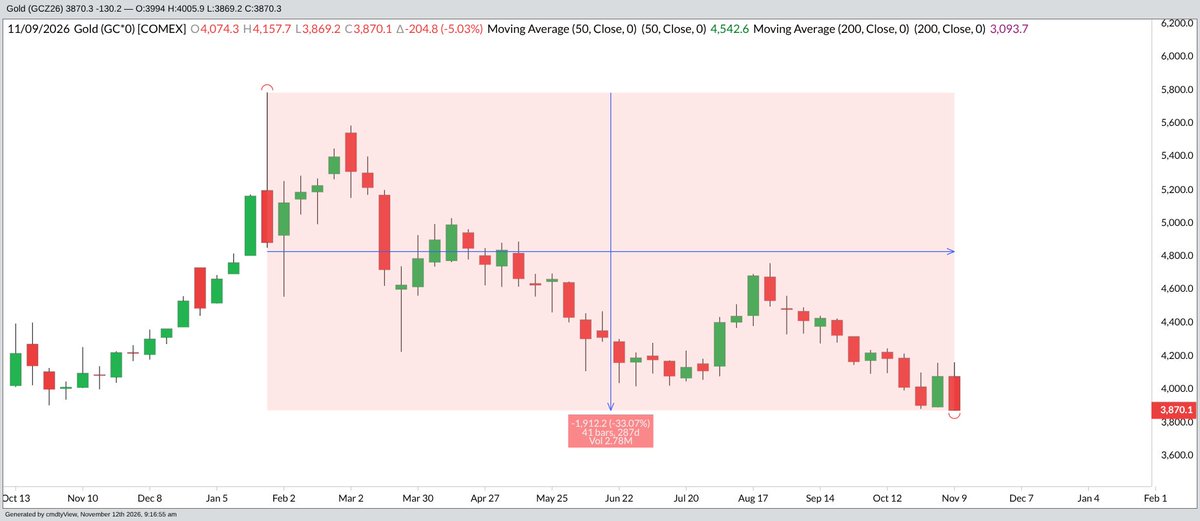
Gold
Weekly Continuous
PSA
Down 33%
9 months
Is this how a "store of wealth" behaves?
@Barchart @BarchartAg #cmdtyView

Spreads, basis, & futures. Producers take note. #cmdtyView
🔹 Funds sold 454,000 corn contracts in two months. Dec corn fell $1.07. The Dec/Mar spread tightened anyway. That is this chart.
🔹 Four higher lows since Aug 18: -16, -15 1/2, -15, -14 1/2. Somebody kept paying up for December corn the whole time the funds were selling it.
🔹 Today USDA caught up. Yield 179.6 (was 181.2). Ending stocks 1.758 bb (was 1.849). Dec corn +9 3/4c to $4.49.
🔹 Here is the part to watch. Dec/Mar closed -12 1/2. It has not closed above -12 1/4 since April 8. It stalled there on Oct 16, tested it again this morning, and backed off.
🔸 Flat price tells you what the funds think. Spreads tell you what the people who own the corn think. A close through -12 1/4 says the farmer still is not selling. A failure says he just did. First notice day is Nov 30.

🌽CBOT December corn:
✔️Hit a four-month low of $4.38/bu on Monday
✔️Has traded below the 20-day avg since late Sep
✔️Has traded below the 200-day avg since mid-Oct
✔️Has traded in technically oversold territory for 17 consecutive sessions
When will the selling end? #cmdtyView


What could surprise grain markets in tomorrow's WASDE report?
We asked Carl to break down key factors impacting corn and soybean prices. Carl even offered to set up a WASDE Workspace to track market reactions!
Learn more: https://t.co/I4ReWYW00B
#AskCarl #cmdtyView #WASDE
The WAY TOO EARLY 2027 Acres Guess: Three charts, one call. #Corn 96.0M, #Soybeans 86.8M: #cmdtyView
🔸 Chart 1: Where we start. USDA has 2026 corn at 96.8M acres, down 1.9M from 2025’s 98.8M. Soybeans are at 86.9M, the most since 2018. Corn has alternated down/up every year since 2021. Rotation alone says 2027 corn bounces, but only about +0.6M after this year’s small drop.
🔸 Chart 2: The ratio says beans. The new-crop soy/corn ratio (SX27/CZ27) is 2.43. It peaked near 2.49 on Oct 22 and is running above the 2025 and 2026 cycles at this point in the year. In the eight years the February ratio finished at 2.40 or higher, corn acres fell in seven. The last two cycles show the swing: 2025 sank to 2.24 in February and corn gained 7.9M acres; 2026 rose to 2.40 and corn gave back 1.9M.
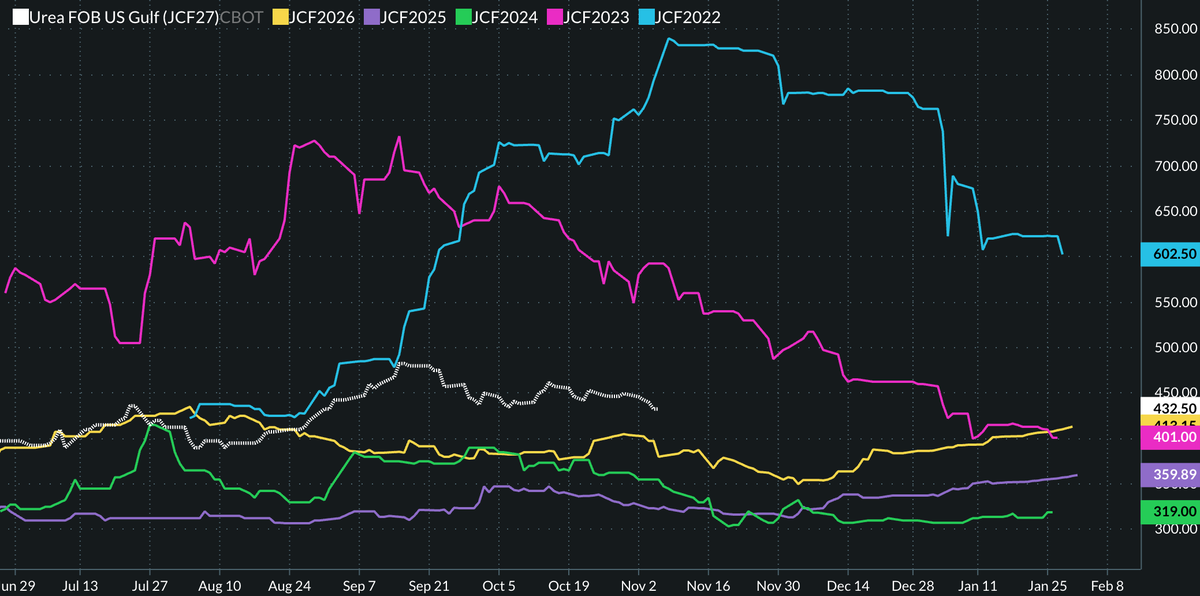
🔸 Chart 3: Nitrogen leans on corn, gently. Jan ‘27 Gulf urea is $432.50, about $30 over last year’s JCF26 and far below 2022’s $800+. Retail anhydrous is $1,007/ton, up 19% from a year ago. Elevated, not extreme. History says nitrogen moves acres only at extremes like 2022, so this is worth 0.5 to 1.0M corn acres, not more.
🔹 The call: Corn 96.0M, base case 95 to 97. Soybeans 86.8M, base case 85.8 to 87.8. Every 0.05 move in the February ratio shifts corn about 0.8 to 1.0M acres the other way.
🔹 The ratio and nitrogen outweigh rotation, so corn holds near 96M and beans hold near this year’s level. February price discovery decides the swing: 2.35 or lower opens 97.5M+ corn, 2.45+ pushes corn toward 95M and beans past 87.5M.


Grain Report Chart of the Day
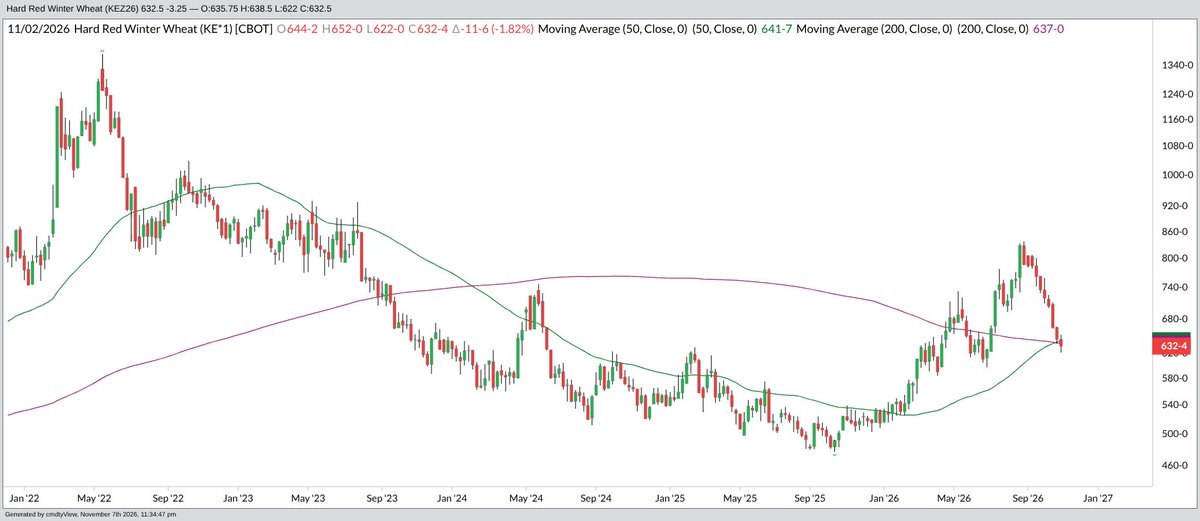
Hard Red Winter Wheat
Kansas City
BBQ Capital of the World
Golden Cross
50-period moving average crossing above the 200-period moving average
Needs buyers
Soon
@Barchart @BarchartAg #cmdtyView
Grain Report Chart of the Day
Soybeans
Weekly Nearby
Moving Average Confluence
Green 50-week MA
Purple 200-Week MA
Some other things as well
Some significant
Others less so.
A lot of eyes.
A lot of emotions.
@barchart @BarchartAg #cmdtyView

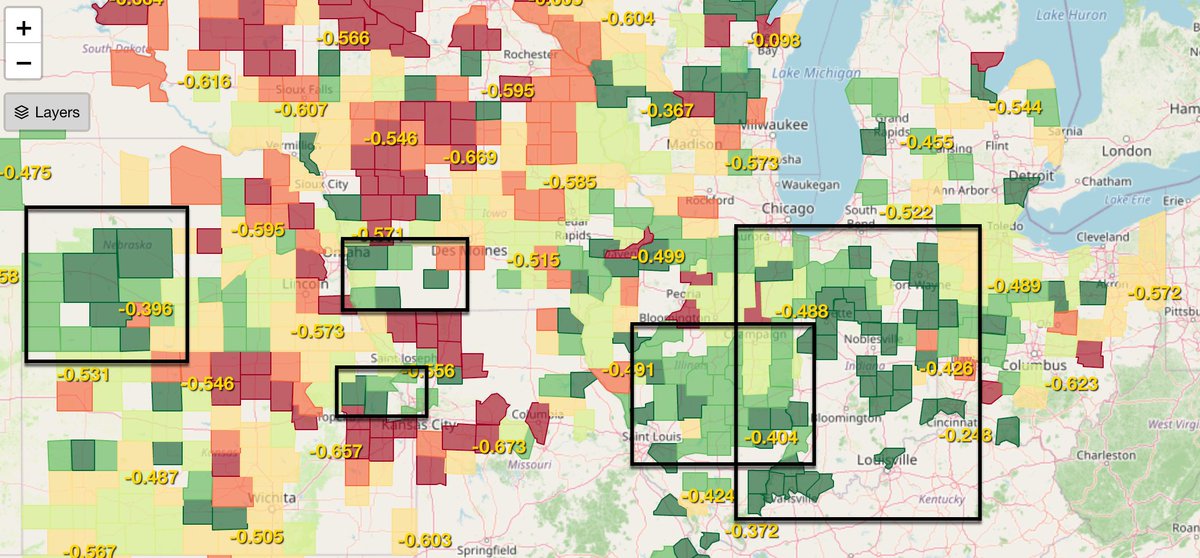
Corn Basis Starting to Tell the Truth or just Noise??? ...
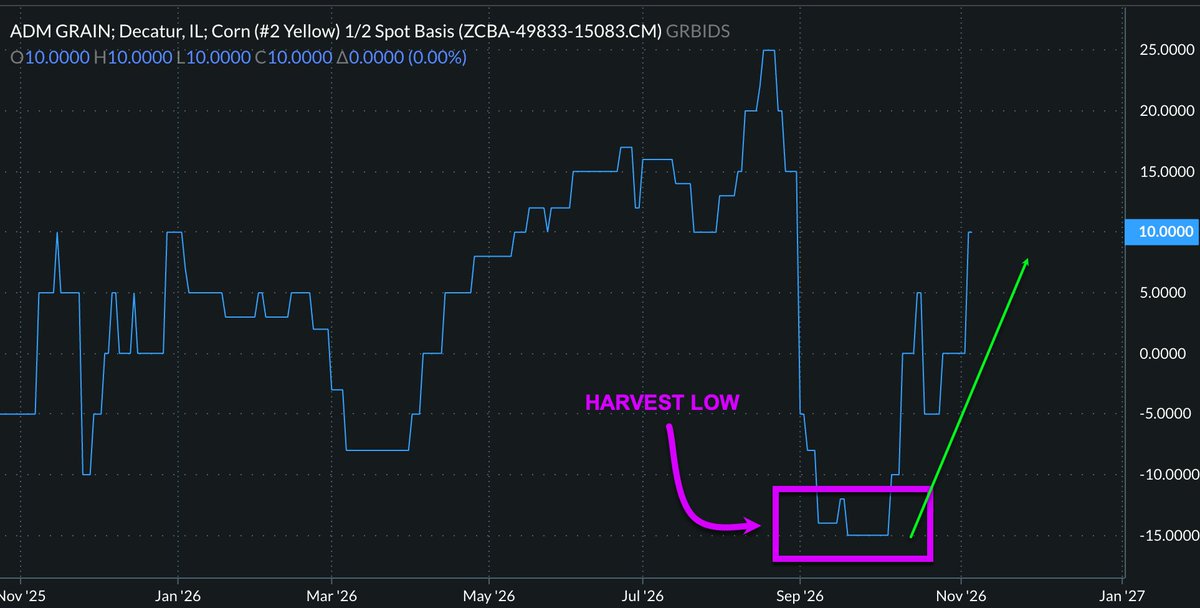
#cmdtyView County Basis Map this Week:
❇️ Central Nebraska: 40 under
❇️ Decatur IL: ADM spot basis +10 over, up 25 cents from a -15 harvest low a month ago. Last year’s crop didn’t see +10 until May.
❇️ Indiana, western Ohio: 43 to 49 under
❇️ Louisville/Cincinnati: 25 under
❇️ NW and central Iowa, SE South Dakota,
❇️ SW Minnesota, north Missouri: 55 to 67 under
Why the green is green:
🔸 Nebraska production is down 10% from last year on 188 bpa that the crop weather crowd doubts (hot, dry pollination, record warm nights, harvest only 66% done). Illinois cut to 208, and producers in north central and central IL are running 20 to 40 bpa under last year.
🔸 Indiana cut to 200 after August floodwater put ears under. Iowa printed a record 219, and southeast Iowa basis is the weakest on record for the date.
🔸 That is the cash market auditing USDA’s state yield table in real time. Where production fell, bids are climbing before harvest is even over. Where it grew, bids are sitting on the harvest low. Ethanol grind just hit a six-week high at 1.143 mil b/d, plants in NE, IL and IN are back at full rates, and farmers are not selling $4 cash.
🔸 Ohio and Kentucky are green on demand, not shortage: Ohio’s crop is up 7% and its ethanol plants are still bidding 20 cents over normal.
What it means on the farm:
🟢 Green zone (NE, central IL, IN): the basis rally you store for has already shown up. Sell cash or lock basis on bushels you’ll move by March. Want to stay long? Re-own with calls. Don’t pay to store into a 14 cent Dec/Mar carry when the local bid is already paying spring money.
🔴 Red zone (NW IA, SD, MN, N MO): you’re at the harvest low. Seasonals say roughly a dime of basis recovery is still ahead. The carry is paying you to store (a little): hedge March/May, set basis after the western harvest clears the pipeline.
🟣 Strong local basis + weak futures + a wide carry is the signature of short crops inside a big national number. Tuesday’s USDA report tells us what the elevator already knows. Watch Nebraska and Illinois. Maps and charts: cmdtyView by Barchart. County basis, elevator bids and basis history in a few clicks. If you market grain, it belongs in your toolbox, amazing tool!
#cmdtyVIEW #corn
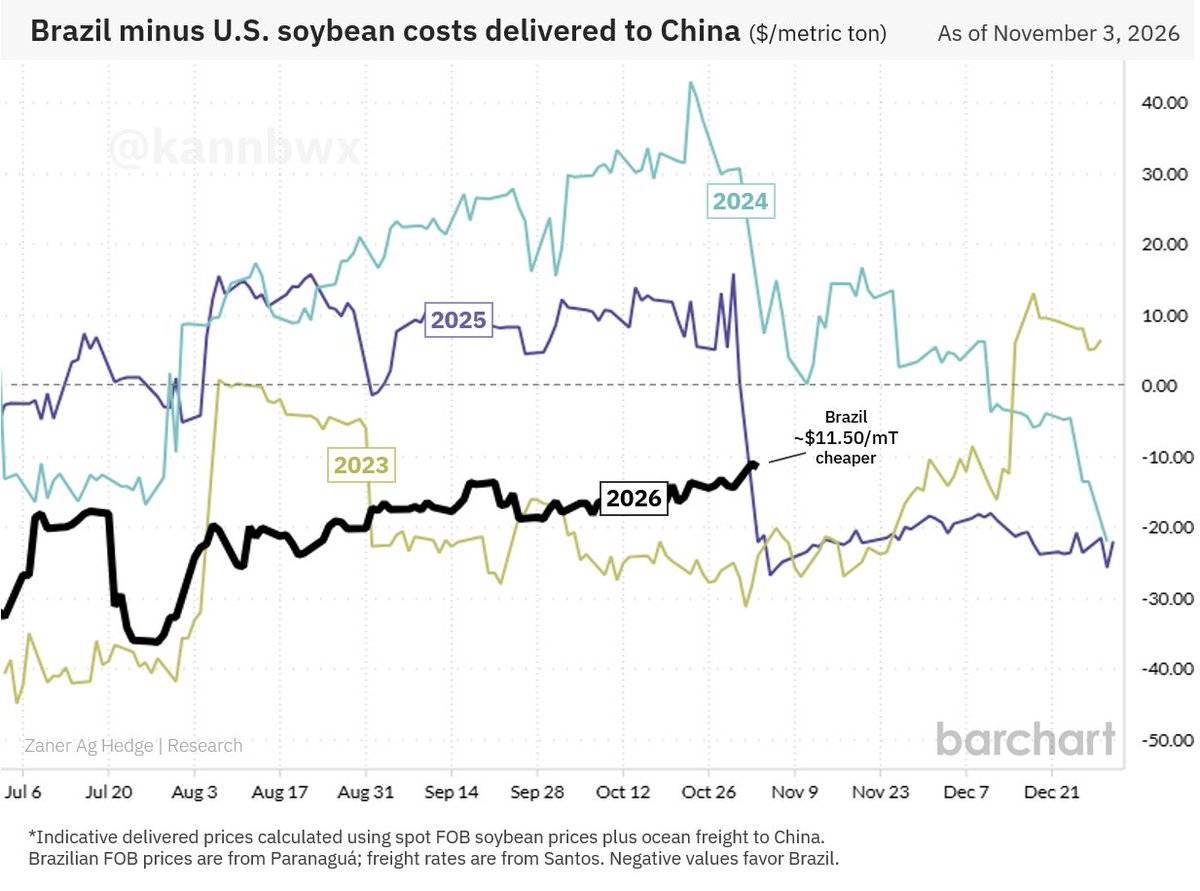
🚢High freight rates are wiping out the U.S. soybean price advantage over Brazil, even during the U.S. harvest.
U.S. Gulf soybeans are ~$0.30/bu cheaper, but shipping to China costs ~$0.60/bu MORE.
Result: Brazilian soybeans are ~$0.30/bu cheaper delivered to China. #cmdtyView
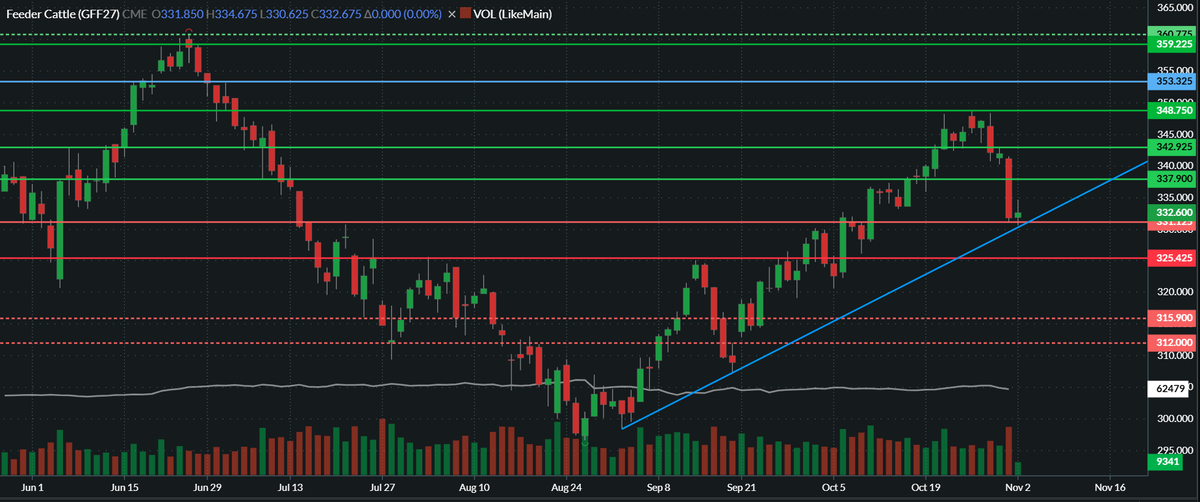
Jan feeders are testing an important uptrend line. I still expect $353+ before expiration, but $322-$328 is possible near term.
Closing below $316, $353 is less likely, retesting $312 is almost certain, $294 is probable, and $282 possible.
@BarchartAg @Barchart #cmdtyview
Carl Prompt of the Week: What's driving corn and soybean prices as harvest wraps up?
Carl breaks down export demand, South American weather, and upcoming USDA reports—and what producers should watch next.
Learn more: https://t.co/I4ReWYW00B
#AskCarl #cmdtyView

First trading day of a new month. Let’s hope Nov is easier on #corn than Oct was. Nearby finished Oct down 53c (-10.6%) for their worst monthly performance since Jun 2023
Historically, it was the 2nd-worst Oct in the data going back to 1980. Only Oct 2008 was worse
#cmdtyView

Grain Report Chart of the Day
CBOT Wheat
Weekly Nearby
Looking for support from the green 50-week Moving Average.
Critical leading into the weekend
@Barchart @BarchartAg
#cmdtyView

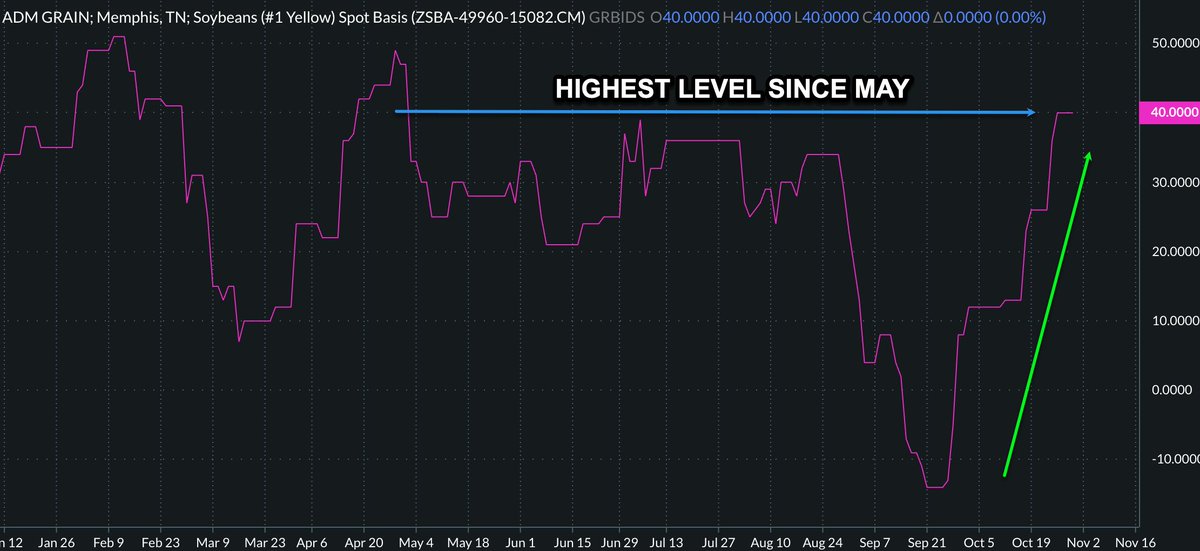
Memphis spot soybean basis (ADM): +40 over Nov. Highest since May. Five weeks ago it was 14 UNDER at the harvest low. #cmdtyView
54 cents in five weeks. Here is why.
🔹 The Delta glut is gone. Arkansas planted 3.45M acres of beans (+33%, most since 2017), USDA forecast a record 57 bu, and the crop came off early: 72% harvested Oct 4 vs 46% avg, 87% by Oct 18. All of it hit the river in September with the Memphis gauge below zero. That was the -14. Bins are closed now and the elevator has to pay to open them.
🔹 China is back and the Gulf is paying. State buyers booked 18-23 cargoes Oct 13-15 and kept buying. USDA has 15.07 MMT of China commitments on the books as of Oct 22, 60% of the 25 MMT pledge. Net sales 2.84 MMT then 2.58 MMT. Shipments 2.38 MMT, +72% vs the 4-wk avg. Total commitments 28.78 MMT, 62% of USDA’s 1,695 mb target. NOLA is paying +109 to +114 over Nov for November barges. St. Louis track went +3 to +35 in two weeks.
🔹 Freight fell while the Gulf bid rose. Cairo-Memphis barge rate 721% of tariff the week of the harvest low to 481% on Oct 27, $22.64 to $15.10 a ton, about 23 cents a bushel the terminal passes through. Corn is not competing for barges: corn barge loadings last 4 weeks 70% of last year, corn export commitments -34% y/y.
🔹 Futures did the selling, basis did the buying. Nov beans $12.80 on Oct 5 to $12.20 on Oct 29, the lowest close since August. Farmers quit selling. On Oct 26 West Tennessee terminals held cash at $12.78 while futures dropped 15 cents, so basis jumped 11-16 cents in one day. By Oct 29 they were bidding +40 to +42 over.
🔹 The interior tells the other half: national avg basis 59 under Nov, Iowa bids 70 under. Memphis sits a dollar over the national average. The export corridor is pulling. The interior is sitting on a record 4.56 bbu crop with corn harvest at 60% vs 66% avg.
🔸 This is a demand pull with cheaper freight on top, not the low-water basis collapse of 2022-23, when Helena ran 90 to 125 under. And it is happening INTO a river that just went back under zero: Memphis gauge -2.3 ft Oct 29, forecast near -5 by early November, low-water protocol and 13% tow cuts back in force since Oct 26. If freight turns back up, river basis gives some back. For Delta beans still in the bin, river basis this strong at the lowest futures since August is the one to lock and leave the board for later.
US PRODUCERS TO NOTE. #cmdtyView
Chart: Brazilian Soybean Production v USD/BRL
A lot of overnight impact on the US Ag markets following the Brazilian elections. We're fielding numerous calls from our South American & US producer clients. Here's the best why I can break it down.
What it means for Brazilian producers: 🇧🇷
Near term it is a windfall in reais; longer term it raises the cost of the next crop and the risk around Brazil's finances.
🔹 Local price up even as Chicago falls. Brazil's farm price is roughly (CBOT + port premium) x the exchange rate. At constant dollar prices, is roughly +9.4% in reais; Conab's national average was R$139.24 per 60-kg bag in the Oct 5-9 week, after the strong-real swing cut it 2%; a similar move in reverse would put it near R$149.
🔹 Expect heavier selling. With roughly 61% of the new crop and about 32.5 MMT of old crop still unpriced, farmers who held out while the real was strong now have a reason to sell and lock forward. More Brazilian offers usually means weaker Paranaguá premiums, which gives back part of the currency gain.
🔹 Inputs get dearer. Fertilizer, chemicals and much farm debt are priced in dollars. The 2026/27 crop is mostly bought, so the cost hit lands on 2027/28 input purchases and barter deals.
🔹 Area response is slow. Planting is past 30%, so this crop is set. The currency matters for 2027/28 area decisions next winter, and only if it holds.
🔹 Fiscal risk cuts both ways. If the selloff reflects deficit fears, higher Brazilian interest rates raise financing costs for farmers who are already leveraged.
What it means for US producers: 🇺🇸
A weaker real is bearish for US soybeans: it lowers the dollar price at which Brazil is willing to sell, and Brazil is the price-setter for world exports.
🔸 The window is now, not spring. US exports run heavy September through January; Brazil's harvest takes over from February. US commitments are strong (963 mil. bu, +430 mil. y/y), so old business is not the issue. The risk is new sales for Feb-Jun shipment, where Brazilian beans price is cheaper.
🔸China tilts further to Brazil. Brazil supplied nearly 80% of China's imports in the first nine months of 2026. Analysts expect Lula's pragmatic China ties to hold that share. The US pledge buying is state-led and largely booked; commercial crushers buy the cheaper origin.
🔸CBOT gets a currency premium. A record 4.56 bil. bu US crop, record US and Brazil supply, and now a weaker real all point the same way. Rallies are more likely to be sold while USD/BRL stays above about 5.30.
🔸 Marketing approach. Producers with unpriced 2026 bushels should treat CBOT bounces toward the pre-election level as sales opportunities rather than waiting on spring weather. For 2027, the El Niño setup (dry north Brazil, wet south) is the main upside risk

Incredible how quickly things can change. USDA found nearly 400 million bushels of #corn in just 10 days. Since then, Dec futures have fallen nearly 70 cents, erasing all the gains from the rally originally sparked by August’s bullish WASDE surprise.
#cmdtyView

Cash has kept feeder cattle futures rolling but they're due to correct. Jan opened at resistance and closed below it yesterday on a high volume day with increased open interest. Jan may pull back to $332-$336 before resuming its march to $353.
@BarchartAg @Barchart #cmdtyview
Grain Report Chart of the Day
CBOT SRW Wheat
Daily Nearby
Testing the 200- Day Moving Average
Several reasons point to a rally.
This is one of them.
@Barchart @BarchartAg #cmdtyView

Last Seen Hashtags on Sotwe
Most Popular Users

Elon Musk 
@elonmusk
240.9M followers

Barack Obama
@barackobama
118.8M followers

Cristiano Ronaldo
@cristiano
114.5M followers

Donald J. Trump
@realdonaldtrump
111.9M followers

Narendra Modi
@narendramodi
107M followers

Rihanna
@rihanna
98.7M followers

NASA
@nasa
92.2M followers

Justin Bieber
@justinbieber
91.8M followers

KATY PERRY
@katyperry
90M followers

Taylor Swift
@taylorswift13
84M followers

Lady Gaga
@ladygaga
75.5M followers

Virat Kohli
@imvkohli
73.4M followers

Kim Kardashian
@kimkardashian
70.8M followers

YouTube
@youtube
68.7M followers

Neymar Jr
@neymarjr
66.4M followers

Bill Gates
@billgates
65.2M followers

Selena Gomez
@selenagomez
63.1M followers

The Ellen Show
@theellenshow
62.2M followers

CNN
@cnn
61.7M followers

X
@x
60.6M followers