Top Tweets for #informationvisualization

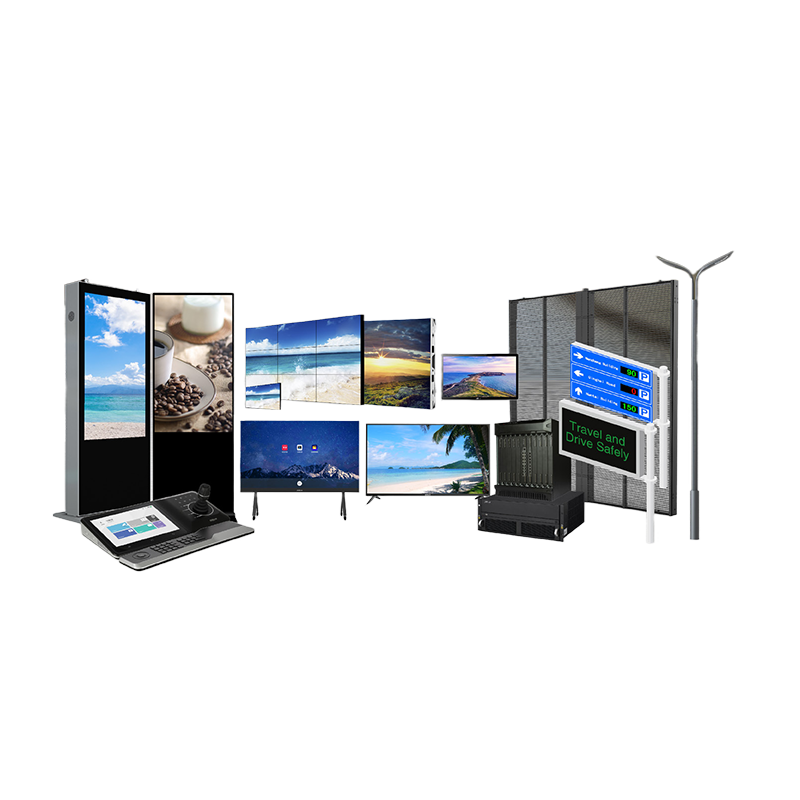
Integrated Display and Control Device
🔹 Ultra-High-Definition Large-Screen Display
🔹 Integrated Centralized Management and Control
🔹 Professionally Stable, Customizable on Demand
🌐 Learn more:https://t.co/uUK2fRPW74
#DataVisualization #InformationVisualization #Smart #IoT

At #IV2025, the keynote, Prof. Dr. Jörn Kohlhammer shares how user-centred visual analytics integrates AI for impactful decision support
📍 Don’t miss this keynote at #IV2025
#InformationVisualization #VisualAnalytics #HumanCenteredAI

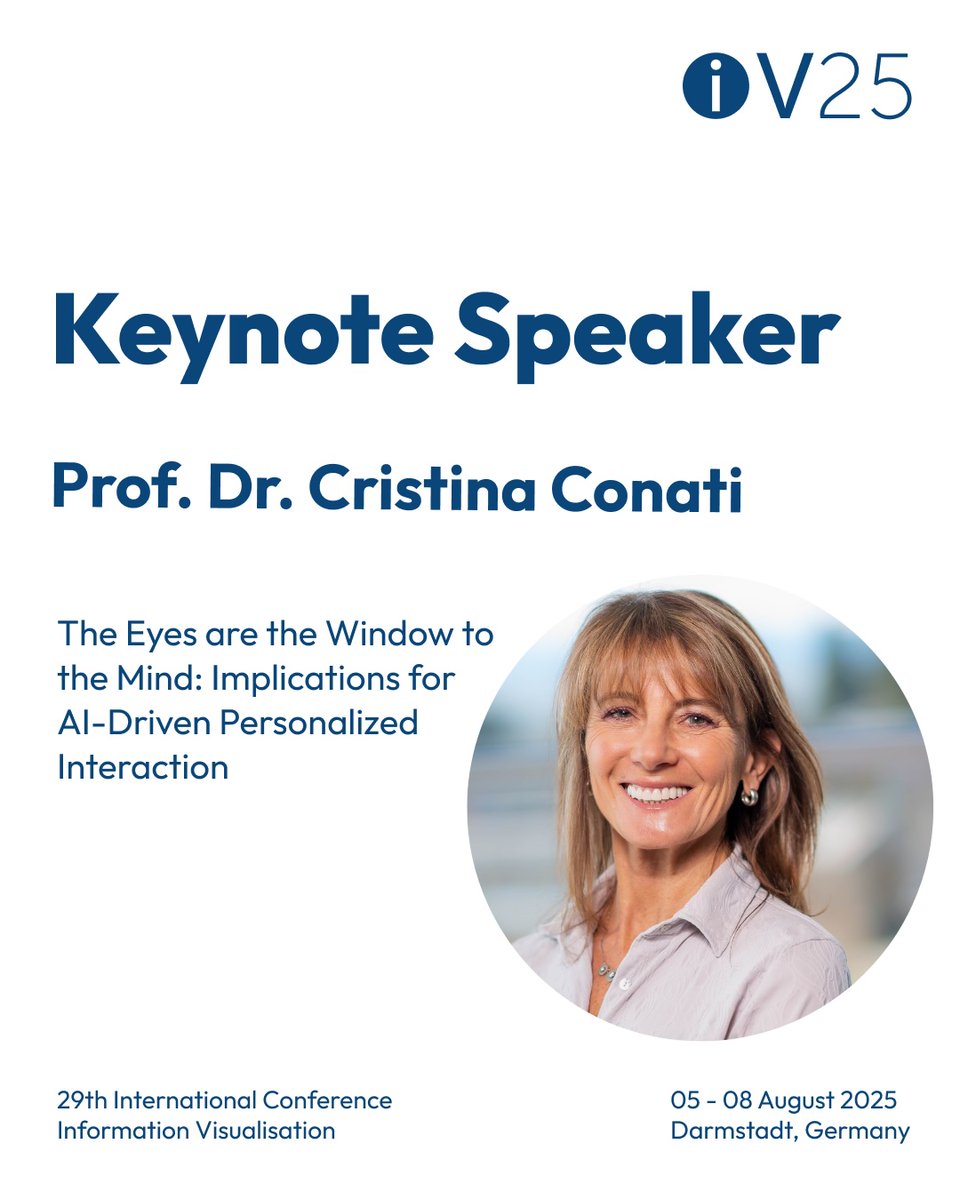
At IV2025, keynote speaker Dr. Cristina Conati (UBC) explores how eye-tracking can support human-centered AI.
Interested in attending? You can register on the conference website: https://t.co/uPUTxjcZqf
#IV2025 #InformationVisualization #HumanCenteredAI #AI
Call for Papers: MuVis 2025
Aug 5–8, 2025
Darmstadt, Germany
Explore analogies between visual and musical structures for effective #MusicVisualization.
🔗 https://t.co/ix7od8VP52
#MusicVisualization #VisualMusic #Synesthesia #DataAnalytics #InformationVisualization #IV25

Explore the synergy of #HCI & #InformationVisualization:
🔹 AI-augmented UX
🔹 Cognitive & perceptual interfaces
🔹 Visual analytics & user interaction
🔹 Adaptive, accessible systems
Focused on evaluating #InformationVisualization tools & systems:
🔹 User studies & UX research
🔹 Insight-based evaluation
🔹 Benchmarking & validation
🔹 Ethics & reproducibility

How industrial display device improves information visualization
for more:https://t.co/9U7NPgnWG9
#InformationVisualization
#IndustrialDisplays
#HumanMachineInterface
#DataVisualization
#SmartManufacturing
#IndustrialAutomation
#UserInterfaceDesign
#OperationalEfficiency


📢Meet the Teaching Assistants for E483/583: Supriya Bidanta, Sanskruti Prashant Rajankar, Venkata Naga Sreya Kolachalama, Divya Prasanth Paraman.Please join us in giving them a warm welcome! #Team #InformationVisualization #DataScience #TeachingExcellence @IULuddy @katycns
🚨 Sign up for Spring 2025: ENGR-E 583 - Information Visualization (3 CR.)! Learn to visualize abstract data for various users & tasks.🌐💻Learn more: https://t.co/IPsnyJUjz9
#IndianaUniversity #InformationVisualization #DataVisualization #Spring2025 @katycns @AndreasBueckle

"Visual Variables are basic symbols in data visualization - can they convey info like words? 🤔 Revolutionizing cartography since the 30s! #DataViz #InformationVisualization #JaquesBertin" https://t.co/MLKE75kxkf

Our new #DataMatters offering, Intermediate Effective #InformationVisualization, participants will experience how commonly available software can be used to create compelling #visualizations + learn #infoviz principles that will create impactful products.
https://t.co/jXtmNURMej

Our new #DataMatters offering, Intermediate Effective #InformationVisualization, participants will experience how commonly available software can be used to create compelling #visualizations + learn #infoviz principles that will create impactful products.
https://t.co/jXtmNURMej


Participants needed for top-ranked study on SurveyCircle:
"Evaluation of prototype for visualized privacy information on YouTube" https://t.co/VmD2FNvJaV via @SurveyCircle #georgiatech
#ProductEvaluation #OnlinePrivacy #youtube #InformationVisualization #hci


Participants needed for top-ranked study on SurveyCircle:
"Evaluation of prototype for visualized privacy information on YouTube" https://t.co/itiuOjhpG1 via @SurveyCircle #georgiatech
#ProductEvaluation #OnlinePrivacy #youtube #InformationVisualization #hci


Participants needed for online survey!
Topic: "Evaluation of prototype for visualized privacy information on YouTube" https://t.co/l5lqT85QMG via @SurveyCircle #georgiatech
#ProductEvaluation #OnlinePrivacy #youtube #InformationVisualization #hci


Marian Dörk is a research professor for #InformationVisualization & Management at the Design Department and the Institute for Urban Futures of the University of Applied Sciences Potsdam. Check out more of his work at https://t.co/XwE4pEj4HI.

🎲 Mind maps, popularized by Tony Buzan in the 1970s, are graphical tools that organize and visualize information. They date back centuries and center around a core concept with branching ideas. #MindMaps #InformationVisualization 🎲


#DataMatters instructor @EricEMonson is a #dataviz specialist with @DukeLibraries' #Data + #Visualization Services. He will be teaching the course “Intro to Effective #InformationVisualization.” @duke_data #tableau #infoviz #datascience #bigdata @DukeU
https://t.co/eEFkcZ2VvZ

Interested in learning about #dataviz? Our #DataMatters course “Intro to Effective #InformationVisualization” teaches students how to go beyond the defaults + create eye-catching, impactful figures that even beginners will feel comfortable embarking on!
https://t.co/FfxsV3x1gN

Last Seen Hashtags on Sotwe
Trends for you
Most Popular Users

Elon Musk 
@elonmusk
240.1M followers

Barack Obama
@barackobama
119.3M followers

Donald J. Trump
@realdonaldtrump
111.6M followers

Cristiano Ronaldo
@cristiano
108.8M followers

Narendra Modi
@narendramodi
106.9M followers

Rihanna
@rihanna
97.2M followers

NASA
@nasa
92.1M followers

Justin Bieber
@justinbieber
90.5M followers

KATY PERRY
@katyperry
86.7M followers

Taylor Swift
@taylorswift13
80.5M followers

Lady Gaga
@ladygaga
72.1M followers

Kim Kardashian
@kimkardashian
69.3M followers

YouTube
@youtube
68.6M followers

Virat Kohli
@imvkohli
68.4M followers

Bill Gates
@billgates
63.4M followers

The Ellen Show
@theellenshow
62.5M followers

CNN
@cnn
61.9M followers

Neymar Jr
@neymarjr
60.9M followers

X
@x
60.9M followers

CNN Breaking News
@cnnbrk
59.9M followers