Top Tweets for #mapvisualization

Why are customized pushpins helpful for Map Visualization? @msdynamicsworld
https://t.co/Wo4dUZwoqs
#Dynamics365 #CRM #MapVisualization

Want to visualize where your users are located?
👉 Check it out here ➡️ https://t.co/Ba45Y1YQpl
#WordPressPlugins #GoogleMaps #UserEngagement #MapVisualization #WPUsersOnGoogleMaps #WePlugins #InteractiveMaps #CommunityTools #WPPlugins

The Geoapify Maps API lets you design interactive and static maps that fit your UI perfectly, without infrastructure headaches.
🌍 Get started → https://t.co/6CzorHoGT0
#Geoapify #InteractiveMaps #MapVisualization #Frontend #WebMapping

Who Owns More: The Bottom 80% or the Top 0.001%?
Lees meer: https://t.co/H7DSJ6NNJx
#GeoICT #WealthInequality #GlobalEconomy #MapVisualization #DataInsights
©️ Ruben Mathisen | Source: Credit Suisse Global Wealth Report

Want a map that looks you?
Create your signature CRM mapping style with personalized themes and pushpins!
https://t.co/bbA59e7ZSC
#CRMmapping #GeoCRM #MapVisualization #d365

🗺️ Utility businesses need more than maps — they need real-time, scalable solutions.
How to choose the right tech for map-based visualization?
🔧 Tools, tips & a real case from NetLS 👇
📖 Read on our blog: https://t.co/uluGf7mKOo
#GIS #UtilityTech #IoT #MapVisualization #NetLS

The impact?
1stMile cut down on manual planning hours, improved travel speed, and brought transparency to field ops.
Bonus?
A better experience for customers as well as agents.
#FieldService #PowerPlatform #MapVisualization

Day 75: Implemented dynamic data insertion in Travel Tracker! #100DaysOfCode
Users can input country names, and the app fetches the ISO code and inserts it into the visited_countries table.
#TravelTracker #PostgreSQL #NodeJS #Express #pg #FullStackJourney #MapVisualization

Create stunning Label Animations directly in the https://t.co/ymSJdZ8gsW ...
#GEOlayersApp #MapAnimation #Maps #AfterEffects #DavinciResolve #PremierePro #VideoProduction #MapVisualization #MotionDesign #Postproduction #VideoEditing #CreativeMaps #Filmmaking #ContentCreator
Ready to visualize your data in #Dynamics365 CRM? With Heat Maps, you can customize boundaries, pie & column charts in a snap!
https://t.co/f2Mc6fmrBy
#HeatMaps #d365 #MapVisualization #Piecharts

About equality and women’s rights can perhaps only talk the countries that initially established any women’s rights. In this case the coutries mapped with color - light yellow.
#womensrights #mapvisualization #equality #equalpayday
https://t.co/KeMmEQ1fda

🚀 Visualizing geographic data? 🗺️ Join Zdenek Henek at #DevFest #Vienna on 12 Oct! He’ll transform raw map data into useful insights using open-source tools! 🌍✨
This Saturday, TU Wien, https://t.co/265Y2zrXH3
#GIS #OpenSource #MapVisualization #TechTalks


..Into the domain..of Digital Cartography...
#DigitalCartography #Geospatial
#DataVisualization #GIS
#Mapping #ExcelData #OfflineMapping #MapVisualization #LocationData
#SpatialAnalysis

🦋 Check out this fantastic demo of #MapVisualization in action!
A dynamic sales performance monitoring dashboard created using #FineVis
🦋Learn more about FineVis and customize your maps to uncover valuable insights tailored to your needs!
https://t.co/6cYqoIE4c7.
🐾 🗺️ Discover the power of #MapVisualization!
In news media and data analysis, maps are game-changers, streamlining info transmission and capturing attention instantly.🌐📊
👉Explore various map types in our latest article to harness the power of maps! https://t.co/LSOwYdgdZC

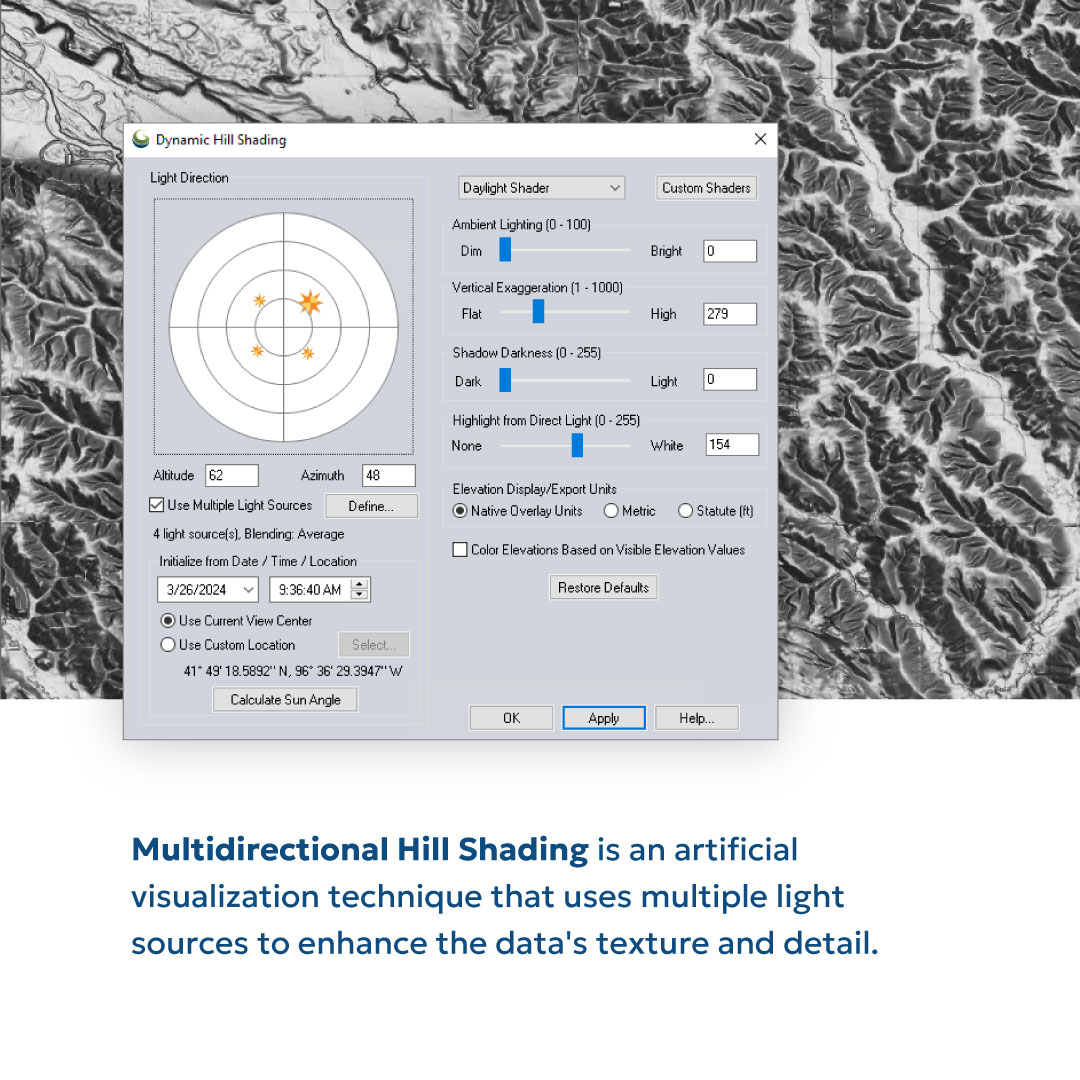
🌄 Elevate your map game with Global Mapper's dynamic hill shading tool! Learn how to create stunning visualizations in just a few steps.
-
#GlobalMapper #MapVisualization #Cartography #GIS #Geospatial #DataViz #DataVisualization
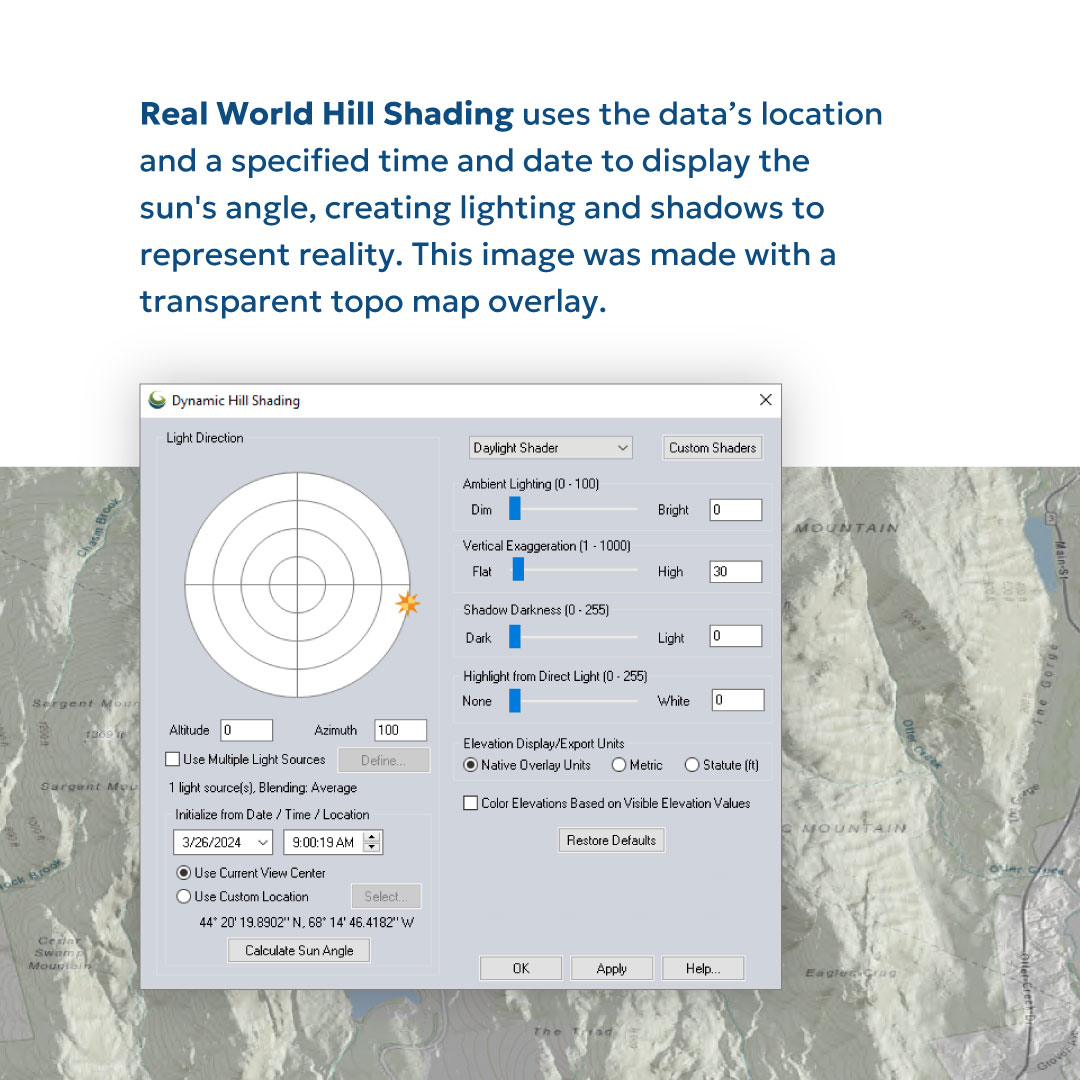
🌄 Elevate your map game with our dynamic hill shading tool! Learn how to create stunning visualizations in just a few steps.
-
#GlobalMapper #MapVisualization #Cartography #GIS #Geospatial #DataViz #DataVisualization


🌄 Elevate your map game with our dynamic hill shading tool! Learn how to create stunning visualizations in just a few steps.
-
#GlobalMapper #MapVisualization #Cartography #GIS #Geospatial #DataViz #DataVisualization


Bogor Population, di mana kabupatennya menjadi jumlah DPT 2024 terbanyak di Provinsi Jawa Barat dengan total 3.889.441.
#DataVisualization #Buitenzorg #BogorPopulation #MapVisualization
Design @junethtea
Data Source | https://t.co/cfvYJjjOTt


Engrain @engrain Raises $12 Million in Series A
#SaaS #PropertyTouring and #MapVisualization #seriesA to drive platform improvements for property mapping tech #funding
https://t.co/5iJrKCmB2w
Last Seen Hashtags on Sotwe
Most Popular Users

Elon Musk 
@elonmusk
240.2M followers

Barack Obama
@barackobama
119.3M followers

Donald J. Trump
@realdonaldtrump
111.6M followers

Cristiano Ronaldo
@cristiano
108.8M followers

Narendra Modi
@narendramodi
106.9M followers

Rihanna
@rihanna
97.2M followers

NASA
@nasa
92.1M followers

Justin Bieber
@justinbieber
90.5M followers

KATY PERRY
@katyperry
86.7M followers

Taylor Swift
@taylorswift13
80.5M followers

Lady Gaga
@ladygaga
72.1M followers

Kim Kardashian
@kimkardashian
69.3M followers

YouTube
@youtube
68.6M followers

Virat Kohli
@imvkohli
68.4M followers

Bill Gates
@billgates
63.4M followers

The Ellen Show
@theellenshow
62.5M followers

CNN
@cnn
61.9M followers

Neymar Jr
@neymarjr
61M followers

X
@x
60.9M followers

CNN Breaking News
@cnnbrk
59.9M followers