Tweet Teratas untuk #matplotlibpyplot

Data Visualization for Data Analysis and Analytics
#datavisualization #datavisualisation #dataanalysis #datanalytics #python #datavisualization #dag #matplotlib #matplotlibpyplot #microsoftpowerbi


Revising Javascript After A Long Time || hecoin45
#coding #programming #75hard #75hardchallenge #coding #challenges #matplotlib #matplotlibpyplot #seaborn #python #datascience #data #dataanalytics #datascientist #machinelearning #machine
How To Revise A Coding Language :-

Tutorial #25 . . . . . .
Set gridlines properties
#matplotlib #matplotlibpyplot #python #pythonlearning #rizwancode #pythoncode #programmings #DataAnalytics #DataVisualization #DataScientists #plot_labels #programmers #plt #line_graph #DataScience #data

Tutorial #24 . . . . . .
How to add a grid line horizontally to a graph?
#matplotlib #matplotlibpyplot #python #pythonlearning #rizwancode #pythoncode #programmings #DataAnalytics #DataVisualization #DataScientists #plot_labels #programmers #plt #line_graph #DataScience #data

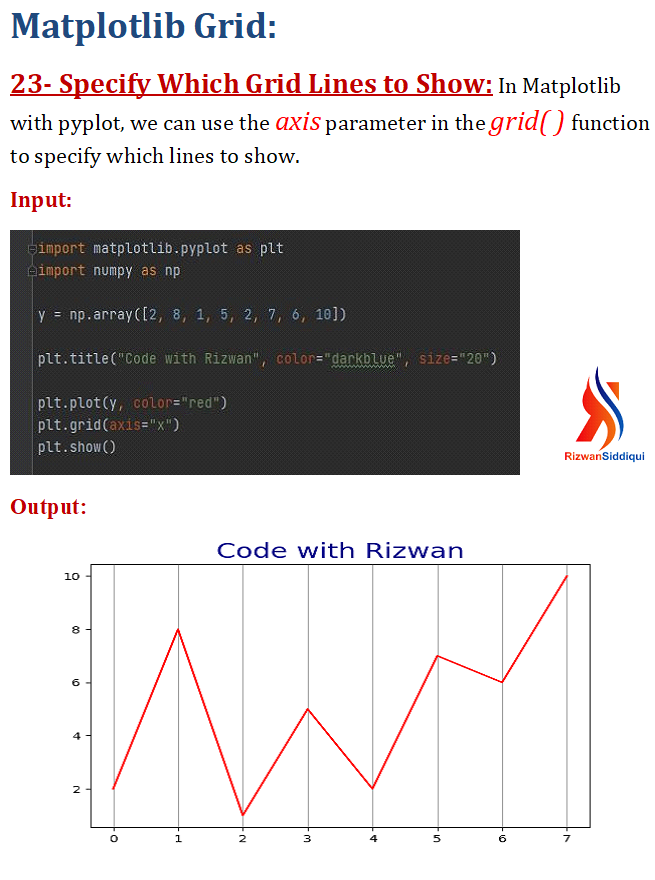
Tutorial #23 . . . . . .
How to add a grid line vertically to a graph?
#matplotlib #matplotlibpyplot #python #pythonlearning #rizwancode #pythoncode #programmings #DataAnalytics #DataVisualization #DataScientists #plot_labels #programmers #plt #line_graph #DataScience #data
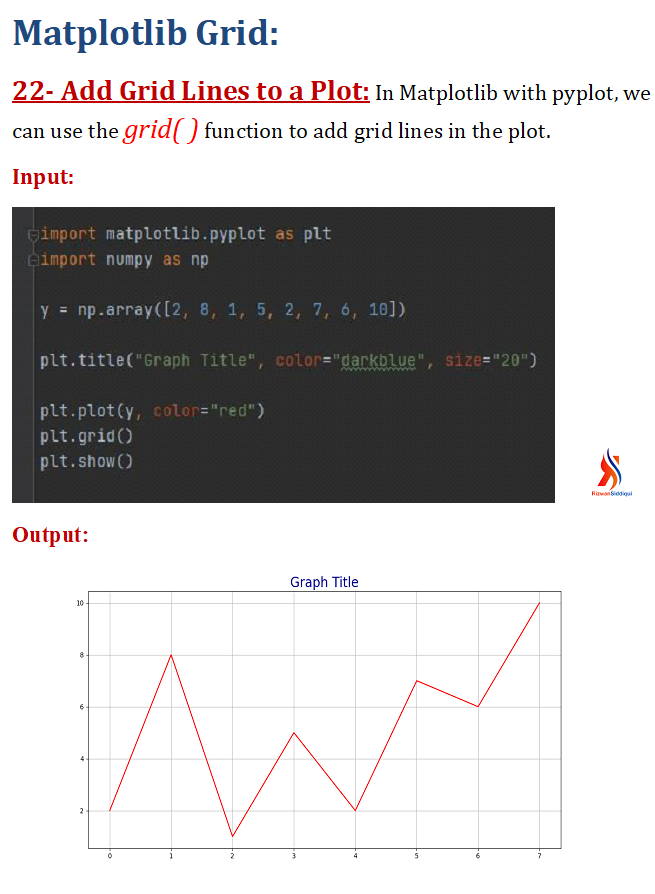
Tutorial #22 . . . . . .
How to add the gridlines in the graph?
#matplotlib #matplotlibpyplot #python #pythonlearning #python3 #rizwancode #pythoncode #programmings #DataAnalytics #DataVisualization #DataScientists #plot_labels #programmers #plt #line_graph #DataScience #data
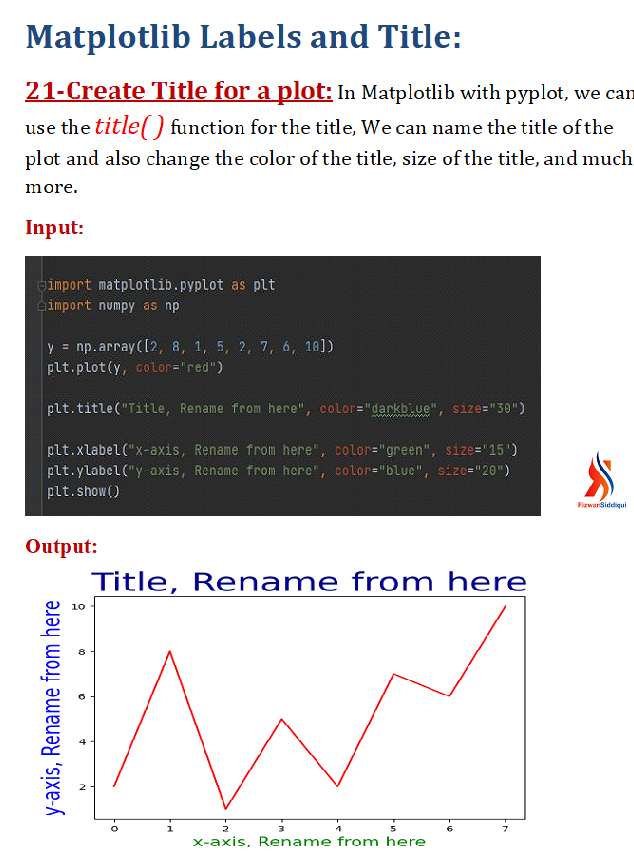
Tutorial #21 . . . . . .
How to create Title for the graphs?
#matplotlib #matplotlibpyplot #python #pythonlearning #python3 #rizwancode #pythoncode #programmings #programmer #plot #plots #graph #plot_labels #programmers #plt #line_graph #line_plot #plot_title #title #graph_title
Tutorial #14 ........ How to change the line style of a graph? #Matplotlib #Python #numpy #linestyle #matlib #python_programming #programmer #programming #coding #lines #programminglife #graphs #graphs_in_python #matplotlibpyplot #pyplot #math

Tutorial #11
How to change the marker face color in a graph.
#python #matplotlib #markerfacecolor #program #programmer #programmers #programming #programmings #programmerlife #matplotlibpyplot #DataAnalytics #DataVisualization #graph #graph_in_python #graphs_in_matplotlib

Tutorial #10
How to set the color of the line in a graph.
#python #matplotlib #marker_in_python #program #programmer #programmers #programming #programmings #programmerlife #matplotlibpyplot #DataAnalytics #DataVisualization #graph #graph_in_python #graphs_in_matplotlib


Customizing the colour of data points in scatter plot in Matplotlib Python
#matplotlib #python #pythonprojects #pythonlearning #pythonprogramming #pythons #matplotlibpyplot #aipython #coding #jupyternotebook #jupyter #scatter #plot #statistics #colors #colours #datavisualization
Learn to create a simple scatter plot in Matplotlib Python
#matplotlib #python #pythonprojects #pythonlearning #pythonprogramming #pythons #matplotlibpyplot #aipython #coding #jupyternotebook #jupyter #scatter #plot #statistics
How to display 2 or more plots on the same Graph in Matplotlib Python
#python #matplotlib #aipython #ai #datavisualization #dataanalytics #datascience #pythonlearning #pythonprogramming #plot #pyplot #matplotlibpyplot
Automatic X-axis assignment for a plot in Matplotlib Python.
#python #pythonlearning #pythonprogramming #pythonprojects #pythons #jupyternotebook #jupyter #matplotlib #matplotlibpyplot #IDE #codeeditor #plot #axis #datavisualization #datascience
@matplotlib @PythonHub
Format the line style of a plot using several line type, color and width in Matplotlib Python
#python #pythonprogramming #aipython #code #codinglife #codingforkids #codingforbeginners #matplotlibpyplot #matplotlib #pyplot #line #graph #jupyternotebook #jupyter #datavisualization
Assigning X and Y label to a plot in Matplotlib Python
#aipython #ai #python #matplotlib #matplotlibpyplot #pythonprogramming #pythons #pythonlearning #IDE #plotlabel #label #labels #datavisualization #datascience #plot

Tagar Terakhir Terlihat di Sotwe
Tren untuk Anda
Pengguna Paling Populer

Elon Musk 
@elonmusk
240.1M pengikut

Barack Obama
@barackobama
119.3M pengikut

Donald J. Trump
@realdonaldtrump
111.6M pengikut

Cristiano Ronaldo
@cristiano
108.9M pengikut

Narendra Modi
@narendramodi
107M pengikut

Rihanna
@rihanna
97.3M pengikut

NASA
@nasa
92.1M pengikut

Justin Bieber
@justinbieber
90.6M pengikut

KATY PERRY
@katyperry
86.8M pengikut

Taylor Swift
@taylorswift13
80.6M pengikut

Lady Gaga
@ladygaga
72.1M pengikut

Kim Kardashian
@kimkardashian
69.4M pengikut

YouTube
@youtube
68.6M pengikut

Virat Kohli
@imvkohli
68.5M pengikut

Bill Gates
@billgates
63.4M pengikut

The Ellen Show
@theellenshow
62.5M pengikut

CNN
@cnn
61.9M pengikut

Neymar Jr
@neymarjr
61M pengikut

X
@x
60.9M pengikut

CNN Breaking News
@cnnbrk
59.9M pengikut