

Top Tweets for #owid

If you're unfamiliar with it, "Our World in Data" is one of the best, most useful, most informative and most important sites on the Web. A great place to explore key topics, with deep analyses of the big questions and fab info visualization tools. Pioneered by @MaxCRoser. #OWID

💡 Very excited to announce new features: better interactive maps! 🗺️
– Enhanced country/region selection with several sorting options and a bar chart preview
– Selecting a country highlights it and shows its value on the map
– Zooming to your selection brings up a 3D globe view 🌍

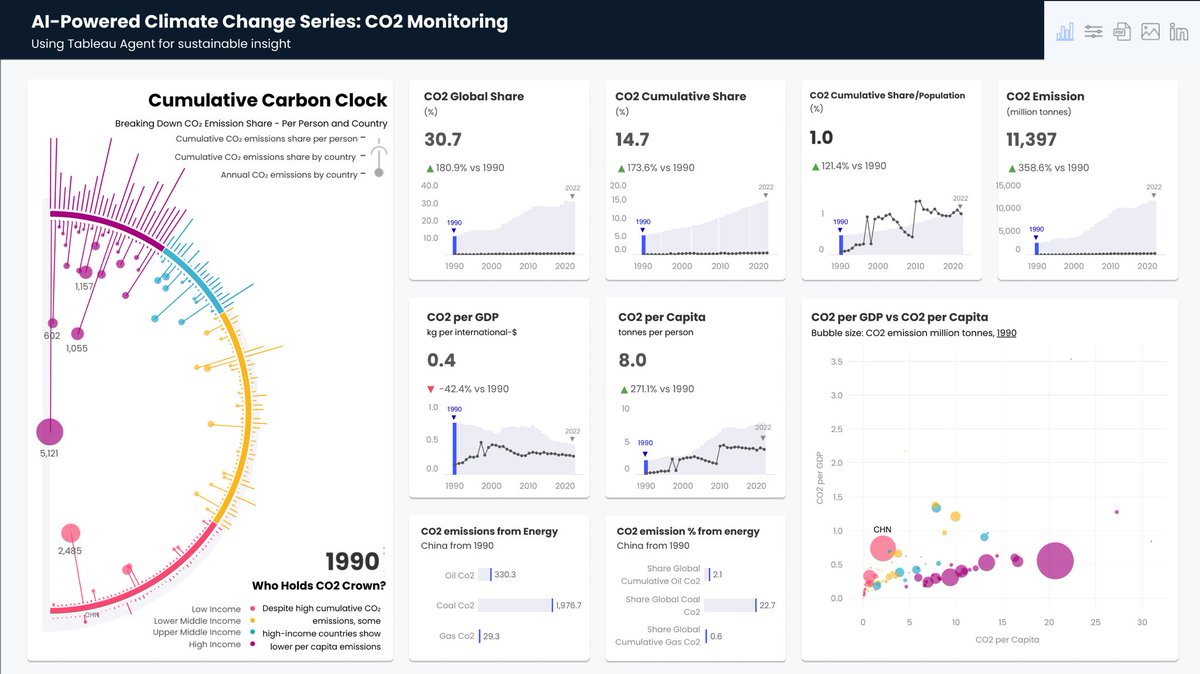
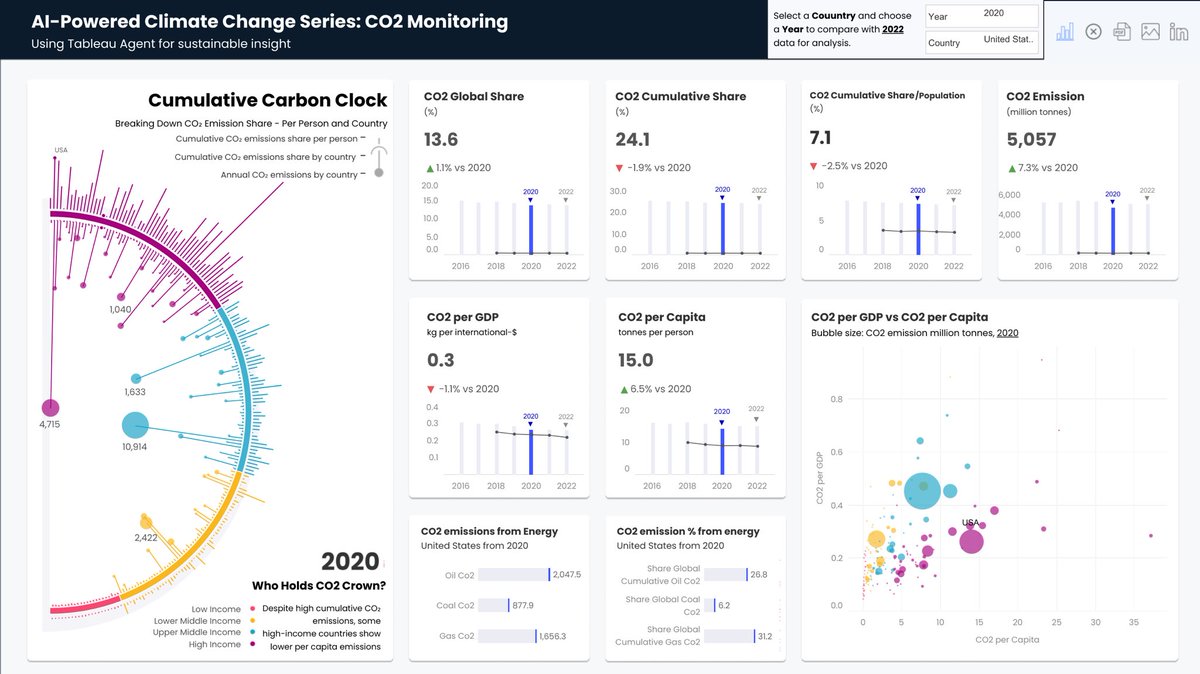
🎉@tableau Agentforce x Climate Change = Game Changer. 🌍 Cut development time, nailed storytelling.
🔥The ultimate CO₂ dashboard—global trends, per capita insights, and more.
All in one view.
#OWID ClimateData #CO2 #ClimateChange #VisualClimate
Link-https://t.co/3DjyHXpSJC
Happy Birthday to the magnificent https://t.co/CIYB8cjVq3!
My goto source of quantitative info on the state of the world, together with the trends to see where we're heading. And how we might shift that to make the #future better. Support #OWID & @MaxCRoser's work if you can.

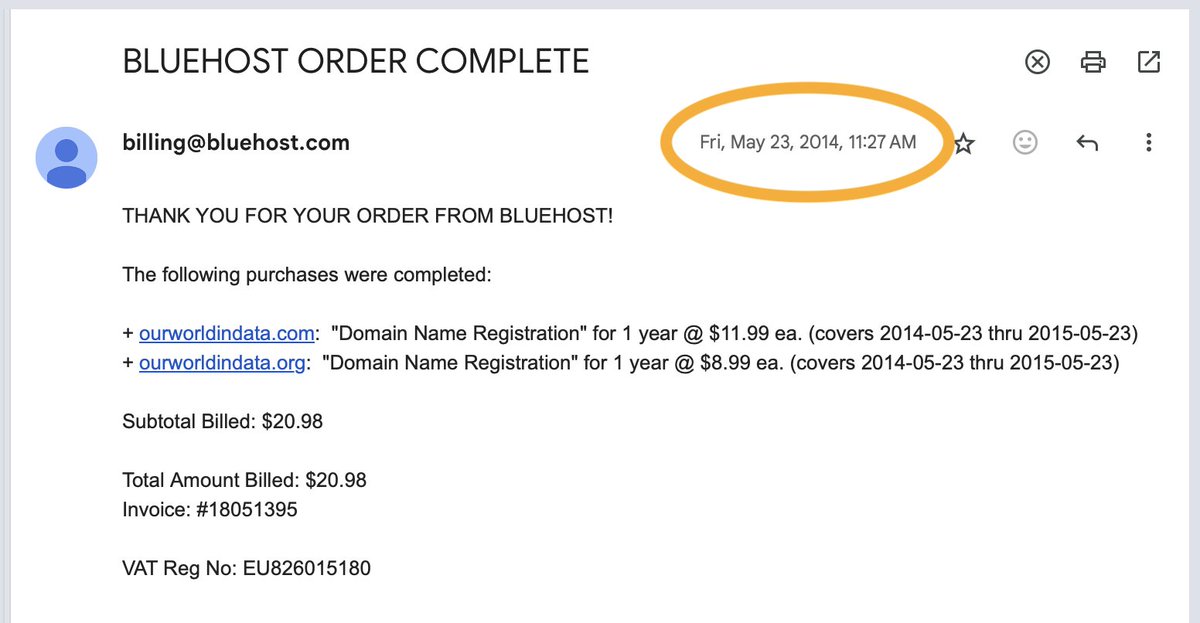
https://t.co/LwD5pTPFEy is now exactly ten years old!
Huge thanks to everyone who made these beautiful years possible. Most of all, the amazing team that joined me during the last decade to do this work!
(I had started working on it some years before 2014, but at that time, my idea was to write a book. By 2014, I had the idea to make it an open-access web publication and call it Our World in Data.)

Here is an amazing graph of the proportion of pregnancies that result in death from 1751 to 2020. From #OWID https://t.co/8rcUXhHzLH


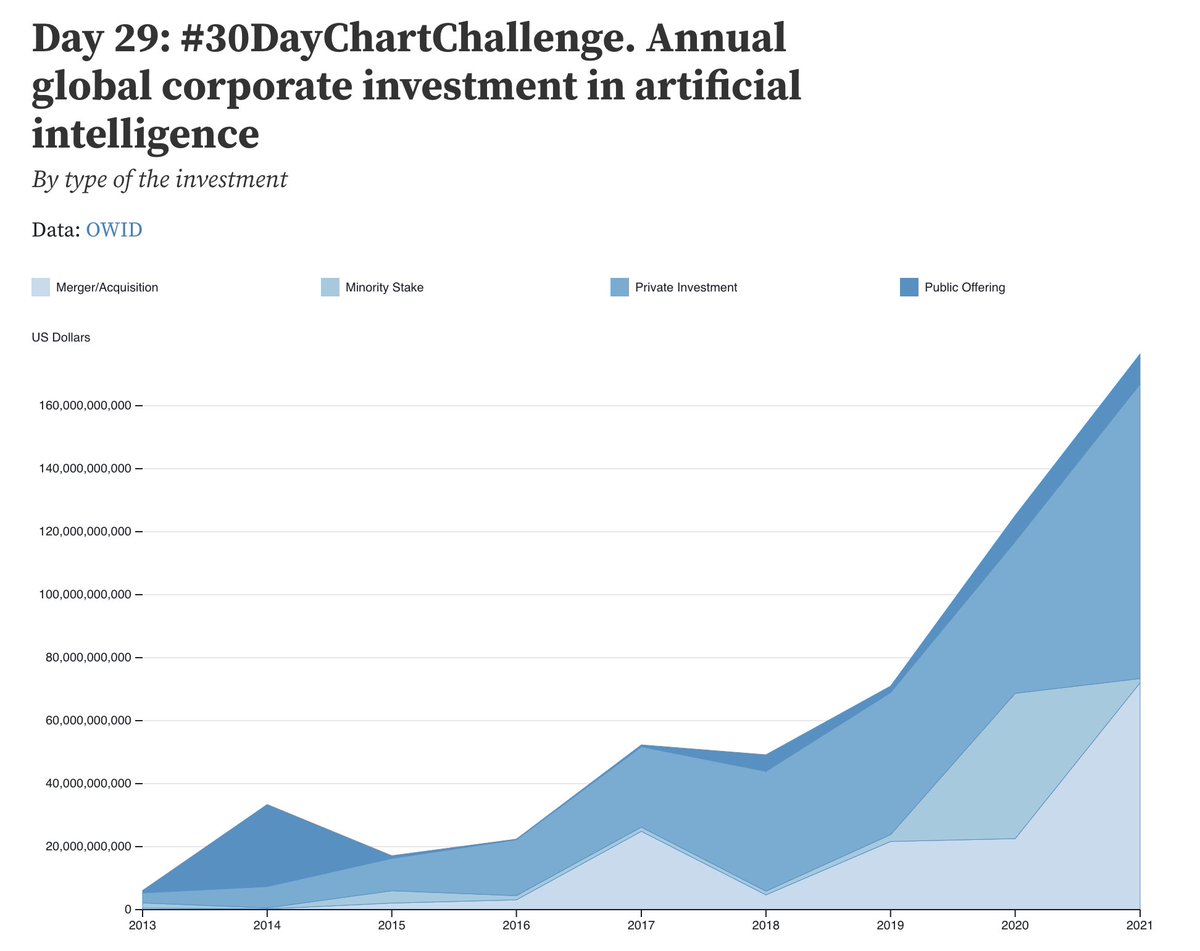
#Day29 of the #30DayChartChallenge. Monochrome area chart of annual investment in AI, by types
@observablehq notebook: https://t.co/F9JYJH0let
Data: @OurWorldInData
@30DayChartChall #data #dataviz #owid #area #ai

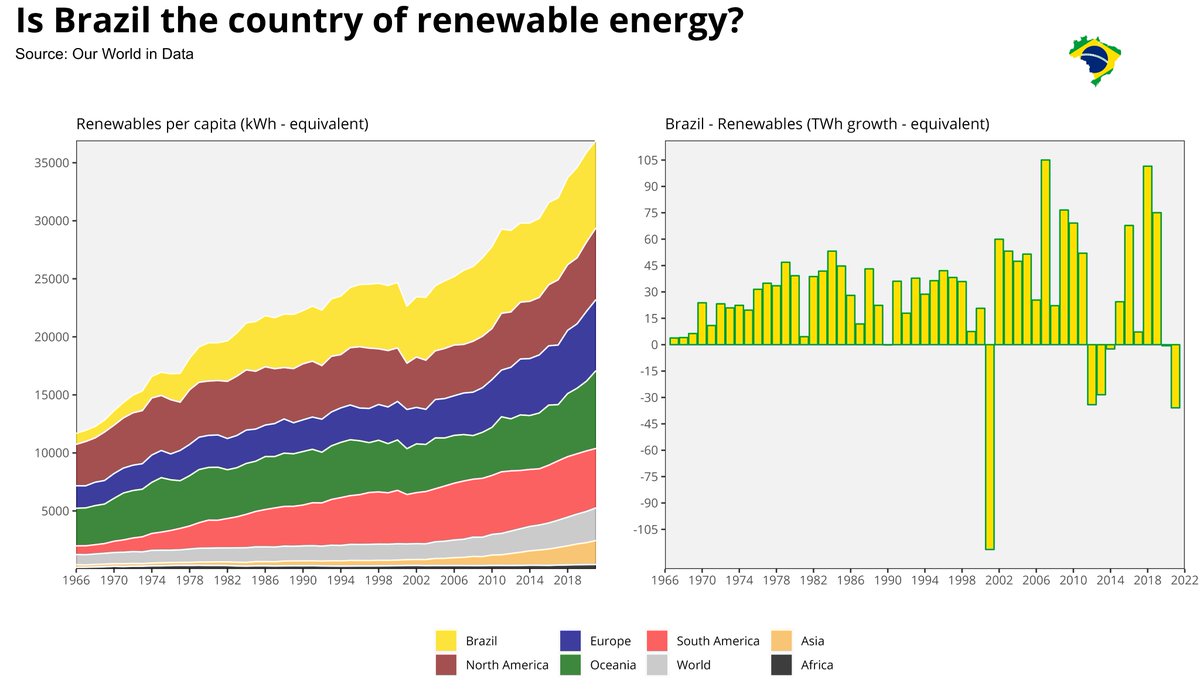
#30DayChartChallenge - day 22 - green energy
Brazil "... Blessed by God, And beautiful by nature" 🎵. But what about Brazil as a green energy country?
#rstats #dataviz #ggplot2 #OWID

📊 #Day6 of the #30DayChartChallenge:
Check out our streamgraph showing the changing landscape of AI collaboration over time based on data from @OurWorldInData. It's fascinating to see the rise of industry involvement in recent years! #dataviz #AIResearch #OWID #Collaboration


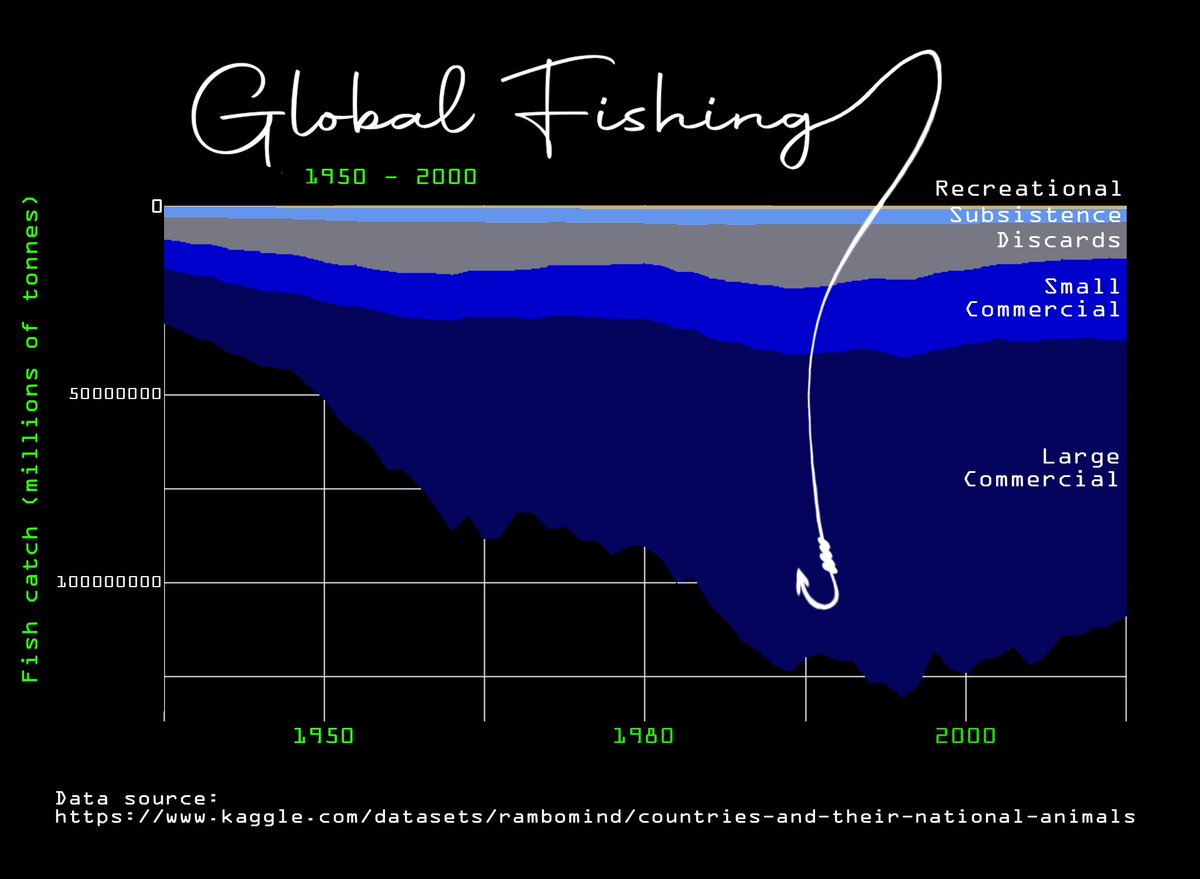
#30DayChartChallenge Day 3/6. Comparisons: fauna/flora & OWID data. Global fishing 1950 - 2000. Tools: R, Photoshop. Data source in image. #stackedareachart #owid #fishing
#dataviz

Since I was already making these figures, might as well submit them for the #30DayChartChallenge Day6: #OWID.
CO2 emissions by regions and countries. Made in #Stata using the #treemap package (https://t.co/rMA2muQvcH). One of the hardest ones to code but it's pretty solid now.


#Day6🌍 Això és un World Tile Map, una altra manera de representar mapamundis. El gràfic mostra número d'espècies de mamífers amenaçades (excepte balenes i marsopes).
👉Dades obtingudes de @OurWorldInData.
#Owid #30DayChartChallenge @30DayChartChall @e9sther




@Noahpinion Very "how long a string", but we set minimum energy requirement for a human body to about 85W, and usually calculate 100W.
Total human primary energy consumption in 2021 (#OWID/BP) is 176 PWh, almost exactly same as we get from Sun in an hour, or 1.5 EWh in 2021.
(1/2)

🚨🚨 CRYPTO NEWS ALERT! 🚨🚨
Tremors from FTX's collapse reverberate through the scientific community
https://t.co/M46AshvedU
#SecureBio #ProPublica #Biosciences #OWID #Esvelt #Kovite #Crypto #BTC #ETH #DOGE

@Noahpinion @MaxCRoser @TomChivers @OurWorldInData @_HannahRitchie @redouad @salonium This thread overlooks what #OWID musters and presents: the data source, in this case @Peters_Glen. The "source" tab of OWID graphs is one of the often ignored treasures.
https://t.co/qKLVkK8nDD

🧵
There was a bit of discussion following a @Noahpinion post on 'outsourcing' US emission to China
https://t.co/JqpmhVEkmo
I decided to update a few of our figures to show longer term trends, based on this paper https://t.co/amFairxi0P
1/


#OWID: "Daten zu Todesfällen unterschätzen Auswirkungen. Sieht man anhand von Übersterblichkeiten"
Komisch: meines Wissens wird fast nirgendwo sicher zwischen mit/an C19 gestorben unterschieden.
➡️ Eher gibt es eine Übererfassung!
Hab mich immer über OWID gewundert.
Bis jetzt

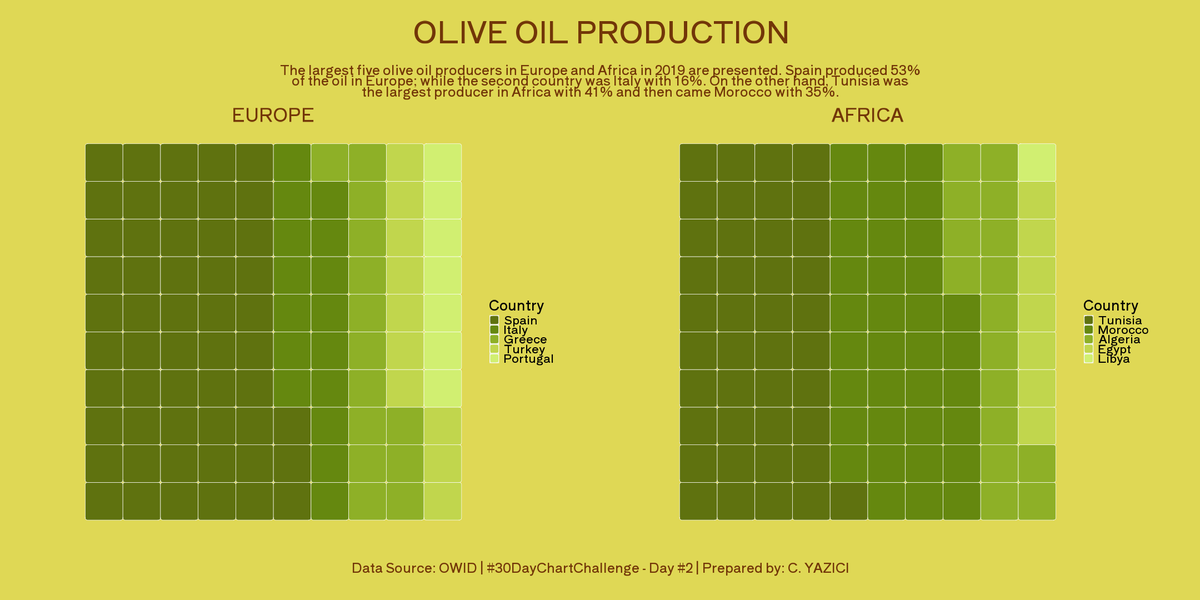
After a long break, I continue with #30DayChartChallenge #Day6 #OWID with a replication of the chart. I tried to investigate the Animal and Plant based protein intake for some Mediterrenaean countries and compared with the whole average. #DataViz #Rstats


#Day6 : #OWID
COVID-19 mortality data representation between India and other nations like US and UK.
#SARSCoV2 #30DayChartChallenge @30DayChartChall
Tool used @rawgraphs

Last Seen Hashtags on Sotwe
Most Popular Users

Elon Musk 
@elonmusk
241.5M followers

Barack Obama
@barackobama
118.8M followers

Cristiano Ronaldo
@cristiano
114.5M followers

Donald J. Trump
@realdonaldtrump
111.8M followers

Narendra Modi
@narendramodi
107.1M followers

Rihanna
@rihanna
98.7M followers

NASA
@nasa
92.3M followers

Justin Bieber
@justinbieber
91.8M followers

KATY PERRY
@katyperry
90M followers

Taylor Swift
@taylorswift13
84M followers

Lady Gaga
@ladygaga
75.5M followers

Virat Kohli
@imvkohli
73.5M followers

Kim Kardashian
@kimkardashian
70.9M followers

YouTube
@youtube
68.8M followers

Neymar Jr
@neymarjr
66.5M followers

Bill Gates
@billgates
65.3M followers

Selena Gomez
@selenagomez
63.1M followers

The Ellen Show
@theellenshow
62.2M followers

CNN
@cnn
61.7M followers

X
@x
60.7M followers