Top Tweets for #pythoncharts

Chart smarter, not harder. #LightningChartPython Trader v1.0 delivers GPU-powered, ultra-fast financial charts with 100+ indicators, drawing tools, & dashboards.
Start your free 7-day trial today!
https://t.co/crCbMhhGwC
#PythonTrading #PythonCharts #PythonForFinance


3.
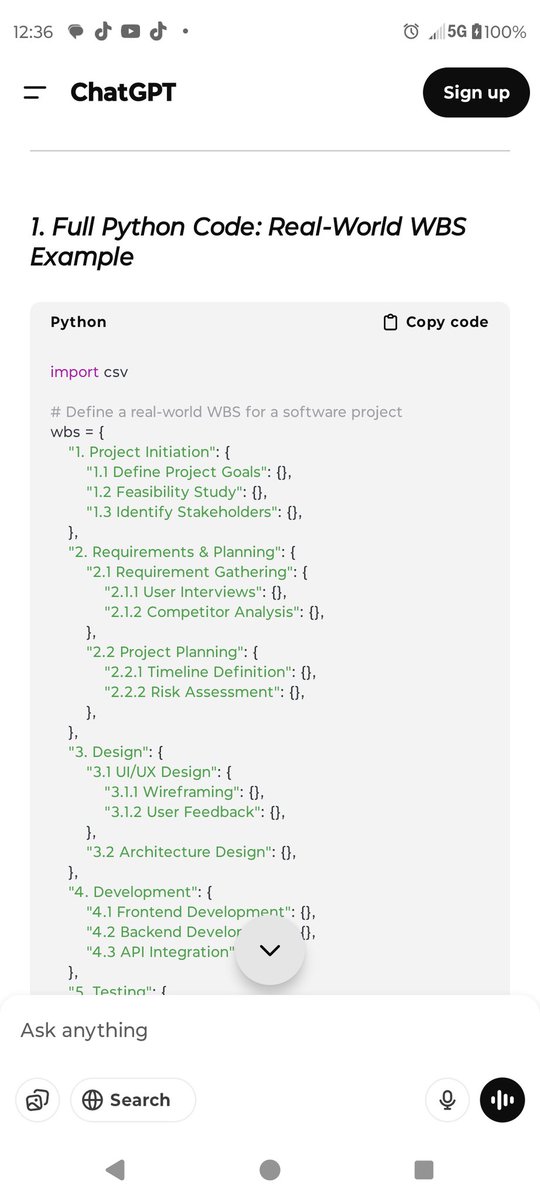
🎨 Who said coding can’t be visual?
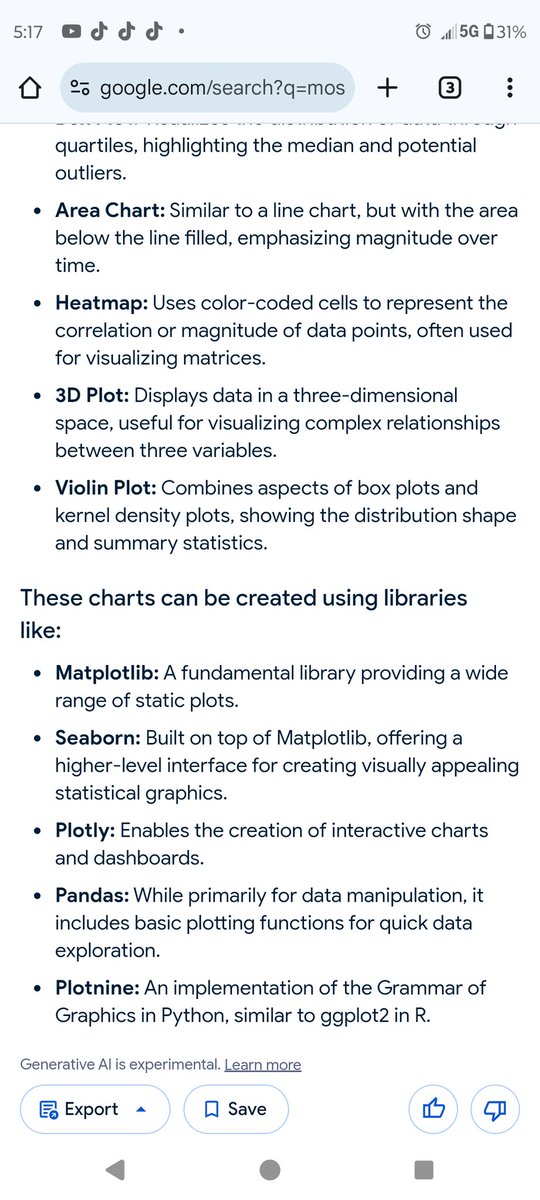
Build line plots, bar charts & heatmaps with Matplotlib to tell compelling data stories.
#DataVisualization #Matplotlib #PythonCharts #StorytellingWithData
Chart rendering slowing down in #Python?
Traditional libraries lag with thousands of points. #LightningChartPython handles millions smoothly with GPU-accelerated #WebGL rendering + real-time streaming.
🛠️Try it: https://t.co/9cRYIoNlsX
#PythonDev #DataVisualization #PythonCharts


"Visualizing data beautifully! From bar to Sankey charts, we've got it covered. 📊 Discover the power of charts to tell stories. #DataVisualization #PythonCharts #DataGraphic" #chartstudio
👉https://t.co/sUFOxhoYD2

Backlog yt: Adam Greene #pythoncharts


🤘Finished the most common python charts list in 2d and 3d on GitHub. Some have already made it to YouTube, like and subscribe 🥳
....
#devrypythonprogrammers #pythondataprocessing #pythoncharts


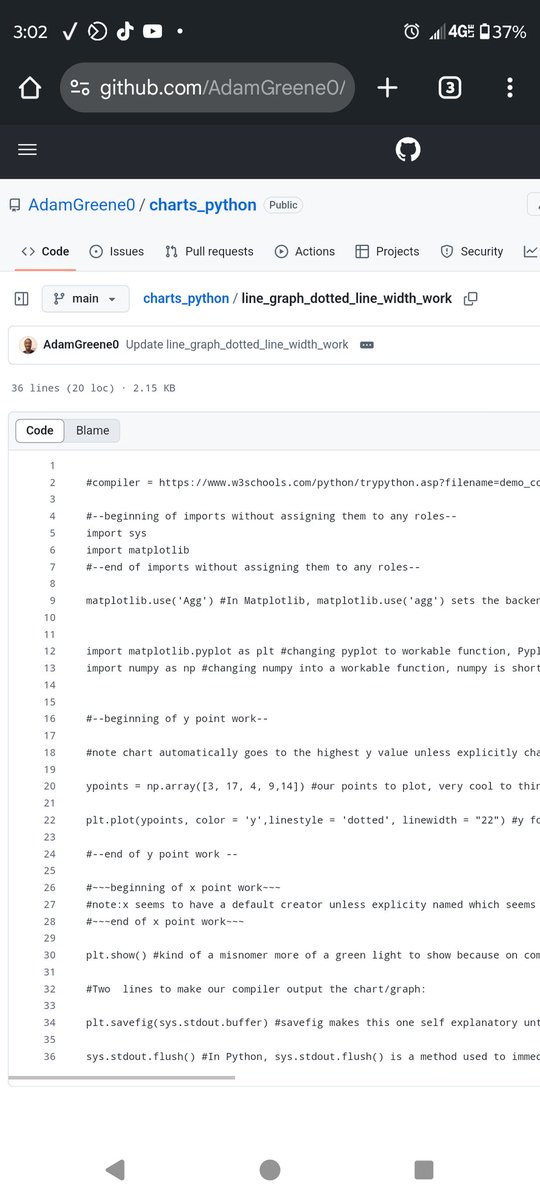

Python charts will be on my GitHub instead of Greene Aeration, it already has most of the pcep and more+ I need to impress some remote python companies 🤞🏾
https://t.co/hWyI1YkuQt
#pythoncharts #pythonstudents
Most common python charts scrum sliced and diced by Friday, cadence 5 days, product delivered to :
https://t.co/K2Oc6HcbmB
....
#devryproud #pythoncharts

Transform aviation data into insights with #Python!
Our latest post demonstrates how #LightningChartPython creates interactive flight visualizations—from route maps to passenger trends—all with exceptional performance.
📚 Full post: https://t.co/Cy4ed6GHAC
#PythonCharts
⚡ Performance breakthrough for #Python data viz!
Explore how #LightningChart handles wave energy converter data with 3D charts.
🔗 Read now: https://t.co/mBUSNnCcsh
📂 Try #LightningChartPython and explore high-performance visualizations: https://t.co/g8RD5yEU7V
#PythonCharts

4/ 📊 Visualization Magic: Python's #Matplotlib and Seaborn enable traders to create stunning visualizations of market data. Clear and intuitive graphs help in identifying patterns and trends, aiding decision-making processes. 📉📊
#DataVisualization #PythonCharts

9/ 📊 Data Visualization: Use libraries like Matplotlib or Seaborn to visualize data. Create simple bar charts, line graphs, or scatter plots with sample datasets. 📈📊 #DataViz #PythonCharts

6/ 📊 Data Visualization: Turn data into insights using libraries like Matplotlib and Seaborn. Learn to create graphs, charts, and visual representations of data patterns. #DataViz #PythonCharts
Last Seen Hashtags on Sotwe
Most Popular Users

Elon Musk 
@elonmusk
240.1M followers

Barack Obama
@barackobama
119.3M followers

Donald J. Trump
@realdonaldtrump
111.6M followers

Cristiano Ronaldo
@cristiano
108.8M followers

Narendra Modi
@narendramodi
106.9M followers

Rihanna
@rihanna
97.2M followers

NASA
@nasa
92.1M followers

Justin Bieber
@justinbieber
90.5M followers

KATY PERRY
@katyperry
86.7M followers

Taylor Swift
@taylorswift13
80.5M followers

Lady Gaga
@ladygaga
72.1M followers

Kim Kardashian
@kimkardashian
69.3M followers

YouTube
@youtube
68.6M followers

Virat Kohli
@imvkohli
68.4M followers

Bill Gates
@billgates
63.4M followers

The Ellen Show
@theellenshow
62.5M followers

CNN
@cnn
61.9M followers

Neymar Jr
@neymarjr
60.9M followers

X
@x
60.9M followers

CNN Breaking News
@cnnbrk
59.9M followers