

Top Tweets for #rtistry280

#Rgolf #codegolf #rtistry280
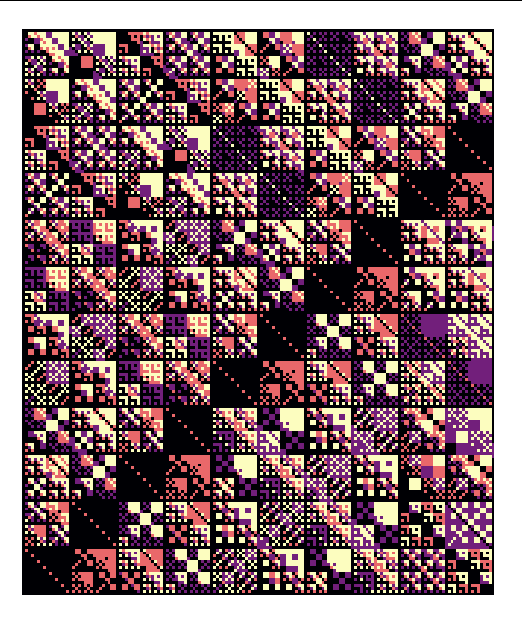
library(ggplot2)
library(magrittr)
expand.grid(x=0:1500,y=0:2000)%>%
ggplot(aes(x,y,fill= x%%4*bitwXor(x,y)%%x + x%%3*bitwAnd(x,y)%%y))+geom_raster()+theme_void()+coord_fixed()+scale_fill_viridis_c(begin=0,end=1,guide=NULL)
cc: @ClausWilke


library(ggplot2)
z=\(x,y,n)bitwAnd(bitwAnd(x,y),bitwXor(x,y)%%n)>0
expand.grid(x=0:160,y=0:192)|>
ggplot(aes(x,y,fill=z(x,y,19+(x>y)*18)+2*z(x,y,13)))+
geom_raster()+theme_void()+coord_fixed()+
scale_fill_viridis_c(option="A",guide=NULL)
#rtistry #mathart
h/t @aemkei @tobyhoward
#rtistry280 #generative #generativeart
Underlying Gaussian process
t=1000
set.seed(1)
par(mar=rep(0,4))
plot(NULL,xlim=c(20,100),ylim=c(-50,50))
for (h in 1:20){
ys=rep(NA,t)
y=0
for (i in 1:t){
y=rnorm(1,y,i**h)
ys[i]=y
}
lines(1:t,ys,lwd=h/5,col=sample(1:h))
}
![julweisgenart's tweet photo. #rtistry280 #generative #generativeart
Underlying Gaussian process
t=1000
set.seed(1)
par(mar=rep(0,4))
plot(NULL,xlim=c(20,100),ylim=c(-50,50))
for (h in 1:20){
ys=rep(NA,t)
y=0
for (i in 1:t){
y=rnorm(1,y,i**h)
ys[i]=y
}
lines(1:t,ys,lwd=h/5,col=sample(1:h))
} https://t.co/aM1ZdAFuae](https://pbs.twimg.com/media/FG6xjNvXoAYYpHJ.png)

1/2
It is #ristry280 weekend again!
Create an art piece with only 280 characters in R.
#rtistry280 #rtistry #genartclub #creativecoding #rstats
My weeks attempt... 👇

Just noticed that my tinny code contribution to the #rtistry #rtistry280 challange was mentioned in this blogpost by @ClausWilke alongisde @rtbyts @JulianJWeiss & @KennyVaden. The bar is very high now :)
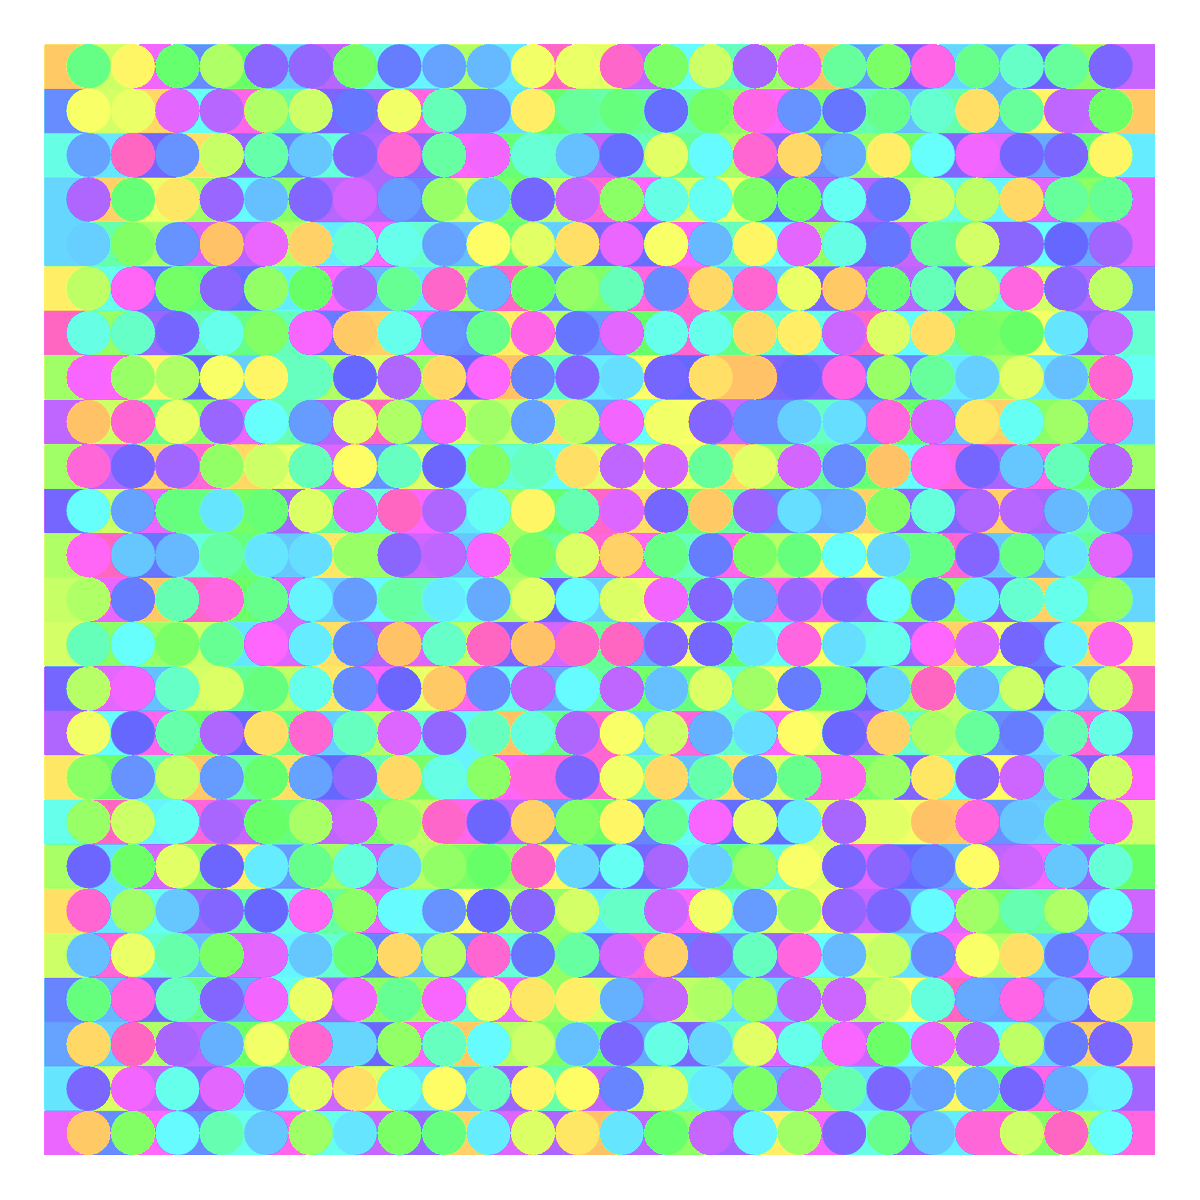
@ClausWilke @1Abstract_1 @KennyVaden b<-25
c<-rainbow(100,0.6,1,0.1,0.9)
l<-c(1,b+1)
par(mar=rep(0,4))
plot(NULL,xlim=l,ylim=l,axes=F)
for(i in seq(b)){
for(j in seq(b)){
polygon(c(i,i,i+1,i+1),c(j,j+1,j+1,j),col=sample(c,1),border=NA)
if(i>1&i<=b) points(i,j+0.5, pch=16, col=sample(c,1),cex=5)
}}
#rtistry280
@rtbyts @ClausWilke @KennyVaden here a hasty one:
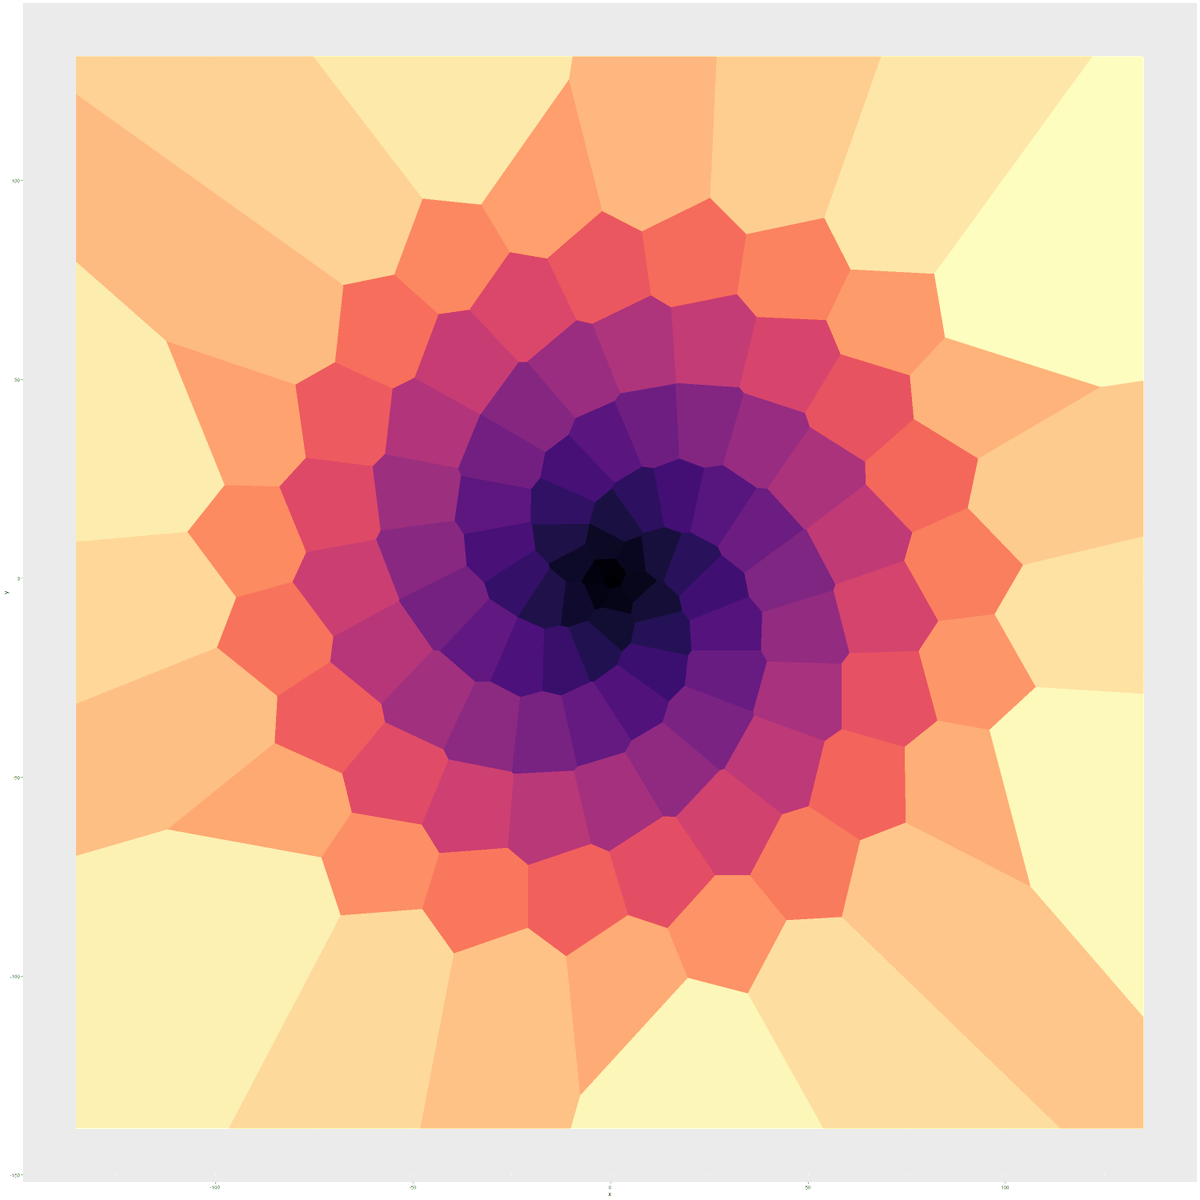
library(tidyverse);library(viridis);library(ggvoronoi);
c<-magma(121);t <- seq(0, 120, by=1)
x = t*cos(t); y = t*sin(t); p<-data.frame(x,y);
ggplot(p,aes(x,y)) + scale_fill_identity()+
geom_voronoi(aes(fill=c)) #rtistry #rtistry280
GN
@ClausWilke @KennyVaden
a <- seq(0,pi*340, length.out = 1000)
r <- seq(0,14, length.out = 1000)
par(mar=rep(0,4))
plot(NULL,xlim = c(-9,9),ylim = c(-9,9))
points(sin(a)*r, cos(a)*r, cex=r*3, pch=16,
col=scales::alpha(sample(rainbow(100)),0.1) )
#rtistry280 #genartclub

Most Popular Users

Elon Musk 
@elonmusk
241.2M followers

Barack Obama
@barackobama
119.1M followers

Cristiano Ronaldo
@cristiano
112.9M followers

Donald J. Trump
@realdonaldtrump
111.8M followers

Narendra Modi
@narendramodi
107.1M followers

Rihanna
@rihanna
98.3M followers

NASA
@nasa
92.3M followers

Justin Bieber
@justinbieber
91.5M followers

KATY PERRY
@katyperry
89M followers

Taylor Swift
@taylorswift13
82.9M followers

Lady Gaga
@ladygaga
74.4M followers

Virat Kohli
@imvkohli
71.9M followers

Kim Kardashian
@kimkardashian
70.5M followers

YouTube
@youtube
68.8M followers

Neymar Jr
@neymarjr
64.9M followers

Bill Gates
@billgates
64.6M followers

The Ellen Show
@theellenshow
62.4M followers

Selena Gomez
@selenagomez
62.1M followers

CNN
@cnn
61.8M followers

X
@x
60.8M followers