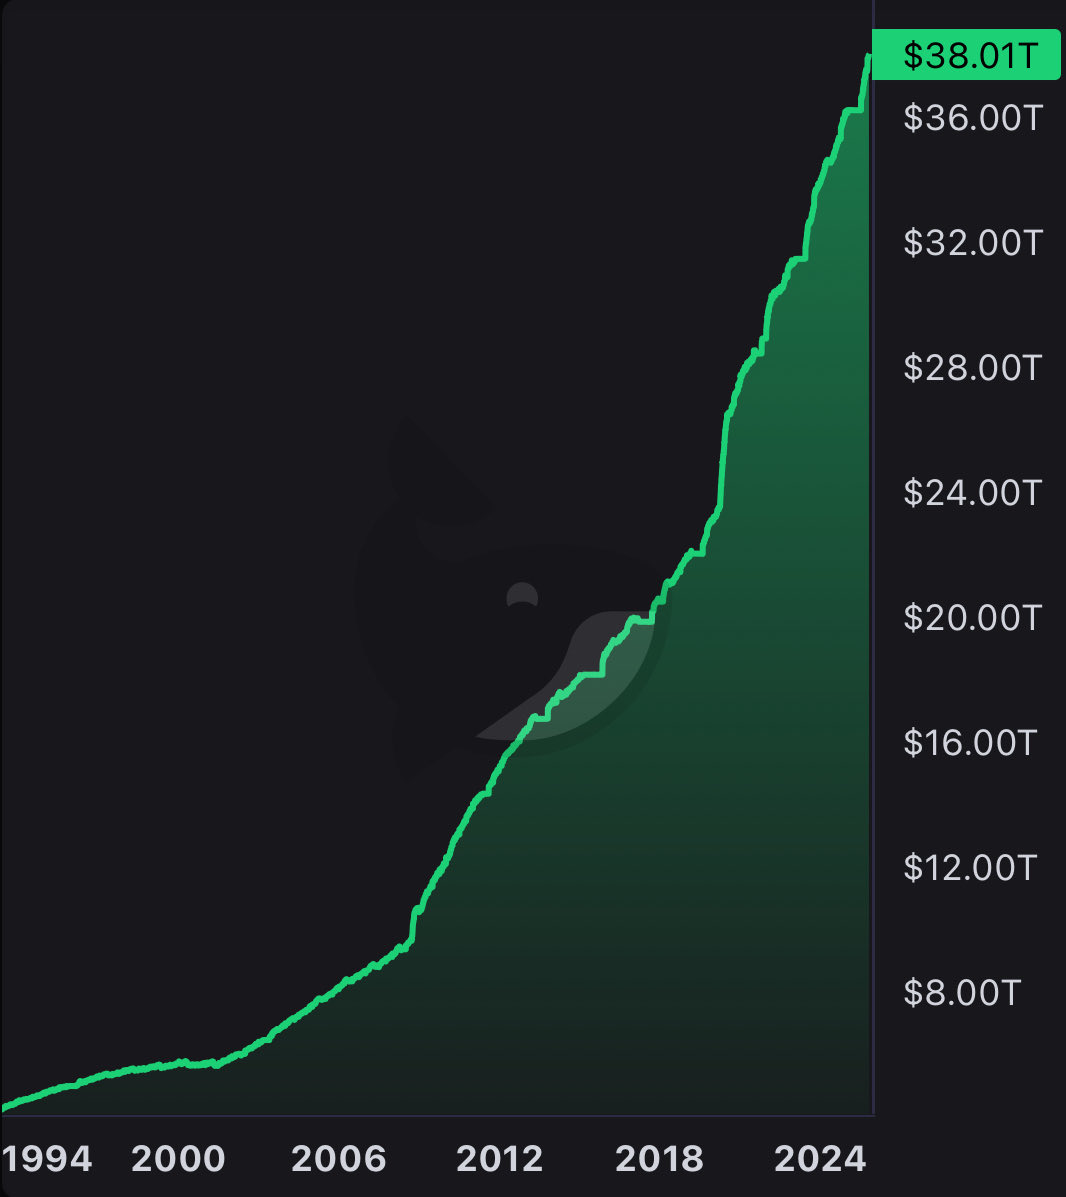
"We believe a more dovish Fed, rising PBoC liquidity, and strong Q4 seasonals are all lining up to push this market higher into year-end.
At the end of the day, it always comes back to liquidity, and we still see liquidity rising..."
I wanted to share a few thoughts on liquidity from last week’s MIT report that dropped on @RealVision. Hope it’s helpful…
Regarding liquidity, we’ve seen a small tick lower in our GMI Total Liquidity Index this month, but that’s almost entirely being driven by the rebuild of the TGA and the government shutdown, which temporarily halted the drain.
However, this too shall pass...
Remember, weak lagging employment data is what keeps the Fed engaged, or in GMI lingo, MOAR COWBELL…
Lower rates then feed through to more rate-sensitive and leading areas of the economy like housing, and this drives the business cycle higher… it’s a recursive feedback loop.
Once this shutdown ends, the liquidity taps will open again in a big way.
We’ll see TGA spend, rate cuts, the end of QT, probably a repo tweak to ease tightness, talk of eSLR relief in January, and a pivot back to an "ample reserves" regime as QT winds down.
That’s a wall of liquidity coming, and that’s just the US…
It also feels to us that the lead time of financial conditions, looking at this chart (chart 1), may have actually increased a little since the start of 2023 versus our GMI Total Liquidity Index.
I’m not going to adjust it to overfit the chart, but it’s almost a perfect fit if I adjust the lead to six months for this period.
Either way, I believe we’re going higher.
As a reminder, this is how the phasing works between financial conditions, liquidity, and the ISM (chart 2):
GMI Financial Conditions Index > GMI Total Liquidity Index > ISM
I also think the view that the liquidity cycle will peak early next year isn’t going to be right.
Feels too early for that. Let me explain…
You see, The Everything Code’s debt refinancing cycle plays out in two major phases.
Phase one is where rates need to come down first.
In China, that’s largely happened over the past two years as the economy struggled, with 10-year yields falling from around 3% at the start of 2023 to 1.6% by early this year.
I pushed back pretty hard at the time against the consensus view that this collapse in rates was bearish. Instead, I argued it was a massive easing of financial conditions coming from the East.
Now that’s happened, phase two of The Everything Code can play out.
Debts can be rolled at more sustainable levels, and with the dollar now weaker, the PBoC can deploy its balance sheet, which this month hit a record high and could reach around $8 trillion by the end of 2026 (chart 3).
That, in my view, would likely mark the peak of the liquidity cycle, with China playing a major role.
So again, this all suggests to me that liquidity is heading higher in 2026...
It’s also worth remembering that back in 2017, the Fed was hiking rates and liquidity injections were basically flat.
The real liquidity came from the PBoC and, to a lesser extent, the ECB and BoJ.
Yet despite the Fed being sidelined, Bitcoin and other risk assets ripped higher.
Raoul and I have talked about this a lot…
Everyone is too focused on the US and what the Fed is doing. What really matters is that our GMI Total Liquidity Index continues to trend higher, because that captures all of it.
Additionally, our GMI Global Excess Liquidity Composite measures how much liquidity exists in the system beyond what’s being consumed by nominal GDP.
This “excess liquidity” can be, and always is, financialized...
If you look at the chart, since the mid-1980s, equity valuations have tracked almost perfectly, roughly six months behind moves in excess liquidity (chart 4).
So this still points to further equity re-rating ahead...
What’s the bottom line?
We’re still bullish. The delay in the TGA drain and the Trump tariff scare on the 10th have been painful, but ultimately, they’re just noise.
We believe a more dovish Fed, rising PBoC liquidity, and strong Q4 seasonals are all lining up to push this market higher into year-end.
At the end of the day, it always comes back to liquidity, and we still see liquidity rising...
The issue with transactions inconsistently working on the Haven website has now been resolved.
Funds have always been safu, but I understand the frustration for people.
Apologies to anyone that has been affected!
The issue with transactions inconsistently working on the Haven website has now been resolved.
Funds have always been safu, but I understand the frustration for people.
Apologies to anyone that has been affected!
@OrangeSBS That's always been the memecoin trenches. There is no such thing as PvE in markets. You all play a -EV game and don't realize it (or do, but succumb to the dopamine from it)
THE $7.4 TRILLION DETONATOR: AMERICA’S HIDDEN LIQUIDITY BOMB ABOUT TO OBLITERATE EVERY MARKET ASSUMPTION
The most dangerous number in financial history is hiding in plain sight.
$7.4 trillion parked in money market funds. Not in stocks. Not in real estate. Not in gold. Not in Bitcoin. In idle Treasury bills earning 5%+, waiting for a single Federal Reserve decision to unleash the largest capital reallocation event in human civilization.
This isn’t cautious investing. This is a civilizational coiled spring with a central bank trigger.
THE DETONATION PHYSICS
When the Fed cuts 150-200 basis points, MMF income collapses by $100-140 billion annually. That lost yield must hunt returns somewhere.
Each 1% MMF reallocation releases $74 billion.
10% rotation unleashes $740 billion … exceeding most nations’ GDP.
20% exodus deploys $1.48 trillion into risk assets.
The flows don’t trickle. They cascade through institutional pipes like a breaking dam.
THE HISTORICAL PATTERN NOBODY REMEMBERS
1998: $1.3T MMF → Fed cuts → Tech bubble ignites
2003: $2.1T MMF → Fed cuts → Housing mania begins
2009: $3.8T MMF → Fed cuts → Everything rallies 300%+
2025: $7.4T MMF → Fed signaling cuts → Unknown territory
Double the 2009 powder keg. But now Bitcoin exists as 24/7 institutional-grade scarcity with ETF rails.
THE FOUR HORSEMEN TRIGGERS
3-month T-Bill drops below 4.0% from 4.8%
Fed confirms sequential cuts beyond one-and-done
High-yield spreads compress below 350bps
Crypto ETF inflows sustain above $2B weekly
All four converging = detonation sequence.
THE BITCOIN MATHEMATICS
MMF pile: $7.4 trillion at 5% yields
Bitcoin supply: 21 million fixed, 96% mined
BlackRock IBIT: $100B AUM in under 10 months
If 5% rotates ($370B): Bitcoin $280-350K
If 10% rotates ($740B): Bitcoin $550-700K
If 15%+ with sovereign buying: Bitcoin $1M+
Not speculation. Thermodynamics. Finite supply meets infinite liquidity in mathematical collision.
THE MECHANISM
MMFs flow through institutional architecture:
Prime brokerages rebalancing
Pension allocation triggers hitting
Corporate treasury deployments
Sovereign wealth hunting uncorrelated returns
ETFs absorbing without selling pressure
Every pipe terminates at scarcity. Only one asset is provably finite, instantly settlable, globally accessible 24/7: Bitcoin.
THE FED’S CHOICE
Keep rates high: Recession, debt spiral
Cut aggressively: $7.4T liquidity tsunami
Bond markets price 150-200bps cuts through 2026. The choice is made. The spring releases.
THE COUNTDOWN
When 3-month yields crater from 5% to 3%, capital doesn’t deliberate. It hunts yield with systemic urgency.
Gold supply: uncertain
Real estate: illiquid
Stocks: expensive
Bonds: debasing
Bitcoin: mathematically provable 21M cap with instant global settlement.
The largest dry powder pile in history aims at civilization’s scarcest asset.
The trigger is Fed policy in motion.
The timing is bond-market priced.
The outcome is thermodynamic inevitability.
When the spring releases, price discovery enters unknown physics.
Choose accordingly.
@Kyojindoteth@hylo_so This is more than volatility drag. HyUSD minting/redeeming directly affects the leverage factor. Volatility drag (or decay) happens independently of that.