Honored to receive a Gold Medal at SND for Individual: Art Direction Portfolio 🥇
Very grateful to the team at The Straits Times for always pushing, supporting, and trusting each other to try new things 🙏
https://t.co/cYFXbdOGlD
From the boom of AI 🤖, to the strategic use of sea routes 🌊 and on to changes in municipal populations🏡, visualisations are useful for illustrating complex topics. Find out more about them and a new batch of #30DayChartChallenge visualizations in our latest blog!👇
https://t.co/Vo1EE69ema
📱AI chatbots know more about you than you realise
We invented Marcus. We imagined the questions someone like him might ask a chatbot and gave those questions to Claude, ChatGPT and Gemini. All three chatbots made similar inferences.
➡️ https://t.co/QFD1k5kS3l
#ai#privacy
Stare at a spreadsheet long enough, and the numbers stop meaning anything.
A well-built graphic lands the point in seconds 📊
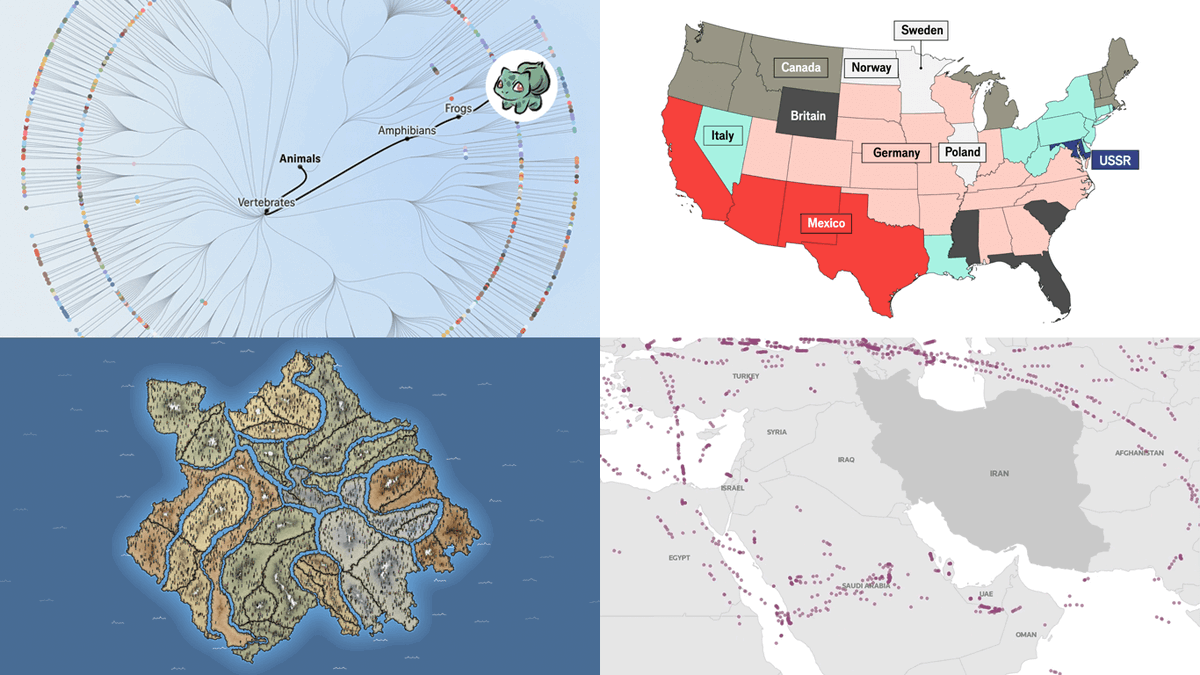
See this power in action in the latest #DataViz Weekly, with projects covering:
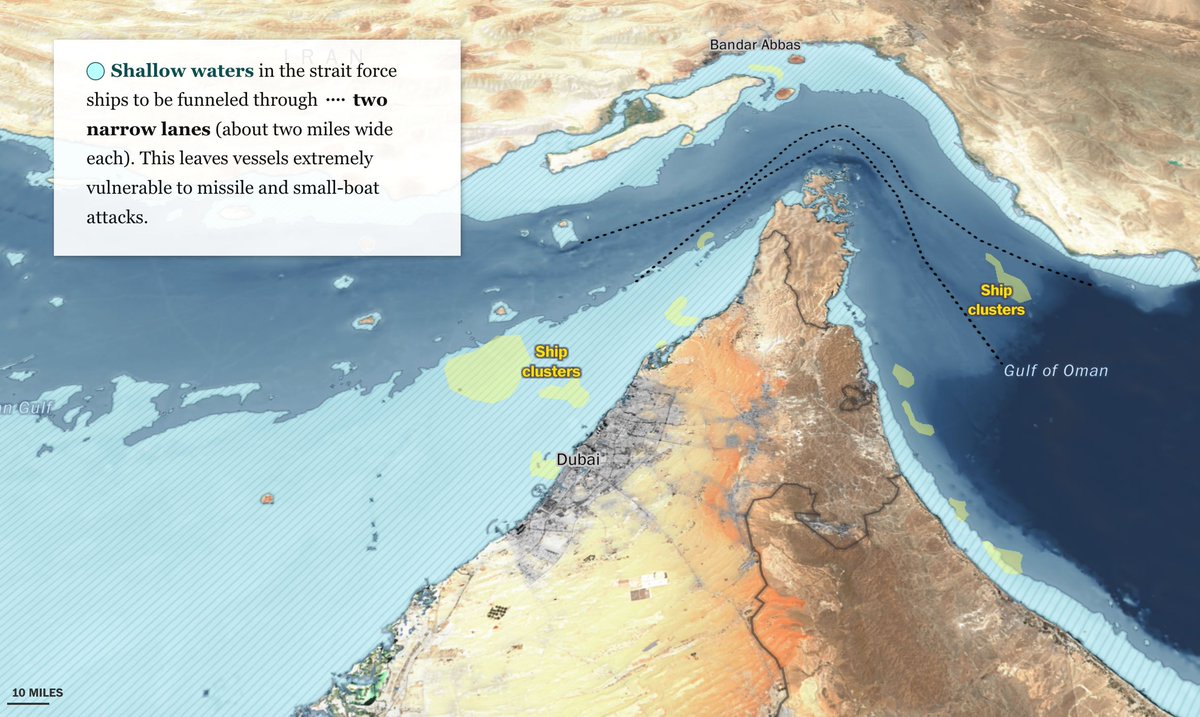
📍 Iran crisis
📍 Pokémon taxonomy
📍 U.S. immigration
📍 Human happiness
From the fourth anniversary of the war in Ukraine to recent attacks on Iran, numerous political events have been visualized in the past week. 🌍 Also in today's Dispatch: U.S. politics, biodiversity, and Pokémon. 🌿 📊
https://t.co/GDfSlMt8dw
🎮 pokemon tree of life
for pokémon's 30th anniversary, explore a visualization and field guide to 1,000+ pokémon. what inspired them, where they came from, and how they connect.
포켓몬 30주년, 1,000개 이상의 포켓몬을 시각화했습니다!
➡️ https://t.co/eWvLRsBzRe
🎮 pokemon tree of life
for pokémon's 30th anniversary, explore a visualization and field guide to 1,000+ pokémon. what inspired them, where they came from, and how they connect.
포켓몬 30주년, 1,000개 이상의 포켓몬을 시각화했습니다!
➡️ https://t.co/eWvLRsBzRe
This week's Dispatch brings a bittersweet mix of visualizations that map the course of war, explore coffee habits, and invite a little bit of Christmas spirit. 🗺️ 📊 🎄
https://t.co/YyqoNJEI0S
visualizing coffee ☕️
select your brewer, taste notes, and mood, and see your coffee transform into a visualization.
➡️ https://t.co/iSyDJLzcdZ
#threejs#dataviz
데이터 시각화 커뮤니티 ‘더보다(The VoDa)’의 열한 번째 밋업이 열립니다! 이번 밋업은 드디어 오프라인으로 진행됩니다 :) 운영진 소개와 짧은 발표, 네트워킹이 있을 예정입니다.
💡일시: 2025년 11월 20일 (목) 저녁 7시
아래의 초대장을 확인해주세요!
💡https://t.co/33DqTtTSjW
📣 데이터 시각화 커뮤니티 ‘보다(BODA)’의 열 번째 밋업이 진행될 예정입니다!
네덜란드 디자인 스튜디오 CLEVER°FRANKE의 Seowoo Nam 님과 함께 '데이터를 경험으로 바꾸는 디자인'에 대한 이야기를 나누려고 합니다
- 날짜: 2025년 9월 26일 금요일
- 참여링크: https://t.co/q77CSM0NMm
🕹️ sharing a new story: Lost Games!
We’ve digitally reimagined the traditional games of Singapore’s past, from five stones to chapteh, to help preserve them and introduce this piece of cultural heritage to a new generation.
https://t.co/1FiEYYFOZF


![helloeujin's tweet photo. [from article] AI chatbots can infer these details because the language we use is full of signals. https://t.co/XczFsTjlYw](https://pbs.twimg.com/media/HF1-qjLasAAYdog.jpg)