Friend of @datablick (FODB) @VizBizWiz is offering dashboarding workshops in Seattle, Boston, Austin, LA and SF. https://t.co/fKAFCDK7QK He’s a fantastic teacher, these are highly recommended!
Our awesome client @mainegeneral is hiring a Senior Data Analyst to work with @tableau and other tools to improve population health and help transform healthcare in Maine.FMI https://t.co/JkofQLF8po #dataviz#jobs
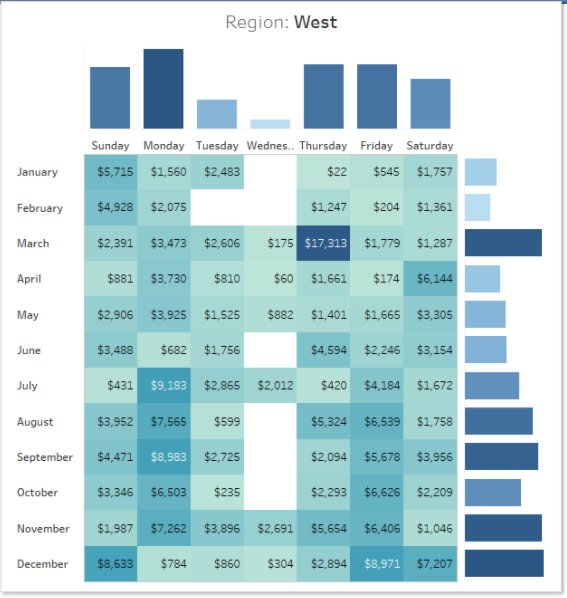
Lee Feinberg @DecisionViz is doing a survey on why and how often people use text tables in @Tableau and will share the results, so submit yours! https://t.co/KVXAF3Cdgl
@Rumszz Would you want each day to take the same amount of horizontal space as each month? Or are you looking to have the axis legend show smaller and smaller units?
Marginal histograms and strip plots are a great way to provide context for scatterplots. In this post @RodyZakovich bumps them up a notch with a density scatterplot. https://t.co/SO8lHwnWHR
A dose of LODs is the cure for intra-question analysis in these two posts by @VizBizWiz (with a little assist from our @jonathandrummey ) https://t.co/QniSTyqkMm https://t.co/yhoNsXo5oN
@mridul85@tableau See this for more details on the background of Hyper https://t.co/7Unsf9s8AX, if you’re asking about what language is used in the source code you’ll have to talk with the Tableau developers.