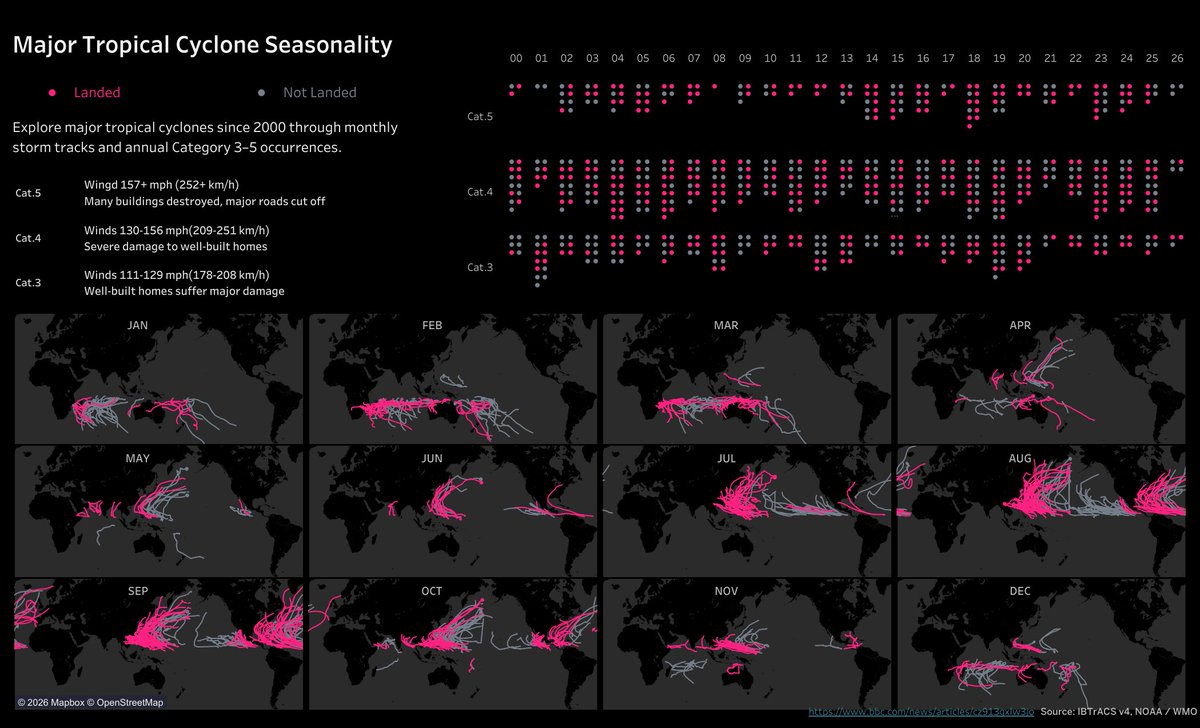
In this #VizOfTheDay by @hiroki_riptide analyzes the seasonal patterns and regional frequency of major tropical cyclones around the world.
The dashboard visualizes monthly cyclone distributions across global ocean basins to highlight when and where major storm activity peaks. Inspired by @jito60261993.
Explore this #MakeoverMonday entry on Tableau Public: https://t.co/YnXxgrvPdp
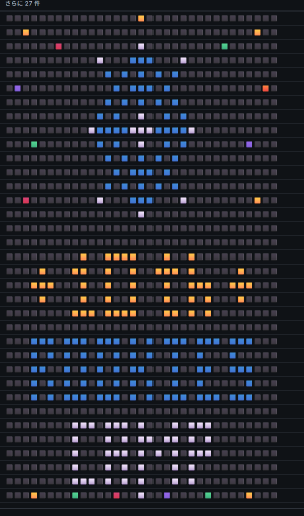
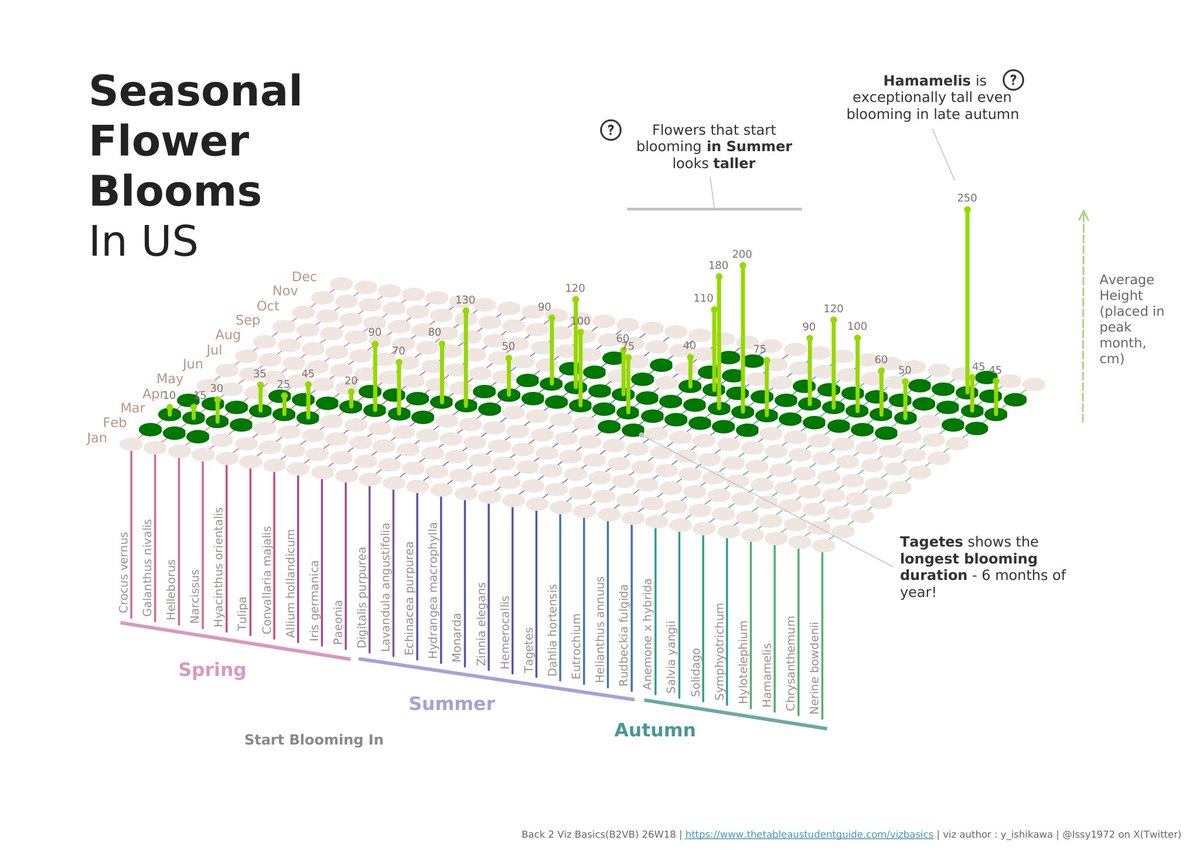
This #VizOfTheDay by @Issy1972 uses an isometric dot grid and botanical color palette to track seasonal flower blooming windows across the United States. Discover how bloom durations and plant heights unfold from spring through late autumn.
Explore the viz on Tableau Public: https://t.co/9GQrXjZ6UV