$UVXY 𝐭𝐡𝐞 𝐭𝐫𝐚𝐝𝐞
Here is the explanation of the $UVXY trade.
As we said before, the $VIX index is not tradable, and it usually spikes well above the futures when events happen because the VIX reflects the closest-term risk, while the futures themselves are further out on the curve.
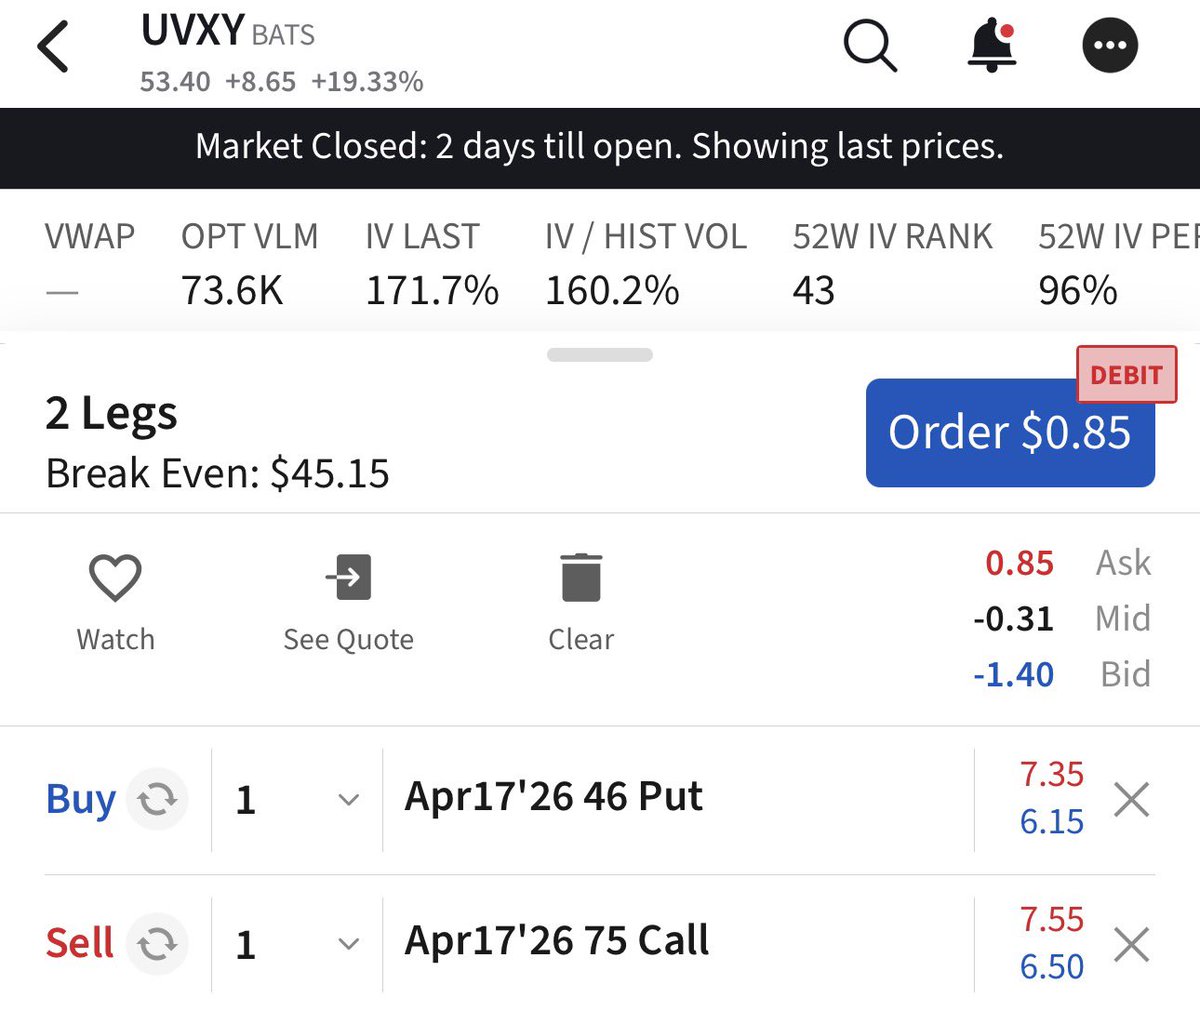
So let’s say we go to April. In this case, we’re selling the $UVXY 75 call and using the premium to buy a 46 Put. If $UVXY gets there, it probably means the $VIX reaches around the 40–50 level, and that the $VIX futures curve moves to around 30.
Now let’s say I’m wrong and the $VIX spikes to 50 or even 60. I think we can all agree that the $VIX will eventually come down from that point. That means the call you sold will be assigned and you will effectively be short $UVXY automatically when the $VIX reaches around 50.
I think we can all agree that shorting the $VIX around 50 is something you want to do. The probability of making money over the long term if you short the $VIX at 50 is essentially 100% as long as you don’t use leverage and blow yourself up.
Now let’s look at the other scenario. Let’s say things calm down this week. Boom, you’re going to make a lot of money.
I believe that within a month, $UVXY will be well below 40, regardless of what happens in the next week or so.
So either way, if you think about it carefully, you almost want to lose money on this position, because then you end up shorting $UVXY from a higher level rather than a lower one.
Either way, you win.
All option seller:
If you sold 450 calls and the stock hits 470 to 500, you do not have to lose your shares. I have never been assigned early on my calls. It blows my mind when I hear people assume this is common or inevitable.
Options for management:
1. Buy back the contract for a loss and move on.
2. Buy back for a loss and sell another further out or up (commonly called a roll).
3. Let the shares get called away.
Again, you do not lose. You defined the rules, and the outcome is what it is. At any point, you can actively manage that contract—you are not stuck. If you did not have the ability to manage a trade, options trading would be a completely different game.
I have used all these approaches when managing my TSLA positions. I will also layer in puts when calls get challenged, especially after a roll, to balance or add income.
All these voices saying you lose money when the stock runs away—like anyone can predict when or how long that lasts. If it does run hard, how long before a pullback? TSLA has taught us that repeatedly.
You sold the option, now you are upset at the results you engineered. That is 100 percent on you, and you did not lose. The outcome matched the limits you set. Live with it.
Fellow TSLA covered call sellers: How do you handle calls going deep in the money during runs? Do you roll aggressively, close early, or let them assign? Share your real-world takes below. Always learning from the community.
$50 million+ of retail funds blown up on the Christmas Eve running martingale on 1DTE SPX Iron Condor.
1,000+ people lost their life savings following his degenerate gambling “strategy” which was sold to them using deceptive sales tactics. He touted himself as Captain Condor 🤦♂️
The $VIX: Signaling a Correction Coming
The VIX has been rising even as equities pushed higher, usually a caution sign. It may be hinting at a 2–3% pullback.
But at 18.2 and 19.5, the $VIX futures (the underlying assets for $VXX and $UVXY) are already elevated. It’s not the right tool for hedging, limited upside if markets dip, and downside if nothing happens.
Better to hedge with indices like $SPX or $QQQ.
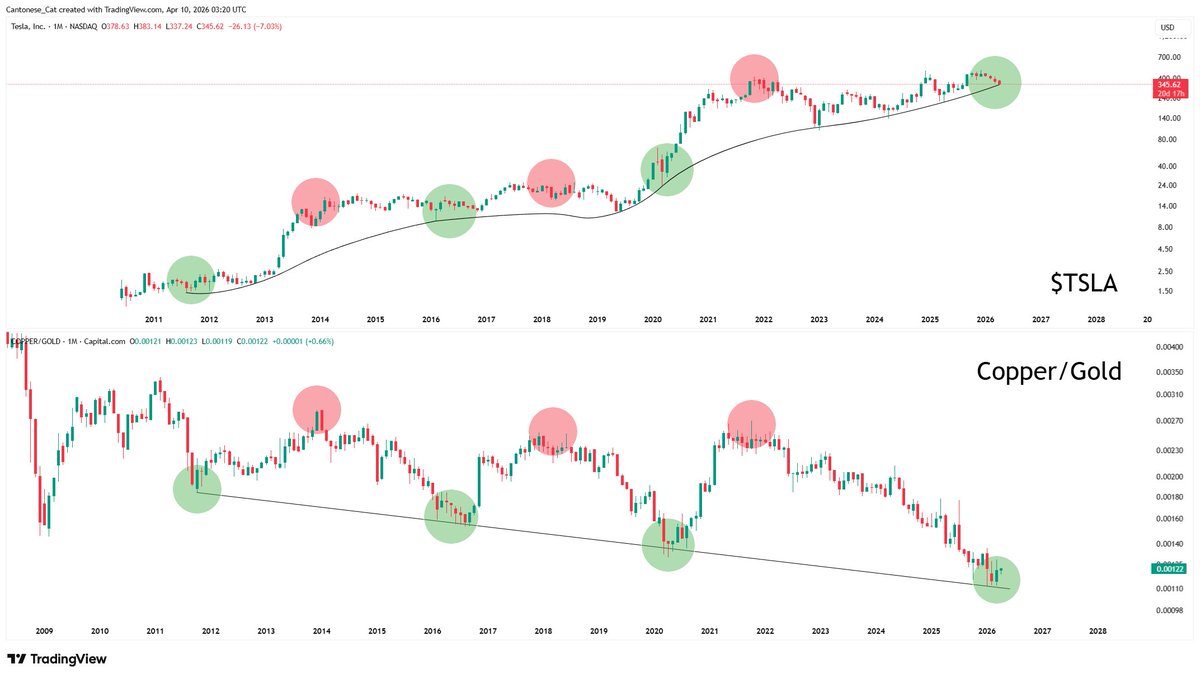
Might just be a blip, but it's usually not a good thing when the ratio of $VIX:$VIX3M (green) goes above ratio of $VIX3M to $VIX6M (red). It was a particularly useful tell July 2024.
The Christmas dip is a well known feature of VIX futures' term structure. Seth's data supports a fall seasonality that could be boosting the VIX Aug futures (which are based on Sept SPX options).
In addition, $SPX 21 day RSI is at 70.5, which signals less upside opportunity, more down side risk.
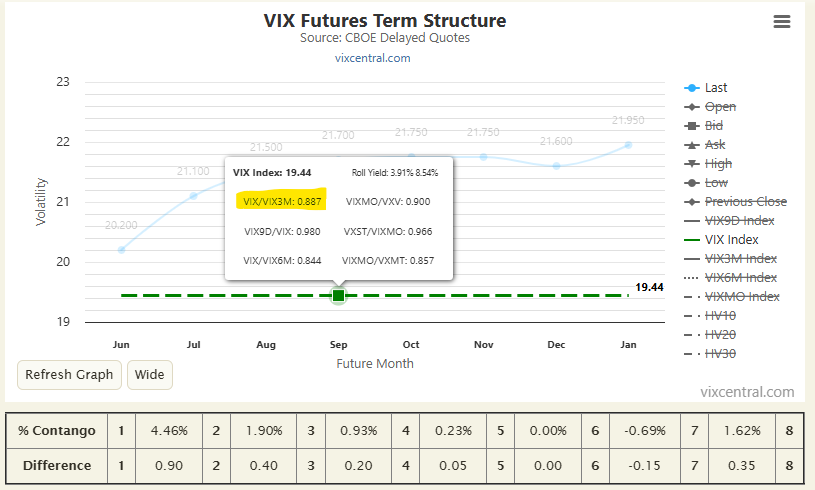
A simple risk on/off indicator is the ratio of the Cboe's $VIX & $VIX3M indicators for 30 and 93 day horizons. When it goes above 0.95 it's definitely time to think about taking some risk off--if you are a mature enough investor. Historically, it has signaled at least a day ahead (went from .915 on 1-Feb-2018 to 1.01 on 2-Feb-2018 for Volmageddon), but usually gives more time before a big volatility spike. For example, signaled 21-Feb-2020 for the Covid crash, 18-July-24 for the 5-Aug-24 VIX spike, and 24-Feb-25 for the 7-April-25 spike.
Of course, it will also generate a fair number of false alarms, so trading just from VIX/VIX3M won't be your road to riches, and It won't protect against a doomsday overnight event.
If you are going to play this game, remember, probably the hardest, and most important thing is to have a strategy for getting back in. Otherwise, you are likely much better just buying $SPY and holding...
Just hovering over the $VIX line on https://t.co/aDa04dWyUB reveals the ratio.
Okay I have taken this 20 page article on option arbitrage and asked Grok to summarize the main points of the arbitrage (tons of math problems that make me start drooling and eyes go cross eyed)
I am asked about this daily in discord and these flows get posted a ton because 1. they are usually a large $ amount 2. they are very far ITM
This only applies to far ITM put options - they are usually yellow (OI exceeded in one line) blocks (I have posted examples) they also will often come in under multi leg
if this still doesn't make sense then just take my word for "ignore arbitrage flow"
my TLDR version if i had to sum it up - market makers and institutional funds are exercising deep ITM put options (they never stay in OI the next day) to scrape the difference in pennies against the stock option value and the underlying that other players are losing out on.
The document delves into the phenomenon of early exercise of American-style put options and the associated practice known as "Short Stock Interest Arbitrage" (SSIA).
Put Options Exercise: The paper explains that while call options are ideally exercised just before a dividend payout, put options can be optimally exercised any day before expiration. However, many long put option holders miss out on exercising their options when it would be financially beneficial, leaving significant potential gains unclaimed.
Short Stock Interest Arbitrage (SSIA):
Scale: Out of all put option exercises during the study period, 58.0% were linked to SSIA, indicating that nearly six out of ten exercises were strategic moves to capture short open interest rather than legitimate option use.
Participants: The primary players in SSIA are market makers and proprietary trading firms, accounting for 41.9% and 56.1% of these activities, respectively. These entities are particularly active when the net interest income from exercising options is high.
Economic Impact: The study estimates that long put holders lost about $1.9 billion due to not exercising their options at optimal times. This loss is captured by market makers and proprietary firms who strategically buy and exercise deep in-the-money put options to earn the interest that would have gone to the original short sellers.
Market Integrity Concerns: The paper raises questions about the design of American-style options. If many buyers pay for the flexibility of early exercise but don't utilize it due to costs, lack of knowledge, or inability to monitor their positions, it suggests that European-style options (which can only be exercised at expiration) might better serve market integrity and efficiency.
Conclusions:
The study highlights inefficiencies in the options market, where the failure to exercise put options at the right time leads to substantial financial losses for option holders.
SSIA is a significant activity driven by professional traders who exploit these inefficiencies to their benefit.
There's a call for reevaluating the structure of stock options, possibly favoring European-style options to align the interests of option buyers more closely with actual market practices and to potentially reduce these arbitrage opportunities that undermine market integrity.
The $VIX is selling off even as the market declines—that’s a fact. It’s also a fact that traders usually unwind hedges before they start buying. I focus on facts, not opinions. And frankly, your opinions are worthless.
People keep telling me what Trump will do next, what Powell will do—who cares? Why does it matter? Stop speculating and focus on the facts, on the present.
Based on the comments and the article itself it seems like a lot of folks don’t have an understanding as to how tail options actually work. I’m seeing a lot of people saying things like “what an idiot, $VIX will never get there” 🤦🏽♂️.
$VIX is effectively variance which is vol². This means that when plagued with vol spikes, the surface flattens out which creates dislocations across the board (ex: VIX 50c priced nearly identical to the VIX 65c) as market makers reprice all of their vol surfaces higher.
This can be disastrous for people selling tail options which are naturally vulnerable to vol shocks. Especially the 180 calls. Most folks don’t understand derivatives, and don’t realize that tail options don’t need to go anywhere close to in the money for the option to have an insane return.
When looking at tail option data from covid you had $VIX 1 delta calls returning over 200X! So for those 180 calls, VIX wouldn’t need to get anywhere close to 180 for the buyer to have a massive return.
This is why every few years you hear about some guy blowing up a fund. Because some genius gets the idea that he can choose the furthest strike possible and sell 1% of his AUM in premium. Then vol spikes, the options don’t go in the money, and he still loses the whole fund because the repricing of risk drives the options 75X.
This is why most people shouldn’t trade options. They don’t really understand how they work. If things didn’t work this way, tail selling would be the easiest thing in the world “just pick the furthest strike and sell it”.
Here's how to practically use and interpret each of these 30-day volatility indexes, including their IF/THEN implications, and how to analyze them together:
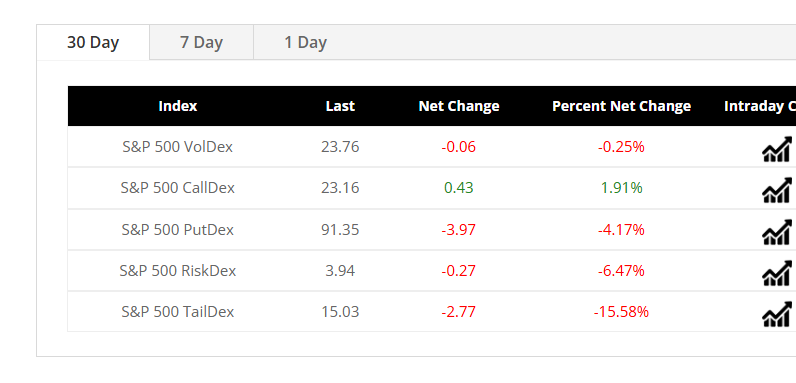
Scenario (CURRENTLY based on the website)
VolDex flat/slightly down, PutDex sharply ↓, CallDex slightly ↑, RiskDex ↓, TailDex sharply ↓:Short-term bearish risk and tail-risk falling significantly, while calls modestly bid. Indicates market pricing in less fear of big declines, limited downside risk in immediate term, possible bullish relief or sideways consolidation. Implication: Favor neutral to slightly bullish trades; consider premium-selling strategies (credit spreads, put selling) due to falling put/tail volatility.
1. S&P 500 VolDex (30-Day ATM Volatility)
Measures: 30-day implied volatility from At-The-Money (ATM) options.
Use:Baseline volatility level.
Indicates expected daily moves in SPX.
IF VolDex rising THEN:General increase in expected volatility.
Hedge longs, consider smaller position sizing or caution in directional trades.
IF VolDex falling THEN:Lower expected volatility; supportive for equities.
Favor neutral-to-bullish strategies (short volatility, premium selling).
2. S&P 500 CallDex (30-Day Call Option Volatility)
Measures: 30-day implied volatility specifically from call options.
Use:Gauge upside volatility or bullish sentiment.
Insight into speculative bullish positioning or expected upward momentum.
IF CallDex rising THEN:Market anticipating upward volatility (upside breakout or speculative bullish activity).
Consider bullish breakouts or momentum trades.
IF CallDex falling THEN:Bullish optimism declining; upside expectations muted.
Bullish moves may stall, expect sideways/downward drift.
3. S&P 500 PutDex (30-Day Put Option Volatility)
Measures: 30-day implied volatility specifically from put options.
Use:Measure downside risk or bearish sentiment.
Reflects demand for hedging/protection.
IF PutDex rising THEN:Rising downside fears; elevated protective hedging.
Consider defensive positioning or bearish trades.
IF PutDex falling THEN:Reduction in fear; market participants less worried about sharp declines.
Supports bullish-to-neutral sentiment; opportunities in premium selling.
4. S&P 500 RiskDex (30-Day Skew: OTM Put vs ATM Volatility)
Measures: Spread between implied vol of OTM puts and ATM options.
Use:Quantifies demand for downside protection relative to general volatility.
Indicates perceived "tail risk" or asymmetric fear in market.
IF RiskDex rising THEN:Increased hedging against large negative moves.
Greater perception of downside tail-risk.
IF RiskDex falling THEN:Tail-risk fears diminishing.
Possible bullish indication or complacency signal.
5. S&P 500 TailDex (30-Day Deep OTM Put Volatility)
Measures: Implied volatility from deep out-of-the-money puts.
Use:Indicates how much investors fear extreme "black swan" events.
Shows whether investors expect catastrophic events within the next 30 days.
IF TailDex rising THEN:Rising fear of severe negative shocks.
Consider highly defensive positions or tail-risk hedging strategies.
IF TailDex falling THEN:Decreasing expectations of catastrophic outcomes.
Confidence or complacency increasing; bullish environment or potential underpricing of extreme risks.
How to Use These Indexes Together (Conjunctive Analysis):
Scenario 1:
VolDex ↑, PutDex ↑, CallDex ↓, RiskDex ↑, TailDex ↑:Market extremely defensive; strong bearish outlook.
Implication: Reduce longs aggressively, hedge downside, prepare for sharp market downturn.
Scenario 2:
VolDex ↓, PutDex ↓, CallDex ↑, RiskDex ↓, TailDex ↓:Bullish sentiment, reduced fears of downside events.
Implication: Positive equity market bias; trade bullish spreads or short volatility strategies.
Key Takeaways:
VolDex: Overall market volatility baseline.
CallDex vs. PutDex: Gauges relative bullish/bearish sentiment.
RiskDex and TailDex: Gauge investor perceptions of severe downside or tail risks.
Always look at these measures in combination:
Large divergence (e.g., TailDex and PutDex falling while CallDex rising) signals potential shifts in sentiment or hedging activity.
Alignment (all rising or falling together) confirms broader sentiment (bearish or bullish).
Understanding these relationships provides deeper insight into positioning and sentiment, helping you fine-tune strategy and risk management decisions.
@Nations_Indexes
“Let’s buy $VIX or $VXX puts!” Hold on—it’s more complicated than it seems. The most important factor in options pricing is implied volatility. When volatility subsides, so does the options premium. However, the $VIX itself represents implied volatility, so as the $VIX declines, options on VIX-related products may not appreciate as expected, since falling volatility also reduces their premium.
The VIX reached 26+ today
The Implied Volatility for all the stocks is higher than its historical IV
It’s a good day to sell Covered Calls even if the stock might be down or flat
Vega-Delta relationship is skewed towards Vega today due to the IV
Premiums are up
$NVDA $TSLA