Fascinated by extreme weather and the extreme events that come with it. (Any fantasy hour maps posted are for entertainment & learning purposes, not forecasts.)
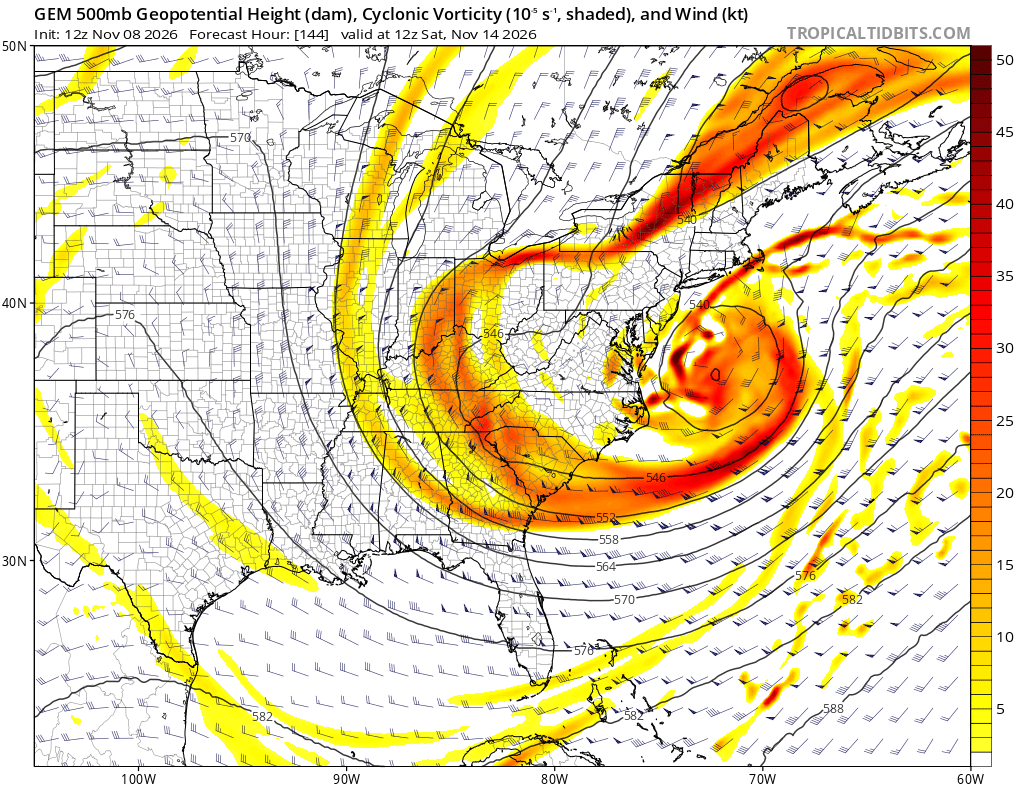
The more likely solution is the southern branch never gets that organized / dominant and you just get a large, messy system with the low further north and weaker. But if that southern branch wins out and then the northern branch phases into a bombing low off Hatteras, get the popcorn ready!
The Canadian model is very close to something wild next weekend. Assuming you get this much energy bundling in the southern branch (you probably won't), all you would need to truly get the party started is that northern piece (more energy + cold air) to phase into the northwest side of the storm.
@MeidasTouch And along those lines, they need to tie the unaffordability of everything to the corruption. Make it clear that a part of the reason you're going after these people is because they're poisoning the entire economic system with their endless crime and fraud.
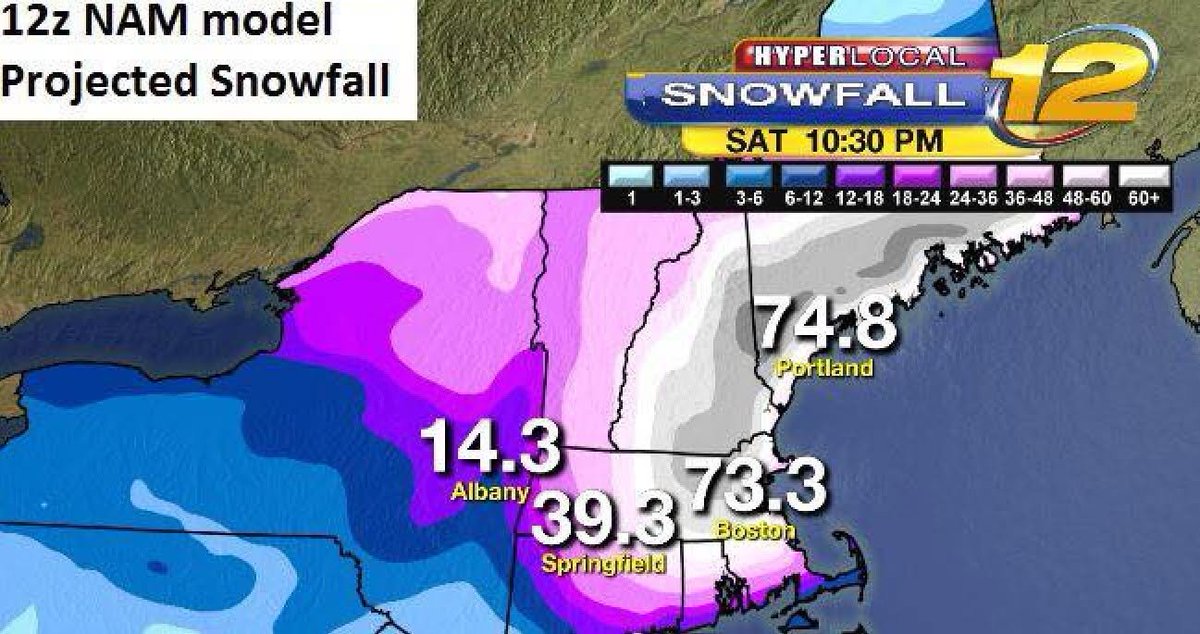
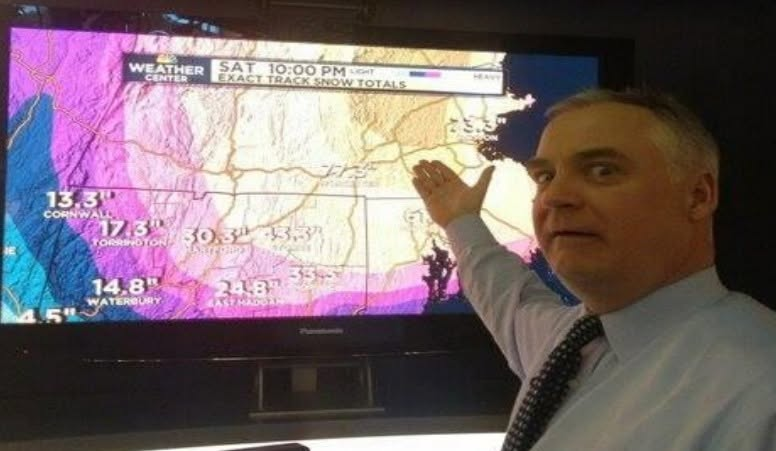
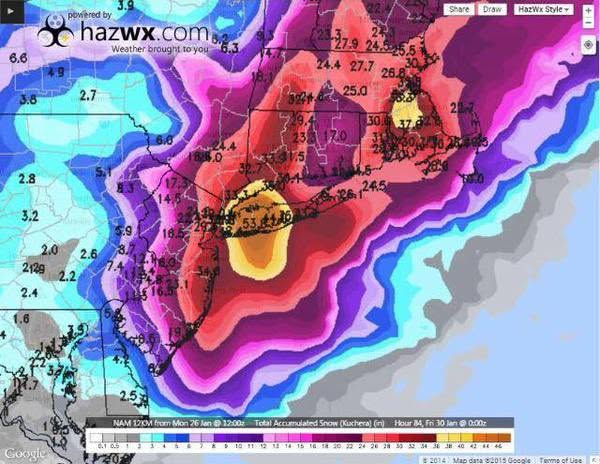
Still probably the most impressive individual band in a nor'easter I've ever seen (although the ones from this past February over RI and southeast Mass came close). To tie it all together, one of the things I love about the 2013 band is it kind of showed that in all of the NAM's craziness and overexuberance, it actually did base that off of something that was about to happen. Cut the totals in half and move the swath southwest, and you pretty much get what played out.
Also, if I remember correctly, everything south of Hartford and Providence here was depicted as rain for part of the run (early in the storm), so that's the only reason why the five foot totals didn't extend down to the south coast. The QPF was absolutely there. Juiciest run I've ever seen for a blizzard.
@Lclimateguy Correct! Watching that thing play out frame by frame is still one of the craziest things I've ever seen. It basically had the band that actually did develop out over central Connecticut, but it was further northeast and lasted twice as long.
Meteorologists' love-hate relationship with the regional weather model known as the NAM came to an end Tuesday after a 21-year run. https://t.co/JNxGIOTatV
@NycStormChaser I'll never forget watching this NAM run come in frame by frame in February 2013. Literally could not believe what I was watching. Every updated hour was crazier than the one before it.
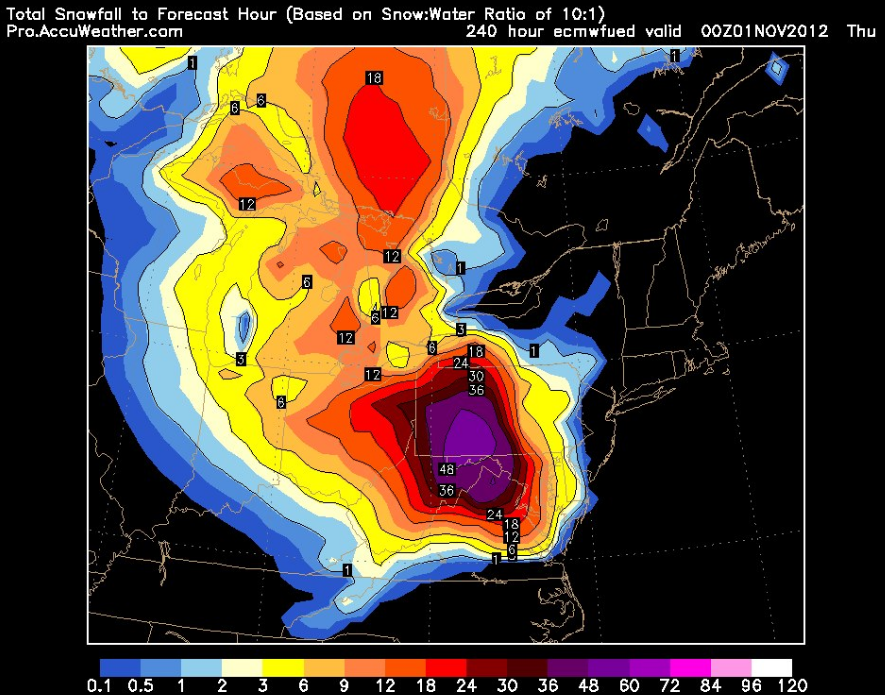
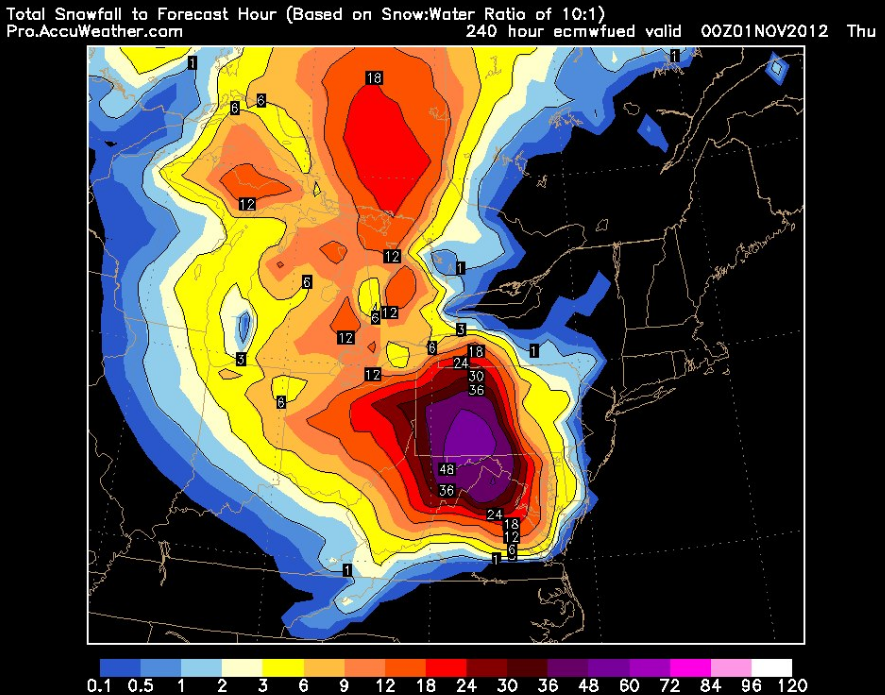
@HurricaneJasonX In the initial runs for Sandy (over a week out), when the Euro was (correctly) advertising this trough capture, the cold punch associated with it was (incorrectly) modeled much stronger. These are the widespread snow totals that could have fallen if it got that part right.
We're still 4-6wks away from ENSO peak, first distant signs of the Super El Niño's demise is here! Cooling, deep in the Indo-Pacific, has begun migrating eastward while the cooling has intensified, it'll still take several months to chew away the 2026-27 Super El Niño event.
Now, it’s east India that’s under threat.
In the Bay of Bengal (a region that hasn’t seen named storm activity since the devastating duo of Cyclones Ditwah and Senyar 11 months ago), a concerning signal has arisen for a potential CAT 3+ storm off the coast of Andhra Pradesh next week. Once he forms, he will be named ARNAB.
It’s very early, and vertical wind shear could be an intensification inhibitor, but you never like to see such a robust signal so close to major population centers like this. We’ll be tracking this system closely.
@NycStormChaser Some of those early European model runs also had an even more potent Arctic element to the negatively tilted trough. This would have been an all time crippling event in places like Pittsburgh and DC.
It's crazy to think that as wild as the Blizzard of 2005 was, it left an entire additional layer of explosive potential on the table with that energy in the desert southwest near the Mexico / Arizona border not getting released. If that came out and phased into the south side of the storm as it was getting going along the east coast, the NESIS CAT 5 club has another member.
Hurricanes and outages - from our research @PowerOutage_us showing the power outage footprints for US landfalling hurricanes producing 1 million outages. Isaias 2026 added for comparison. Each storm is unique. Large area impacted over the last decade.
We ran a power outage simulation for the Great New England Hurricane of 1938. The hurricane made landfall as a category 3 storm in Long Island, NY with a forward speed over 40 mph. Outages would happen fast and we estimated around 9 million customers out at peak with today's power grid. #hurricane #poweroutage #newengland #extremeweather