@0xaporia Great chart! Did you try to identify what is the local max and min of % return within the 30 and 60 day, and the median duration for it to happen?
Seems like the takeaway is we should buy more when everyone is euphoric and buy less when everyone is not since both spectrums gives a net median positive return.
Conclusion: buy low and buy high
@VannaCharmer So it seems like Megaeth can either continue their current strategy and lose, or change their core offering and risk maiming it's unique selling point? Aren't they just pumpfun, but on a project level instead of token?
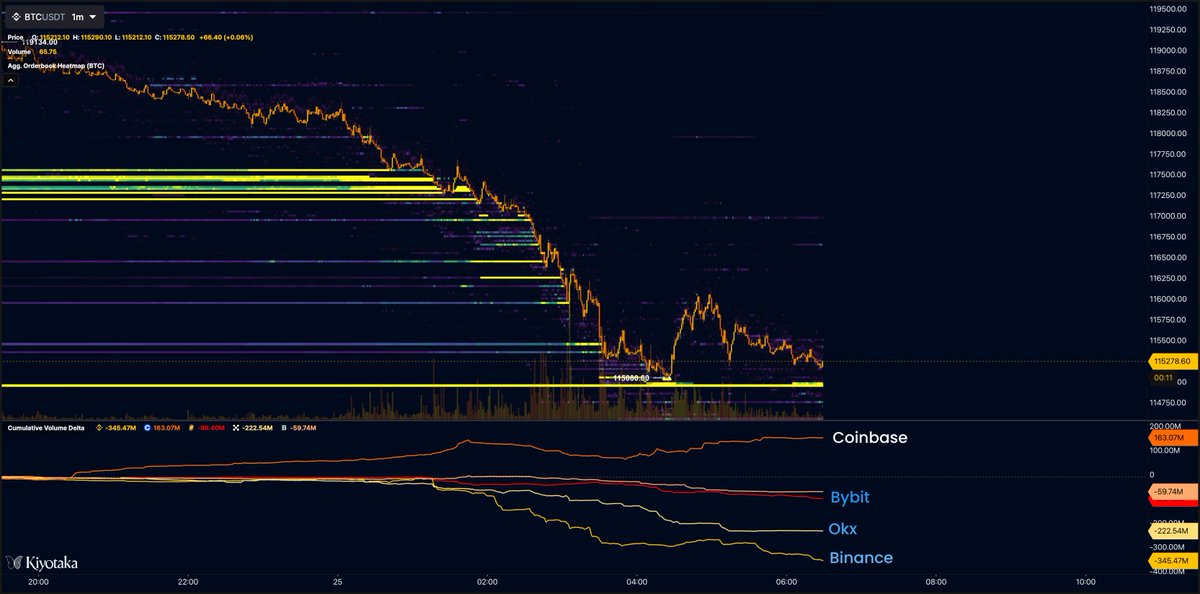
Coinbase retail vs. the world: US retail keeping the faith while institutional whales dump everywhere else through aggressive TWAPs
They've drained a lot of the $BTC buy liquidity. Last cluster at $115K
Altseason doesn't lift all ships equally. Some rise higher and faster, and some doesn't at all. At its core, fundamentals matter; identify aces, then ape the lows and sell when your ancestors whisper "yes"
@marcelomariussi@kiyotaka_ai If you set the candle to hourly and change VPSV indicator to hourly as well, you'll get footprints for the actual candle. However, it's overlapping on the same candle and not separated, which is visually a bit messy
We're thrilled to announce that Kiyotaka now supports footprints – one of our most requested features. We're eager to release it early for everyone to test and provide feedback.
Kiyotaka now integrates Pyth data for real-time traditional market insights
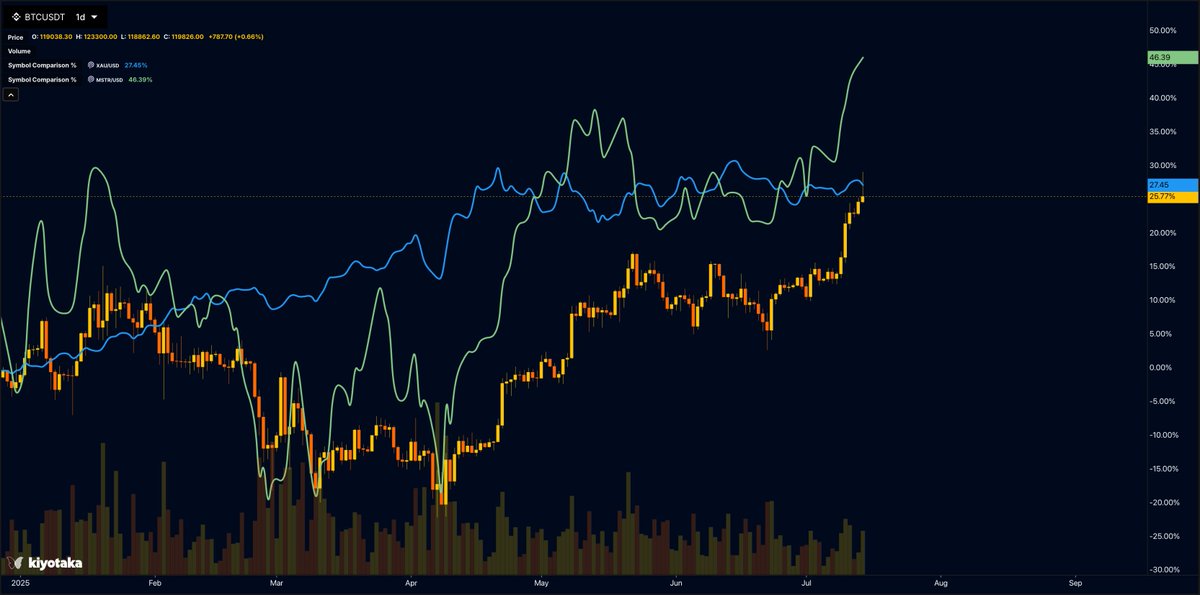
Added: Index and crypto ETFs (SPY, IBIT) macro assets like XAU, equities (MSTR, NVDA, TSLA), US rates via @PythNetwork
Track macro-crypto correlations easily—see BTC catching up to gold YTD
Hyperliquid Support Now Live
Today, we are launching real-time liquidation heatmaps for Hyperliquid, allowing you to view every trader's liquidation levels
See how we tracked James Wynn's positions right up to his liquidation—giving users early warning of potential volatility