@Flipkart@flipkartsupport Please treat this as an urgent matter and arrange for installation at the earliest possible time.
Order ID: OD335576161777151100
@Flipkart@flipkartsupport Due to this prolonged inaction, I have now registered formal complaint with the National Consumer Helpline (NCH). This message is to officially inform Flipkart about the same and to request immediate installation without any further delay.
@Flipkart@flipkartsupport As this is water purifier, it is a daily necessity, and the delay is causing major inconvenience to my family. Despite multiple assurances, there has been no resolution.
@Flipkart@flipkartsupport i have been continuously following up with both Flipkart customer support and the vendor installation team, but every time I am informed that it will be completed “within 2 days” or “within 24 hours.” Unfortunately, no action has been taken so far.
@Flipkart@flipkartsupport Dear Flipkart Team,I am writing to raise a complaint regarding the delay in installation of my water purifier. ordered was placed on 26/09/2025 and delivered on 06/10/2025. However,even after 10 days of delivery, the installation has not been completed
📈 Strong Possible Breakout Chart Analysis 🚀🔍
NSE:EMAMIPAP 145
1. Symmetrical Triangle Pattern Formation (2.5 Years):
The stock is currently trading within a symmetrical triangle pattern, which has been forming over a period of 2.5 years. This pattern typically indicates a period of consolidation and uncertainty in the market.
2. Near Resistance Level:
Presently, the price is approaching a significant resistance level around the 150-155 range. If the stock manages to surpass this resistance and maintains its position above these levels, it could signal a potential breakout.
3. Positive Price Movement and Volume:
There is observable upward movement in the stock's price, complemented by notable volume activity. This combination of price and volume suggests growing investor interest and potential strength in the stock's upward momentum.
4. Upside upon Breakout:
Should the stock successfully breach the 150-155 resistance zone and sustain its position above this level, it may pave the way for a substantial upside move. Potential price targets in the range of 200-300 levels could be achievable in the coming days, indicating significant potential gains.
5. Watch for Breakout Confirmation:
Investors should closely monitor the stock's behavior around the 150-155 resistance range. A decisive breakout above this level, accompanied by sustained trading volume, would confirm the breakout. Conversely, failure to breach this level could result in continued consolidation between the 155 to 120 levels.
🚨🚫 Disclaimer:
This analysis is for educational purposes only and not financial advice. The author is not a SEBI-registered financial advisor. It is recommended to conduct thorough research and consult certified financial professionals before making investment decisions.
#Trading #Stocks #BreakoutStock #TechnicalAnalysis 📊🚀🔍
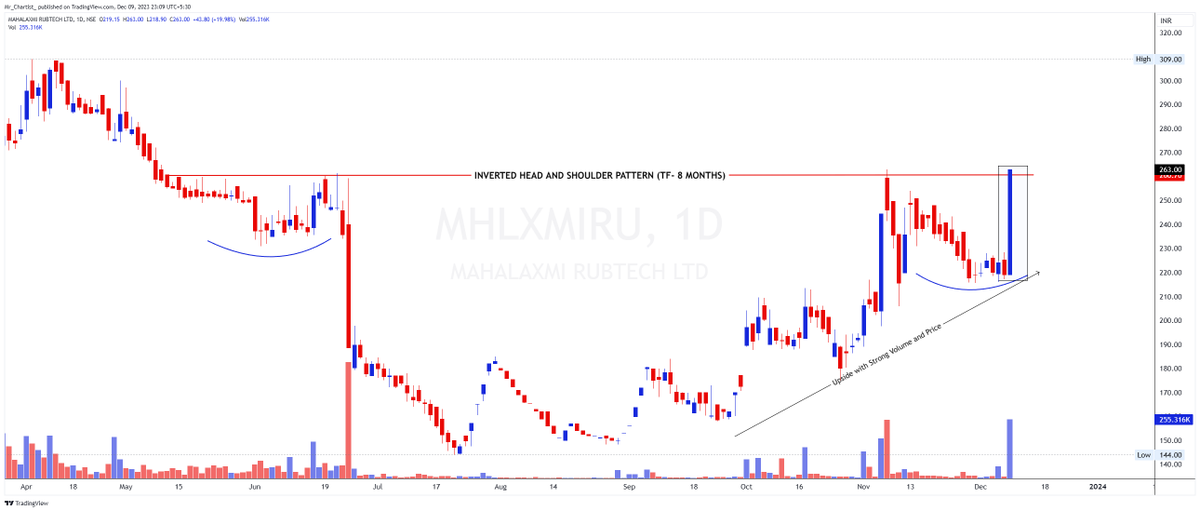
STRONG SWING BREAKOUT CHART TO WATCH -
NSE: MHLXMIRU 263
1. Inverted Head and Shoulder Breakout:
The stock has recently experienced a breakout in the inverted head and shoulder pattern, a formation that unfolded over the past 8 months. This breakout is a crucial development for potential price movement.
2. Trading at Strong Neckline:
At present, the price is trading at the formidable neckline, specifically around the 260 level. This level holds significance as it marks a strong breakout point for the stock.
3. Management Above Breakout Level:
The stock has shown resilience by maintaining its position above the breakout level, supported by the presence of robust marubozu candlesticks. This suggests a strong potential for upside movement in the upcoming days.
4. Strong Volume Indication:
A noteworthy aspect is the accompanying strong volume during this breakout. Elevated volume levels further validate the potential for a robust upward move in the stock.
5. Anticipated Upside Targets:
Assuming the stock continues its upward trajectory in line with the breakout, potential upside targets could be in the range of 310 to 330 levels in the coming days. These levels are crucial to monitor for potential resistance.
6. Consolidation Scenario:
In case the stock struggles to hold above the resistance level, a scenario of consolidation may unfold. This consolidation range could extend between 260 and 220 levels in the chart.
🚫 Disclaimer:
This analysis serves educational purposes and is not financial advice. The author is not a SEBI registered financial advisor. It is recommended to conduct thorough research and consult certified financial professionals before making investment decisions.
#TechnicalAnalysis #Trading #Stocks #InvestingJourney
4 free AI powered resume builders:
1. https://t.co/91wmga37iF
Auto-complete and fill data for you.
2. https://t.co/tkEcAbaJh4
Build resume with ChatGPT.
3. https://t.co/bYLgOFODN0
Create resume with AI in minutes.
4. https://t.co/eut8xxqYDq
AI resume writing assistant.