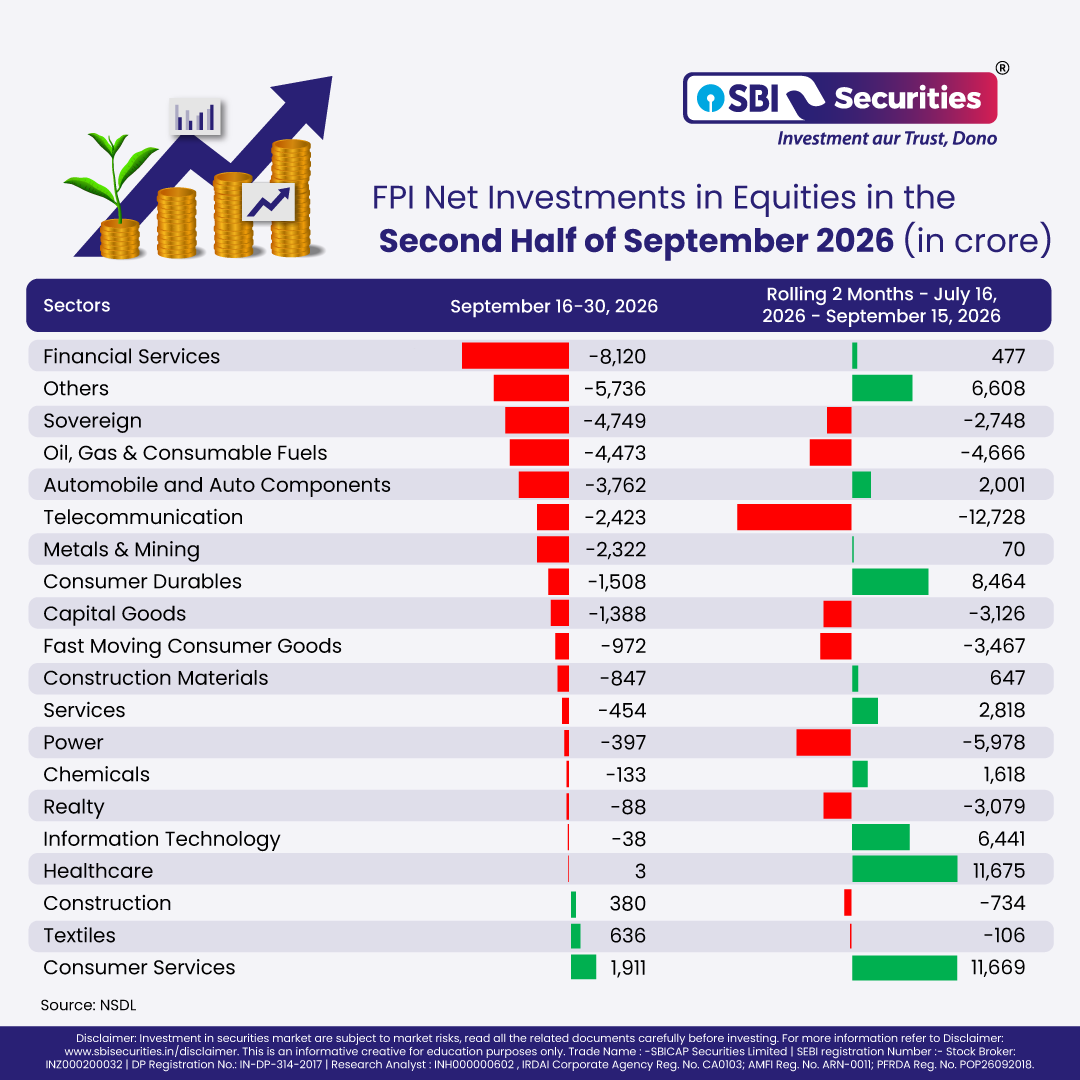
FIIs remained net sellers in the cash market on October 19, offloading equities worth ₹1,149 crore. They have been net sellers in 16 of the last 17 trading sessions, with cumulative outflows reaching ₹84,121 crore.
Meanwhile, the FII long-short ratio in index futures declined marginally to 10.38% on October 19, compared to 11.32% on October 16. Mild short buildup was observed in index futures, indicating continued bearish stance among foreign investors.
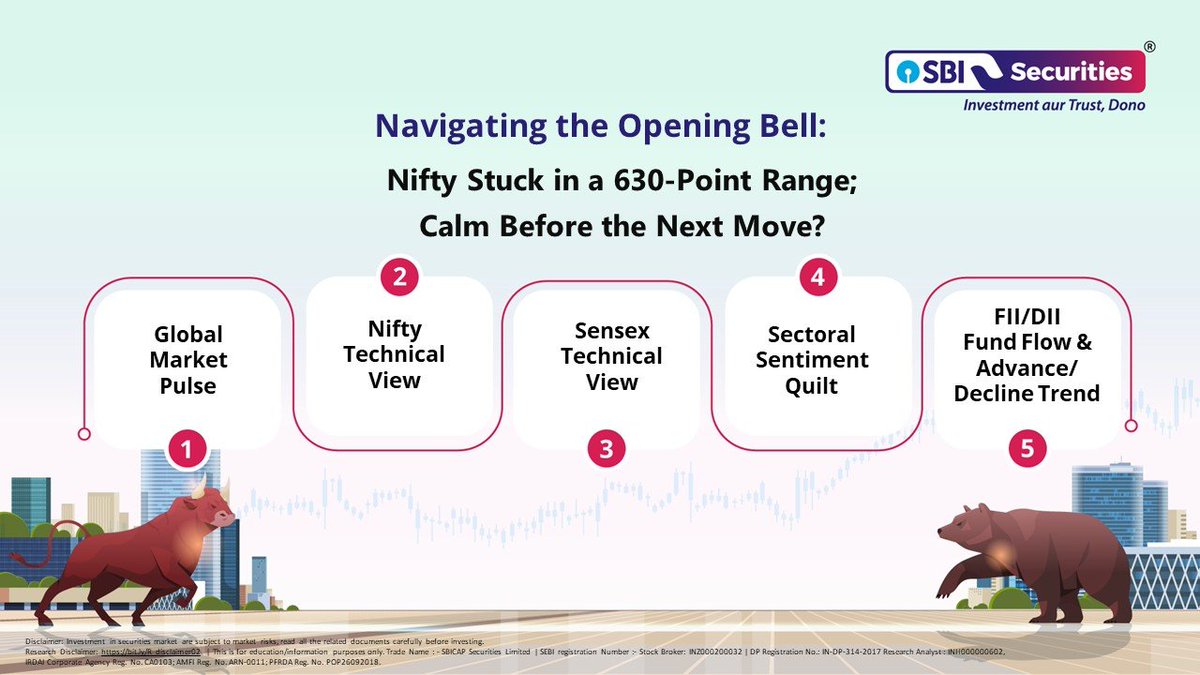
After rebounding nearly 1,000 points from its recent low of 22,180 in just eight trading sessions, Nifty witnessed profit booking on Monday. The index failed to surpass its 38.2% Fibonacci retracement level and subsequently declined sharply, closing 1.11% lower and slipping below the 22,900 mark.
Following the correction, Nifty has slipped below its 20-day EMA, signalling a loss of short-term momentum. The daily RSI has also moderated from its recent high of 52.81. However, it continues to trade above its 9-day moving average, suggesting that momentum has not weakened significantly despite the pullback.
Going ahead, the 22,750–22,730 zone is likely to act as a crucial support area. A decisive break below 22,730 could intensify selling pressure and drag the index towards 22,600.
On the upside, the 23,000–23,030 zone is expected to act as an immediate resistance. A sustained move above 23,030 would be required to revive bullish momentum and extend the ongoing recovery towards higher levels.
Disclaimer: https://t.co/L8bjGLxMEQ
FIIs turned net buyers for the first time in 15 trading sessions, purchasing equities worth ₹1,166 crore on October 16. This comes after 14 consecutive sessions of selling, during which they offloaded equities worth ₹84,138 crore. Sustained buying by FIIs could extend the ongoing pullback in the index. However, it is too early to conclude that FII sentiment has undergone a meaningful shift.
Meanwhile, the FII long-short ratio in index futures improved to 11.32% on October 16 from 8.95% on October 12. During the same period, net short positions in index futures declined from 2.95 lakh to 2.72 lakh contracts, indicating short covering.
Nifty staged a strong comeback as easing global headwinds revived investor sentiment. Since the beginning of the August series, Nifty had corrected nearly 10.5%, falling from 24,774 to 22,179, largely driven by a sharp surge in US bond yields from 4.7% to a multi-year high of 5.36%. This triggered significant foreign fund outflows, resulting in Nifty closing in the red for eight consecutive weeks.
However, the tide turned this week as US bond yields cooled to 5.09%, while crude oil prices also witnessed a temporary pause in their upward trajectory. The recovery was spearheaded by frontline heavyweights, particularly IT stocks, with Nifty IT emerging as the week's best-performing sector, gaining nearly 11.72%.
Technically, Nifty formed a strong bullish candlestick on the weekly chart following a Doji formation in the preceding week, signalling a potential trend reversal from a crucial support zone. However, the lack of broader market participation remains a concern, as the recovery has largely been restricted to select large-cap counters.
The spotlight now shifts to the earnings season, with HDFC Bank, ICICI Bank and Axis Bank scheduled to announce their results over the weekend. These three banking heavyweights collectively account for 22.8% of Nifty and 42.85% of Bank Nifty, making their earnings crucial for the market's next directional move.
Looking ahead, the 22,750–22,800 zone remains a crucial support, followed by 22,460. As long as Nifty sustains above 22,750, the recovery is likely to extend. On the upside, 23,400–23,440 remains the immediate resistance zone, a decisive breakout above which could propel the index towards 23,650, coinciding with its 100-day EMA.
Disclaimer: https://t.co/L8bjGLxMEQ
Key Index Levels at a Glance!
Track the 20, 50, 100 & 200-day SMAs of key indices.
Stay aligned with the trend. 📈📉
Disclaimer : https://t.co/yh5JPLwFWc
FIIs continued to remain net sellers in the cash market on October 15, offloading equities worth ₹5,285 crore. The cumulative outflow over the last 14 trading sessions has now reached ₹84,138 crore.
Meanwhile, the FII long-short ratio in index futures improved to 10.80% on October 15, compared to 9.39% on October 14, indicating decent short covering in index futures.
On Thursday, Nifty witnessed strong upside momentum, testing the 23,000 mark during the session before closing 1.66% higher. The index broke out of the consolidation range that had persisted over the previous 11 trading sessions, signalling renewed buying interest. On the daily chart, Nifty formed a strong bullish candle with a minor lower wick, reflecting sustained buying interest.
From a technical perspective, Nifty closed above its 20-day EMA for the first time since August 25. The RSI continued to rise towards the 50 mark, indicating improving momentum, while the rising MACD histogram suggested easing bearish pressure and strengthening sentiment. However, sustained follow-through buying will be crucial to confirm the durability of the breakout.
The 22,830–22,850 zone will act as immediate support. A sustained move below this range could trigger selling pressure towards 22,680. On the upside, the 23,150–23,170 zone is likely to act as an immediate hurdle. A decisive breakout above this range could extend the recovery towards 23,300, provided buying momentum remains strong.
Disclaimer : https://t.co/L8bjGLxMEQ
FIIs remained net sellers in the cash market on October 14, offloading equities worth ₹1,857 crore. The cumulative outflow over the last 13 trading sessions has now reached ₹78,853 crore.
Meanwhile, the FII long-short ratio in index futures declined marginally to 9.39% on October 14 from 9.83% on October 13. Fresh short positions were built in index futures, with no significant signs of short covering emerging so far.
On Wednesday, Nifty traded within a range of nearly 200 points, marking its narrowest trading range in the past four sessions. Following the previous session’s short-covering rally, the index attempted to extend its gains but failed to sustain the momentum, eventually closing 0.43% lower. Nifty has been consolidating for the past 11 trading sessions, witnessing volatile swings on both sides. On the daily chart, the index formed a bearish-bodied candle with upper and lower wicks, indicating indecision and a lack of clear directional conviction amid persistent volatility.
From a technical perspective, Nifty continues to trade below its 20-day and 50-day EMAs, keeping the near-term structure cautious. However, the RSI has gradually recovered from lower levels and is hovering near the 40 mark, while the MACD indicates an easing of selling momentum. Although these signals point towards some stabilisation, a decisive breakout is required to establish the next directional move.
Going forward, the 22,500–22,480 zone is likely to act as immediate support. A decisive break below this zone could revive downside momentum, dragging the index towards 22,330. On the upside, the 22,770–22,800 zone is likely to act as an immediate hurdle. A sustained move above this zone could extend the pullback rally towards 22,950. Until a decisive breakout emerges, Nifty is likely to remain range-bound, with the broader technical structure continuing to warrant caution.
Disclaimer : https://t.co/L8bjGLxMEQ
FIIs remained net sellers in the cash market on October 13, offloading equities worth ₹1,305 crore. The cumulative outflow over the last 13 trading sessions has now reached ₹76,995 crore.
Meanwhile, the FII long-short ratio in index futures improved marginally to 9.83% on October 13, compared with 8.95% on October 12. Mild short covering was observed in index futures.
On Tuesday, the benchmark Nifty staged a strong rebound, gaining 1.60% to close above the 22,700 mark. On the daily chart, the index formed a sizeable bullish candle, with the rally primarily driven by gains in the IT sector, followed by private banks. However, participation from the broader market remained relatively subdued compared with the frontline indices.
Despite the sharp recovery, Nifty continues to trade below its key moving averages, suggesting that the broader trend remains cautious. Nevertheless, momentum indicators are showing signs of stabilisation. The daily RSI has moved above the 40 mark and is trading above its 9-day average, while the Stochastic oscillator has registered a bullish crossover, indicating an improvement in short-term momentum.
Going ahead, the 22,830–22,850 zone is likely to act as an immediate resistance. A sustained move above 22,850 could lend further strength to the ongoing pullback and pave the way for a rally towards the 23,000 mark. On the downside, the 22,580–22,550 zone is expected to provide crucial support. As long as the index sustains above this support band, the near-term pullback bias is likely to remain intact.
Disclaimer : https://t.co/L8bjGLxMEQ
FIIs were net sellers in the cash market on October 12, offloading equities worth ₹1,708 crore. The cumulative outflow over the last 12 trading sessions has now reached ₹75,690 crore.
Meanwhile, the FII long-short ratio in index futures declined to 8.95% on October 12 from 9.60% on October 9, indicating a buildup of short positions in index futures.
On Monday, the benchmark index Nifty opened with a gap-up but failed to sustain its initial gains and witnessed gradual selling pressure throughout the session. Consequently, the index settled at 22,363, down 0.70%, forming a bearish candle with small shadows on either side, reflecting sustained selling pressure.
Technically, the index continues to trade below all its key short-term and long-term moving averages, which are trending lower and indicate a weak underlying market structure. Furthermore, the daily RSI remains in the super bearish zone under the RSI range shift framework, highlighting the continued absence of meaningful bullish momentum.
Going ahead, the 22,230–22,200 zone will act as a crucial support area. A decisive break below 22,200 could intensify the ongoing corrective phase and drag the index towards 22,050. On the upside, the 22,500–22,530 zone is likely to act as an immediate resistance. Unless Nifty decisively reclaims and sustains above 22,530, the broader trend is expected to remain weak, with a negative bias.
Disclaimer : https://t.co/L8bjGLxMEQ
FIIs remained net sellers in the cash market on October 9, offloading equities worth ₹3,569 crore. The cumulative outflow over the last 11 trading sessions has now reached ₹73,982 crore.
Meanwhile, the FII long-short ratio in index futures improved marginally to 9.60% on October 9, compared with 8.07% on October 5, indicating minor short covering in index futures.
On Friday, Nifty opened with a modest gap-up and extended its gains to close 1.30% higher, snapping a prolonged losing streak and signalling renewed buying interest at lower levels. On the daily chart, the index formed a bullish harami pattern, hinting at a possible pause in the prevailing bearish momentum. Notably, Nifty also formed its first positive weekly candle after eight consecutive weeks of declines, suggesting a tentative improvement in market sentiment.
From a technical perspective, the RSI has started recovering from the oversold zone and is approaching the 30 mark, indicating a possible easing of selling pressure and scope for a short-term pullback. However, Nifty continues to trade below its 20-day and 50-day EMAs, keeping the broader trend cautious. Sustained follow-up buying will be crucial to validate the recovery.
Going forward, the 22,350–22,330 zone is likely to act as immediate support. A decisive break below this zone could revive selling pressure and drag the index towards 22,200. On the upside, the 22,660–22,680 zone, coinciding with the 10-day EMA, is likely to act as an immediate hurdle. A sustained move above this zone could trigger further short covering and extend the pullback towards 22,820.
Disclaimer : https://t.co/L8bjGLxMEQ
Summary of Market Participants Positioning in the Derivative Segment for 8th October, 2026
Synopsis:
FIIs sold to the tune of 12943.58 cr. while DIIs bought to the tune of 10703.11 cr.
FIIs' Long short ratio for index futures is at 8.53% as on a net basis, they sold 8824 index futures.
On the stock futures front, FIIs have bought to the tune of 29144 contracts, while on the Options Front, FIIs sold 4199 call contracts and bought 91418 Put Option contracts
Disclaimer : https://t.co/L8bjGLxMEQ
FIIs remained net sellers in the cash market on October 7, offloading equities worth ₹12,944 crore. The cumulative FII outflow over the last 10 trading sessions has now risen to ₹70,413 crore.
Meanwhile, the FII long-short ratio in index futures declined to 8.53% on October 8 from 9.15% on October 7, with a significant buildup of short positions seen in index futures, indicating continued bearish positioning.
On Thursday, the benchmark Nifty witnessed a sharp sell-off and formed a sizable bearish candle on the daily chart. More importantly, the index registered its lowest daily close since April 2025. Rising Brent crude prices, coupled with continued weakness in the USD/INR pair, weighed on overall market sentiment.
From a technical perspective, the trend remains firmly bearish, with the index trading below all key moving averages. Momentum indicators also continue to signal weakness, while the daily RSI remains in the super bearish zone as per the RSI range-shift framework. This suggests that the index is likely to remain under pressure and continue its downward trajectory in the near term.
Going ahead, the 22,350–22,400 zone is likely to act as an immediate hurdle for the index. As long as Nifty remains below the 22,400 mark, the prevailing bearish trend is expected to continue. In the short term, the index may extend its decline towards 22,100, with the next key support placed around 21,950. A sustained move above 22,400 would be required to ease the immediate downside pressure and improve the short-term outlook.
Disclaimer : https://t.co/L8bjGLxMEQ
FIIs remained net sellers in the cash market on October 7, offloading equities worth ₹6,121 crore. The cumulative outflow over the last nine trading sessions now stands at ₹57,469 crore.
Meanwhile, the FII long-short ratio in index futures improved to 9.15% on October 7 from 8.55% on October 6. However, the ratio has largely remained within the 8–9.15% range over the last six trading sessions, indicating that significant short covering is yet to emerge.
After marking a low of 22,217, the benchmark Nifty staged a pullback of more than 550 points. However, the recovery lacked sustainability, with the index resuming its downward trajectory on Wednesday.
Technically, Nifty continues to trade below its key moving averages, indicating that the broader trend remains weak. That said, the gap between the 20-day EMA and the closing price has narrowed considerably, suggesting some mean reversion following the recent sharp correction. Momentum indicators and oscillators continue to reflect bearish undertones, while the daily RSI remains in the super-bearish zone under the RSI range-shift framework.
Going forward, the 22,460–22,440 zone could act as immediate support. A decisive break below this zone could revive selling pressure and trigger further correction towards 22,300. On the upside, 22,730–22,750 remains an immediate hurdle. A sustained move above this zone could extend the pullback rally towards 22,900.
Disclaimer: https://t.co/L8bjGLxMEQ