🔥"COMMODITIES RELATIVE TO M2 ARE AT HISTORIC LOWS"
Next time someone tells you gold and silver are finished for 20 years, ask them if they have any idea what M2 is right now, then show them this chart:
He's right. I've been waiting decades for this final gold bull market. It's here. Wall Street can't see it because you can't see what you don't look for. 🙄
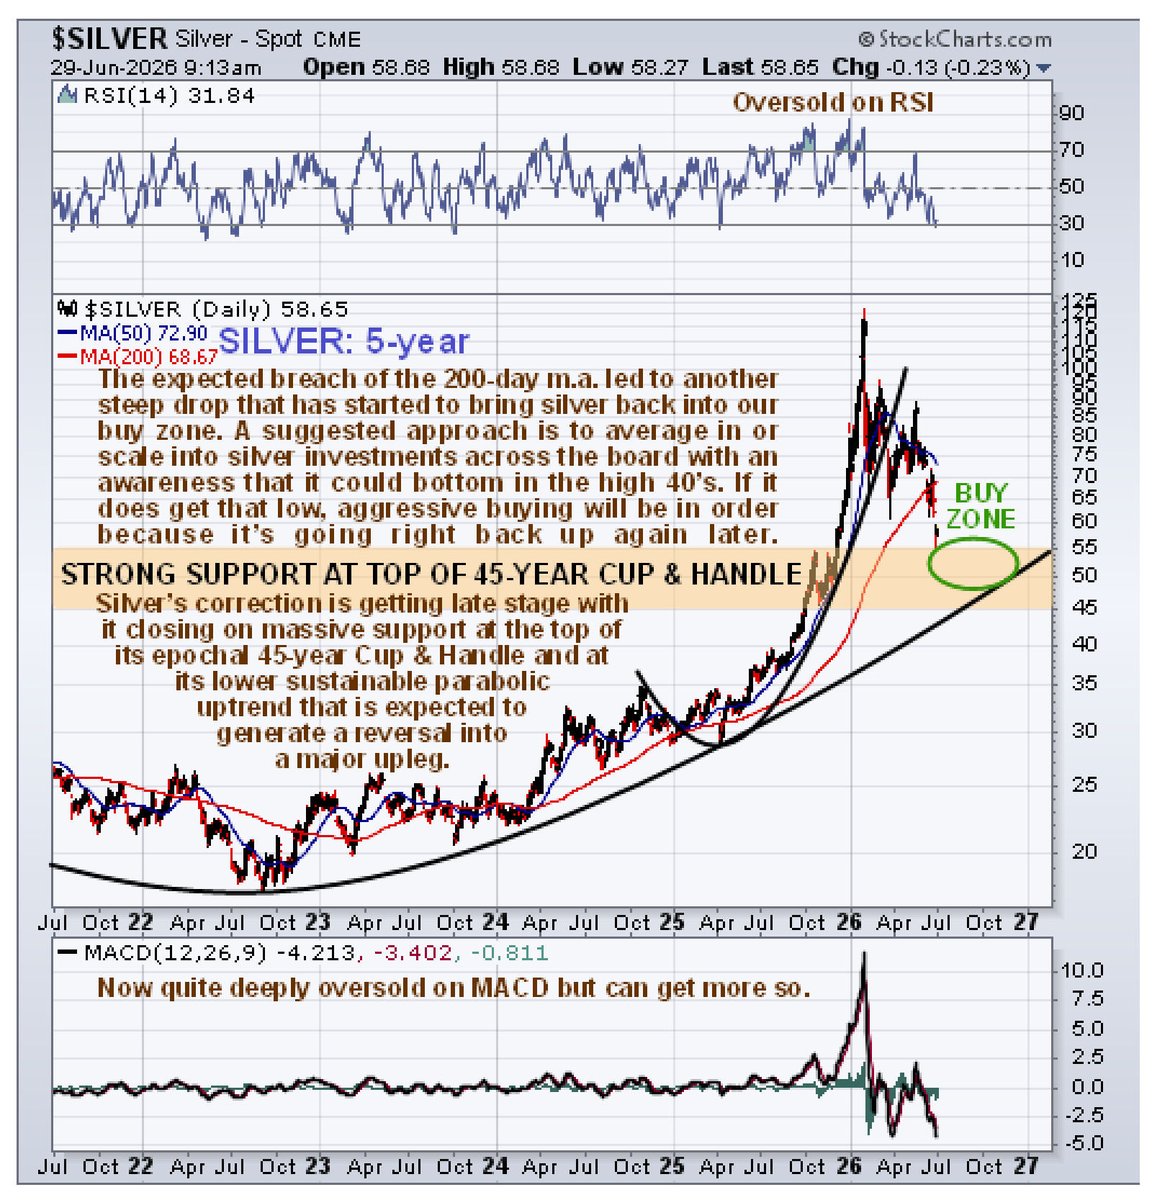
Silver - Wave iii ended at the 121.65 high and we are now falling in a multi-month wave iv correction that has the following retracement level:
61.8% = 57.32.
Within wave iv, we cannot rule the possibly that all of wave iv is now complete at the 55.62 low, and that we have started to rally higher in wave v of 3.
The other option is that wave 3 is extending and that only wave i of 3 ended at the 121.56 high and that wave ii likely ended at the 55.62 low.
This would suggest that silver is heading well above the $300 level in wave iii of 3. ~ Captain Ewave
What do you mean silver and crude oil aren't gonna go up much higher?
While it might not feel like this right now, $800+ silver and $400+ oil are my longer term price targets.
The Reval God candle that never happened!
It is what fantasists, dopamine hungry impatient 'crypto traders', now in PM's whine for.
You are not in Gold & Silver for a once off shot at a gifted 'lottery ticket', a 'hail mary' home run out of the blue.
You are in Gold and silver for a mathematical certainty over time.
Given to you inch by inch, hard fought most of the time, maybe with occasional windfall surge moments, as sporadic bonus's.
But the road to $20K+ is made up primarily in singles not one home run.
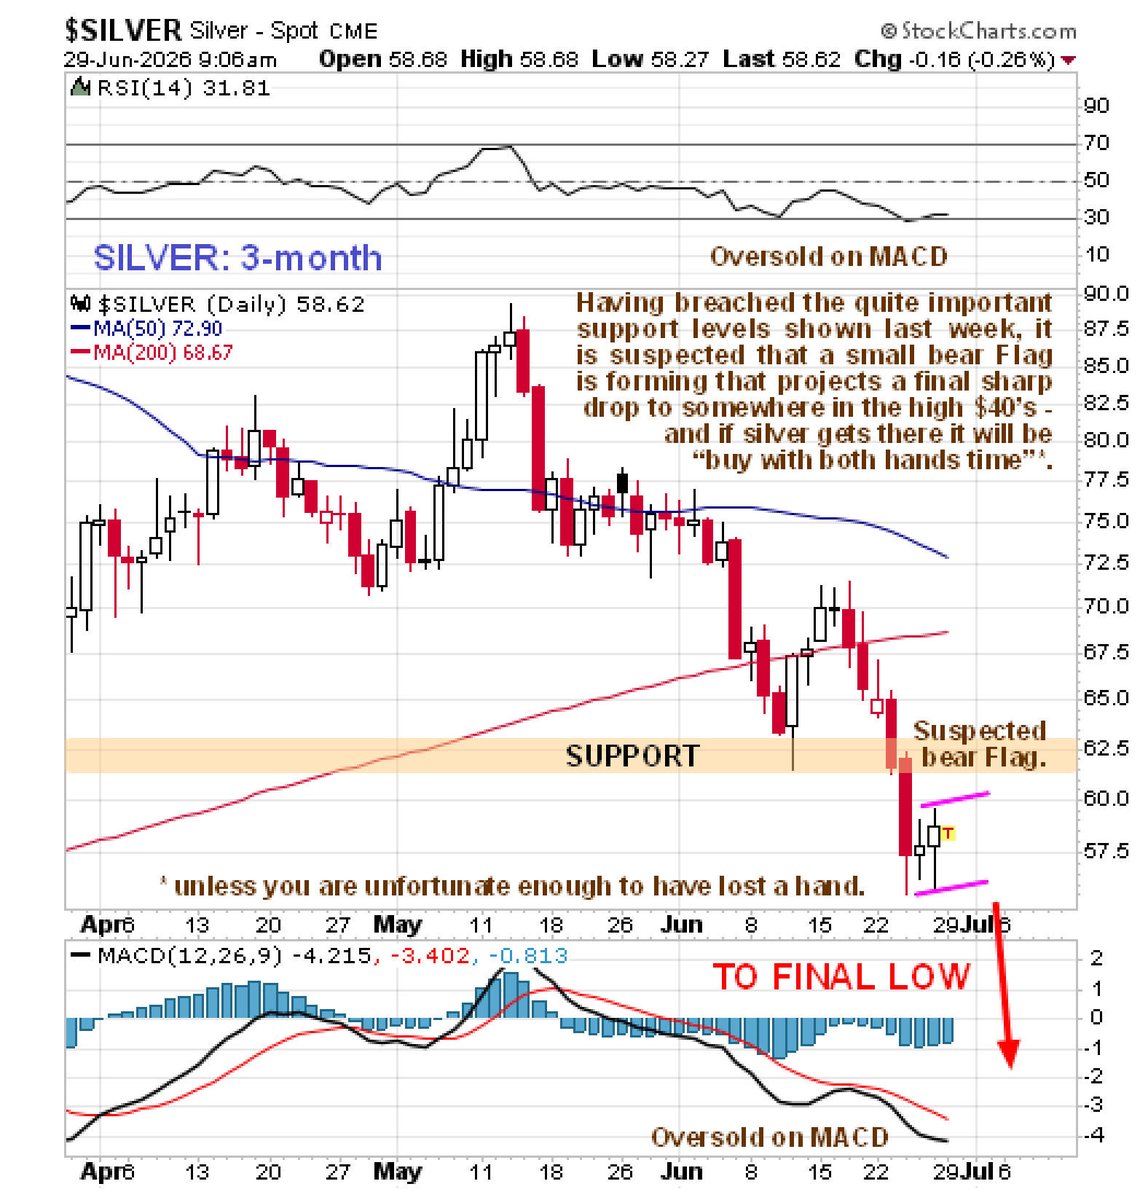
Silver is starting to test 50-day resistance extending from May 13th. Once silver regains this resistance, the immediate target comes at $71 price level...
The Dow/Gold Ratio in all its splendor. The Capital Rotation thesis only needs reconsidering if it punches upwards through the red circle. If not, it's a glorious era for gold & friends 👇
Silver is about to breakout from a 50-day bullish descending channel. I believe, upon breakout, silver is going to pause around $70 - 75 level before reaching $90 - 96 target possible by early to mid August...
$SLV
$SLV continues to consolidate within a falling wedge, with last week's inside range candle reflecting growing indecision as both buyers and sellers pause near a potential inflection point.
While a falling wedge is typically a bullish reversal pattern, the current technical picture has not yet confirmed that outcome.
The MACD continues to expand to the downside, indicating that bearish momentum is still increasing, and price remains below the 50 EMA, suggesting sellers continue to control the intermediate trend.
From a psychological perspective, bulls are attempting to defend the wedge but have yet to demonstrate the conviction needed to reverse sentiment.
For the technical outlook to shift, buyers need to confirm a bullish pivot by closing above the highs of the previous two candles following last weeks inside range candle. That would not only signal a successful candlestick reversal, but also reclaim the 50 EMA and likely trigger a breakout above falling wedge resistance, increasing the probability of a trend reversal.
Until that confirmation arrives, patience remains the higher-probability approach for long-term investors looking at weekly long term timeframe rather than anticipating a breakout before price proves it.
The better you understand price action and market psychology, the more confident and consistent your trading becomes. At https://t.co/DPsk9vzJGc, we provide the education, daily technical analysis, real-time insights, and supportive community to help you sharpen that edge.
$SLV $SIL $SILJ $AG $PAAS $WPM $HL $FSM $MAG $EXK $CDE $SSRM #SILVER
The above ground global platinum supply available for use is 2.0-2.5 million ounces. The deficit production in 2025 was approaching 1 million ounces and 2026 is still deeply in deficit production (almost 300K ounces ytd).
That is my answer to those who keep asking, "Are you still bullish platinum?"
This gold bull market is unprecedented
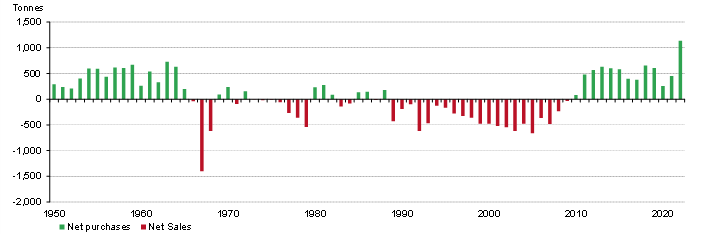
In the last gold bull cycles, central banks were net sellers
- 1970s: Central banks net sold ~1000t
- 2000s: They net sold ~3500t
Now they are net buying 800-1000t annually... a key headwind has flipped into a massive tailwind
Yield curve control is coming.
This is one of two root drivers for the secular bull market in precious metals.
As Jeff Gundlach and Felix Zulauf argue, the fiscal math and rising interest expense virtually guarantee a long-term period of negative real yields. Long rates must remain below inflation to keep the system from breaking.
The second root driver hasn't even manifested yet. When the secular bull market in stocks ends, investors will reallocate out of financial assets and into hard assets. Recall 1968-1982 and 2000-2011.
The secular bull market is in its infancy as neither driver has transpired yet.
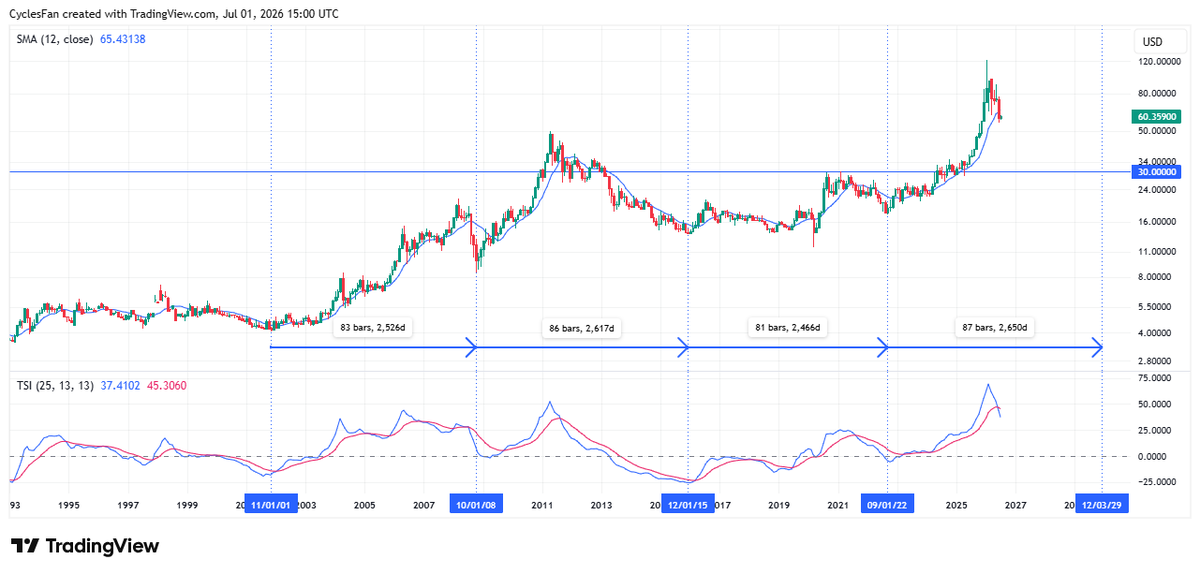
$Silver - We just had a monthly close below the 12 month MA which confirmed that the January high was the 7 year cycle high. Silver is now in a confirmed bear market. The timeframe for the next 7 year cycle low is September 2029-September 2030. The downside target by then is $30.
Eventually, silver will do a crazy rally.
But unfortunately, it is not likely that will be the move that leads immediately to $250 and above.
It should need much longer time to the grind sideways or down before the final, true breakout.
How's your patience?
How many times do I have to tell you? It's not about silver. It's about gold. Guess what? Gold's going higher. That's all you need to know about the silver price. 😉