Swing Trading 101 by Inveskia.
(including Multi-Bagger screening, no paid subscriptions or software required.)
Explained: Stock Scanning (using free sources) and Watchlist creation, Entry-Exit rules and Trailing rules.
Who we are?
We are a bunch (exactly-6) of passionate people striving towards financial freedom.
What we do?
Some of us are Ex-Bankers, Coders and Engineers. Half of us are full time traders (from 2019) and others are following the path of side hustle.
Let’s get back to our topic: SWING TRADING.
We have been formulating our own strategies strongly influenced by Qullamaggie (QM). @Qullamaggie
You can follow his work here: https://t.co/C8ckZa7qFc
What you’ll notice with time is that the patterns formed by any stock/commodity/crypto-currency or even real estate (you need to visualize) are same.
Whether it was 1900s in US or 2024 in India/US or the upcoming 2047 in India.
And the pattern we are talking about is like stair steps. Very well explained by QM in this link under the heading BREAKOUTS:
https://t.co/uZqVPhsJrJ
The beauty of this method is that you will catch all the runners and multi-baggers, for reference naming few from the past 5 years we studied:
Tanla
Adani Group
Ion Exchange
Deepak Nitrite
Neuland Pharma
Happiest Minds
CDSL
And many more….
The pattern covers all the current existing theories of IPO Breakouts, Breakouts in general, Multi-Bagger scanners.
Now we will deep down into what has been written by QM on his website (link already mentioned).
First Para:
“I have made tens of millions the past few years trading 3 simple, timeless setups.
These setups occured last year, 10 years ago, 50 years ago and 100+ years ago. They occur over and over again.
They occur in the Japanese market, they occur in the Swedish market, they occur in the Indian market.
The U.S. stock markets are the biggest and baddest of them all and therefore the best hunting grounds if you have a setup with an edge.” - Qullamaggie.
Our understanding:
QM made millions from 3 setups (we are focusing on the first one here).
He calls them timeless because they occurred last year, 10 years ago. 50 and 100+ years ago too.
In Indian context, you can go through charts of Nifty 50 stocks from 2000 to 2010. You will find the same.
Any stock that gave 100/200/1000 % returns have to go through this. Recent examples of the same are:
IRFC
Anand Rathi
Force Motors
Tata Motors
Even the most talked about trade of Exide Industries in F&O segment.
Second Para:
“Before I go into detail about where to buy, lock in profits, position sizing and stopping out of a losing trade, I want to talk a little about position sizing and risk.
I don’t believe you should ever have more than 30% of your account over night in any stock or ETF. Intraday you can do more since you don’t have to deal with potential over night gaps.
Most of my positions are 10-20% of account size.
My risk on most trades is usually 0.25-1%. I rarely risk more than 1% of my account on any trade.
When my accounts were small, less than a few million, I risked more, maybe 0.5-1.5%.
At the very beginning I risked more still, but honestly I had not a great grasp of the concept risk and position sizing in the beginning.
Okay, let’s get to the setups!” – Qullamaggie.
Our understanding:
Try not to put more than 10% of your capital in 1 trade.
Don’t risk more than 0.5% of your capital in 1 trade.
You can risk more when you are profitable, can use profit cushion.
Third Para:
“If you study thousands of the biggest winning stocks over the past 100 years they tend to move in stair steps.
Meaning they will make a 20-50%+ move, pull back and go sideways for a while, then make another move.
This is how most leading stocks act.
This pattern is something we as traders can use to our advantage, to get an edge.
How to find these setups?
Scan for the 1 or 2% of stocks that are up the most over these 3 timeframes:
1-month
3-month
6-month
This is how you find the stocks that are leading right now.” - Qullamaggie.
Our understanding:
The stock you are going to trade must have a past-recent move of 30%+, the bigger past move the better.
You can scan stocks that are up most in:
5 Days
1 Month
3 Months
6 Months
For this, we use this website (Super useful):
https://t.co/FUCTKFDldl
Fourth Para:
"A big move higher sometime in the past 1-3 months. This move can be anywhere from 30-100%+ and usually lasts a few days to a few weeks.
An orderly pullback and consolidation with higher lows and tightening range in the consolidation phase.
A range expansion (breakout) out of that consolidation.
The consolidation phase is usually 2 weeks to 2 months.
During the consolidation the stock price “surfs” the rising 10- and 20-day and sometimes the 50-day moving average." - Qullamaggie.
Our Understanding:
Scan for strong past move of 30% +.
You will easily understand pullback, consolidation, higher lows, range tightening and expansion with examples. Go through our recent tweets from 01 April 2024. You will easily get 10+ stocks to understand the given concepts. If any doubts, feel free to ask.
Fifth Para:
Identify the setups. You need to have a watchlist ready before the market open. You should also probably have alerts set, and know how many shares you want to buy.
Enter on the opening range highs. The opening range highs can be the highs of the first 1-minute candle, the 5-minute candle or the 60-minute candle (on the 60-minute timeframe the first candle is always only 30 minutes, 9.30-10 AM). You can use whatever timeframe or a combination of them. You don’t even have to use any intraday chart, just look at the daily chart and enter when the stock is starting to break out.
This method can also be traded by anticipating the breakout but I don’t find it as effective and more skill and experience is needed.
Stop is always lows of the day and stop should not be wider than the ATR or ADR of the stock, to prevent the risk/reward mechanics getting out of whack. So, if the ADR of the stock is 5%, your stop shouldn’t be wider than 5%. If the ATR if 50c, then stop should not be wider than 50c.
You should sell 1/3 to 1/2 of the position after 3-5 days, and then move the stop to break even. The rest of the position should be trailed with the 10- or the 20-day moving average. Depends on how fast the stock is. If a beginner stick to the 10-day. You wait for the first CLOSE below the 10- day.
- Qullamaggie.
Our understanding:
Create a watchlist and set alerts.
Entry Rules:
Entry based on opening range breakout. We usually Buy above the highs of 5-minute candle at 9:20. If the stock is showing great strength, we also buy above highs of first 1-minute candle at 9:16.
ADR and ATR are available on Trading view. If you don’t want to use that, you can take basic idea about what is the average movement of that particular stock in last 5/7 days in absolute and percentage terms. Try to have stop loss lesser than that value, you can ignore the trade if the stop loss is bigger than that range.
The stop loss is Day-Low. The sweet spot in Indian Markets is 1/3% and max 5% (rare cases).
Selling Rules:
Suppose you have 100 shares on Day 1 (Monday). Sell at-least 33 on 3rd day (Wednesday) and sell total of 50 shares (remaining 17) by 5th day (Friday). Keep the remaining 50 shares at breakeven from 3rd day and trail using 10 (Simple Moving Average) and exit when the first candle closes below 10 MA.
We sell 33% of the quantity and 50% in total by day 5thbased upon the first 5-minute candle of the day. If the low breaks, we sell it and doesn’t wait for End of the Day.
Sixth Para:
“There are variations of this setup but the premise stays the same.
I am a swing trader and use the daily chart to find these setups, but this setups also works on the weekly chart and the intraday (1- and 5-minute) charts.
On the intraday timeframe this setup is called Holy Grail by some on the daily it can be called a hight tight flags sometimes. It’s pretty much flat channels, symmertrical and descending triangles.”
- Qullamaggie.
Our understanding:
There are variations which you can understand from this video of QM:
https://t.co/Jq27RTJlhO
For multi-baggers, the pattern is same, just the time frame can be bigger like weekly or monthly.
For Intraday,
The pattern has been used wonderfully by :
2023 US Investing Championship Winner, Mr. Goverdhan Gajjala. @gov_gajjala
Here is his video related to his setups (Must Watch):
https://t.co/HlpADWP2aO
Our Take: One concept/pattern is all you need to achieve wonders.
@Guru_Grammer Only few apartments are directly on route of Old Gurgaon metro if we exclude Dwarka Expressway. Only notable one is Godrej Habitat in sector 3.
@Guru_Grammer Not calling Pataudi a part of Gurgaon, but same concept is there. A direct 18km road from Dwarka Expressway is about to open in a year. Prices still around 9000 psf
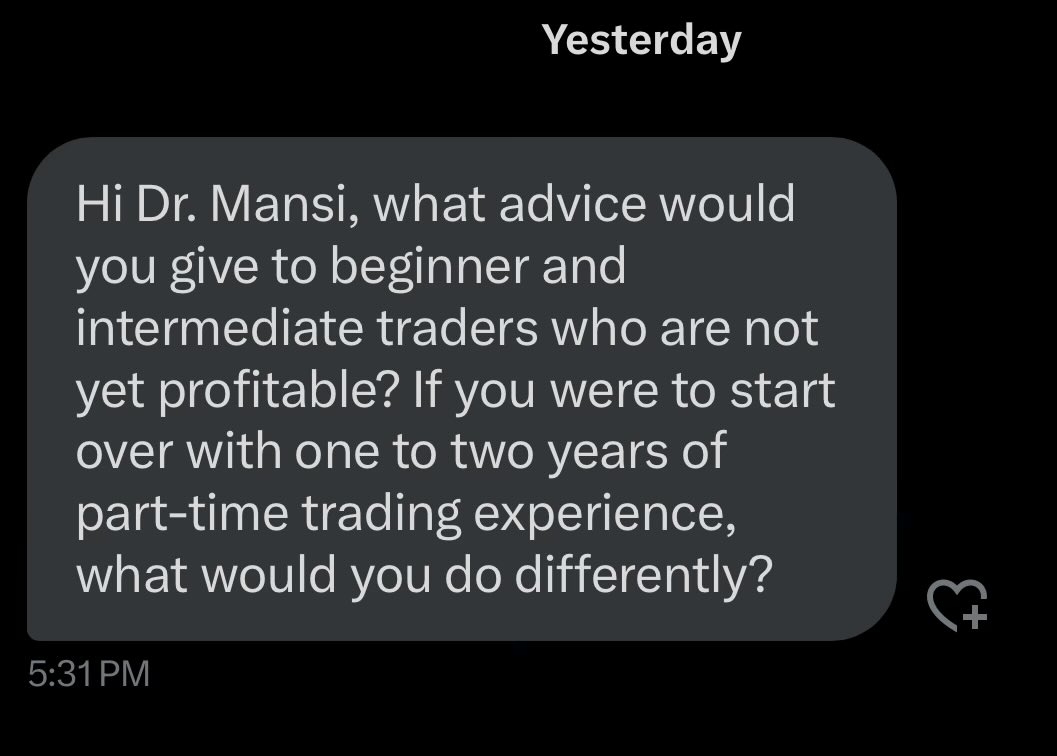
Got this great question in my DM:
If I had to start trading today I would do it completely differently. I would go through everything put out by @Qullamaggie (streams, his website, interviews) and follow his advice carefully I.e. do the deep dive to learn how stocks really move.