Data Visualization Consultant & Competence Center Lead Tableau @ Sopra Steria 🇧🇪 | #TableauNext 2023 | Big #Tableau enthusiast and love talking data viz 📊
➡️https://t.co/QKSoCok2BY
🚨#TableauNext 2023 is here🚨
Check out the work and follow the 55 people (from 22 countries and five continents) who were nominated by the community and not yet recognized as an Ambassador or a Visionary by Tableau.
Tags in comments. #DataFam
With being pregnant comes.. great opportunities for visualizations! 🤰This column chart captures the excitement of our family, friends, and colleagues as they place their bets on whether the tiniest VIP will be a boy or a girl!
Check it out: https://t.co/QJy6V6JWdl
#datafam It has been a long time since I posted something but I'm back! For our own internal #ironviz competition I used the #MakeoverMonday dataset to visualize what % of Britons think kidult hobbies and practices are for children.
Check it out: https://t.co/bNsn4davVr!
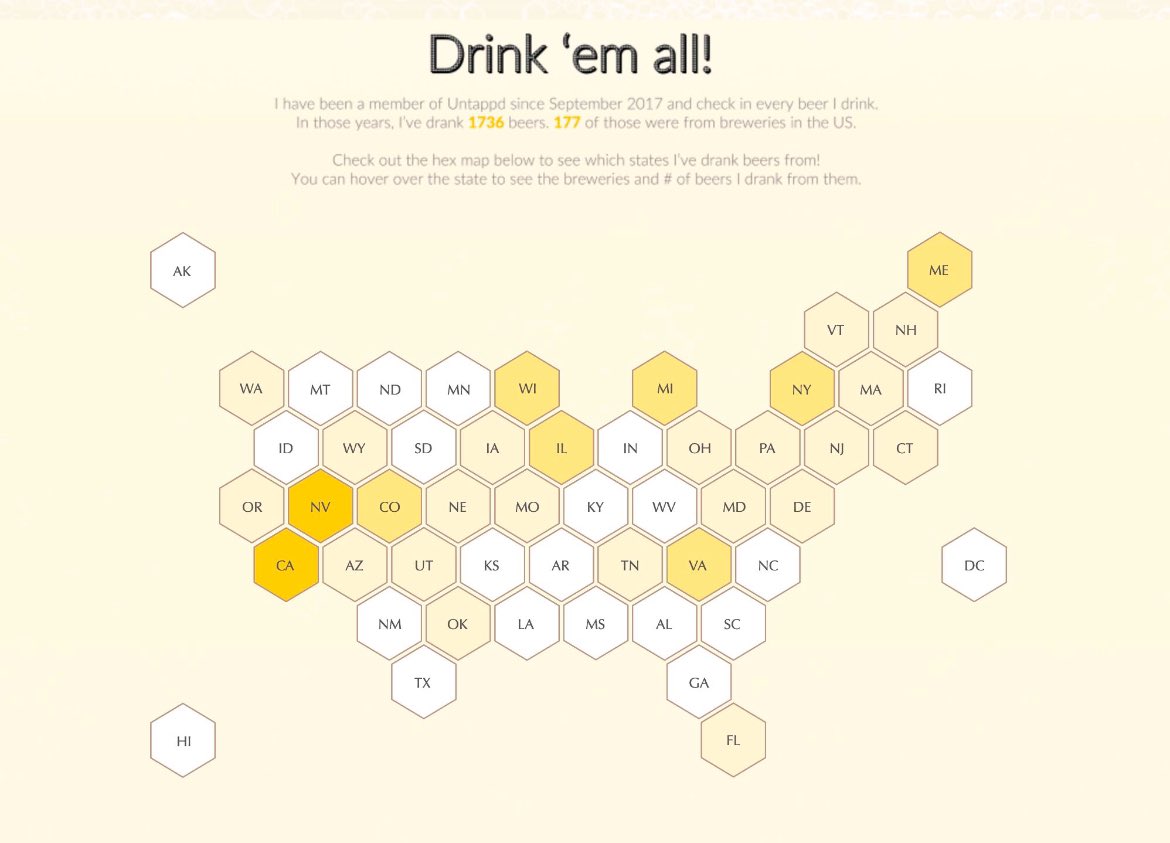
We've done another Iron Viz competition at #SopraSteria! 🤩
I'm pleased to say that I won with my hexagon map in the Most Creative Visual category! 🏆 Check it out here: https://t.co/sXvWJmKqHi
#Datafam#Tableau
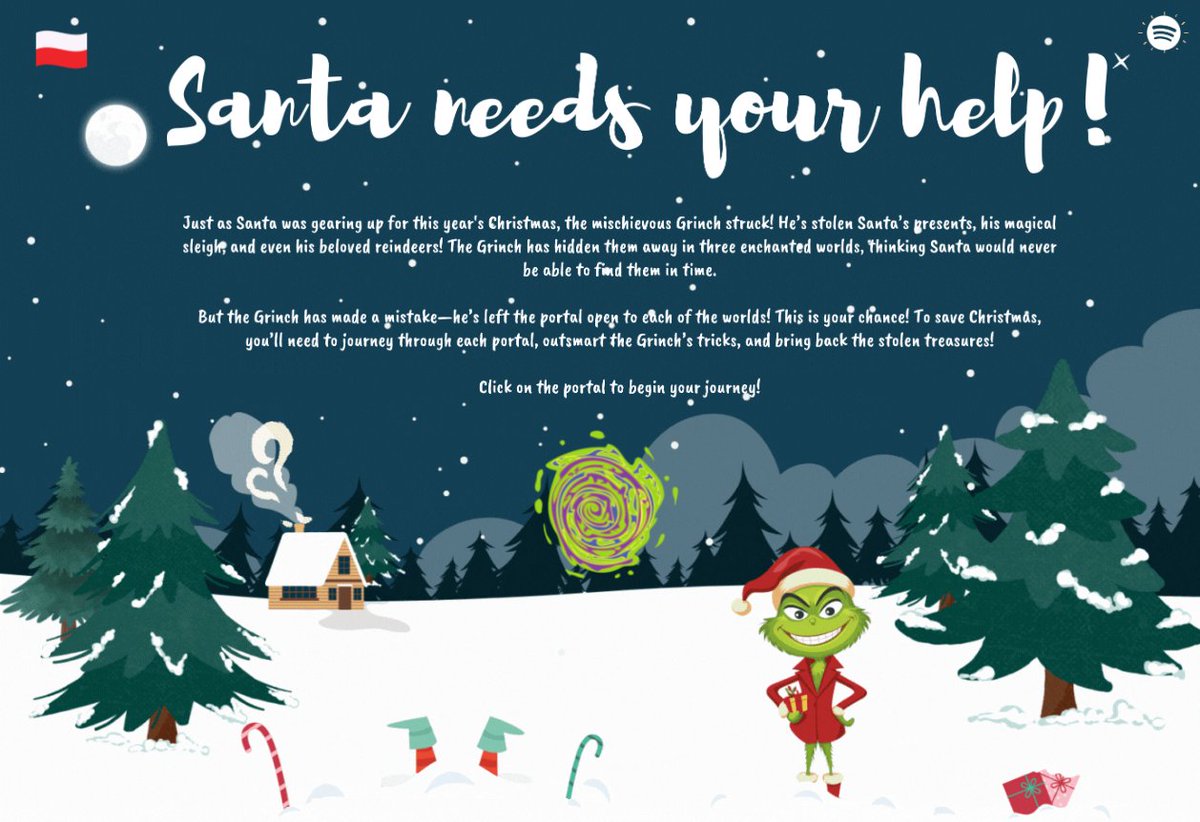
As a person who loves Tableau, games and Christmas, I couldn't pass on the opportunity to combine them into one project.
Xmas escape room - Can you help Santa save Christmas this year?
Want to give it a go? here's the link. Hope you enjoy it!
https://t.co/mYrHsVAXB2
I recreated 4 dashboards with inspirations coming from the ongoing Lagos Tableau User Group bootcamp week 1-3.
Learnt a few tableau tricks from all the sessions all through
Link to dashboards:
https://t.co/GqAbdaJSbn
#LagosTUG#tableau#dashboard
#Datafam This week I got to be a guest on CJ's blog. Learn how to scrape ball-by-ball data from ESPNCricinfo🏏 and get to know a bit more about my career in data thus far and how sports analytics has played a pivotal role in it.
#sportsanalytics#sports#data#cricketdata
🚨 Hi #datafam! Feel like I haven't vizzed in forever, so I'm excited to share a new dashboard about the speaking time of the 6 main characters on the TV show Friends!
📊 Check out the viz on Tableau Public: https://t.co/QMqRhhmzK9
#tableau#tableaupublic
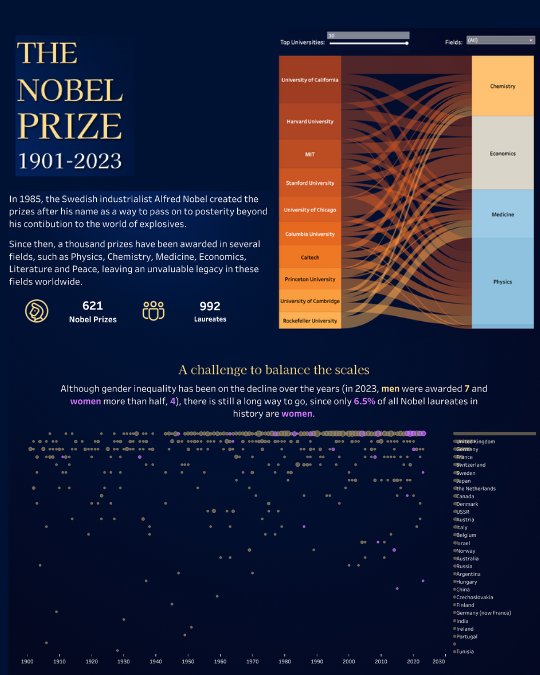
A century of achievements visualized. This #VizOfTheDay by Neoris Spain features a sankey diagram visualizing Nobel Laureates by university, country, and category.
Explore each winner's impact and the gender gap: https://t.co/mjWHjPWQD0
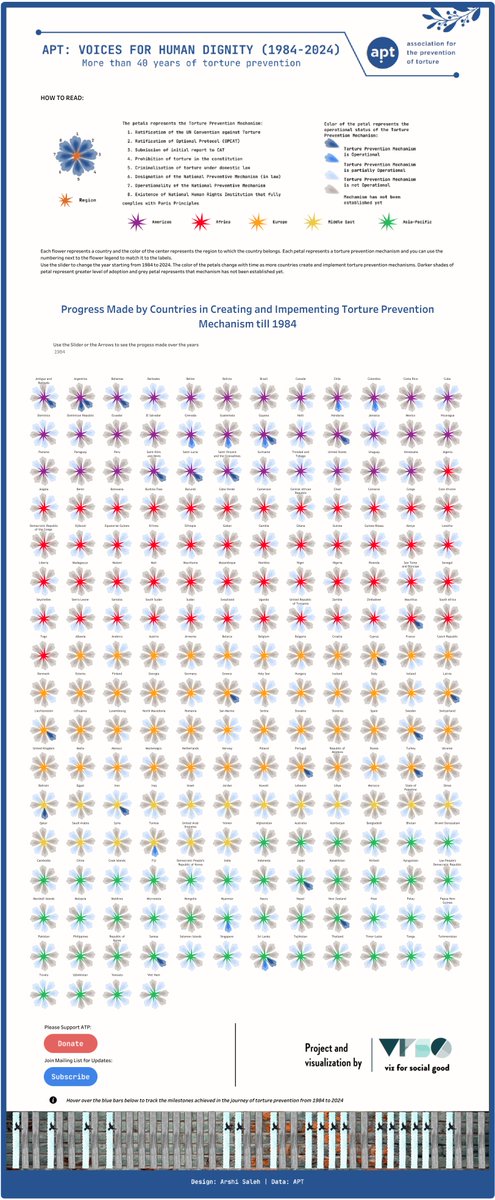
Hello #datafam,
I am very excited to share my #VFSG submission for @APTGeneva. Thank you @VizFSG for this opportunity.
📊 Tableau Link: https://t.co/mxTe2xc9Sy
Looking forward to feedback! 😊 🙏
📅 Save the date, DataFam!
Qualifier entries for the 2025 #IronViz—the world's ultimate data viz competition—runs October 1-31.
Win or learn, you can't lose! Give a ❤️ if you plan to participate this year and grow your data skills!
https://t.co/vYl6qL0VfU
Explore the TV genres that soar.
See trends over time in this #VizOfTheDay by Tableau Public Ambassador @ryandsoares.
This #DataPlusTV viz is inspired by fellow Tableau Public Ambassador @boknowsdata.
https://t.co/RulCgKKqQl
Our @figma to @tableau plugin has crossed 10.000 views and 5.000 users 🎉
The plugin is the best and fastest way to create dashboards for @tableau 🚀
We recently added features to handle absolute position and mixed styles texts export and well continue to improve it!
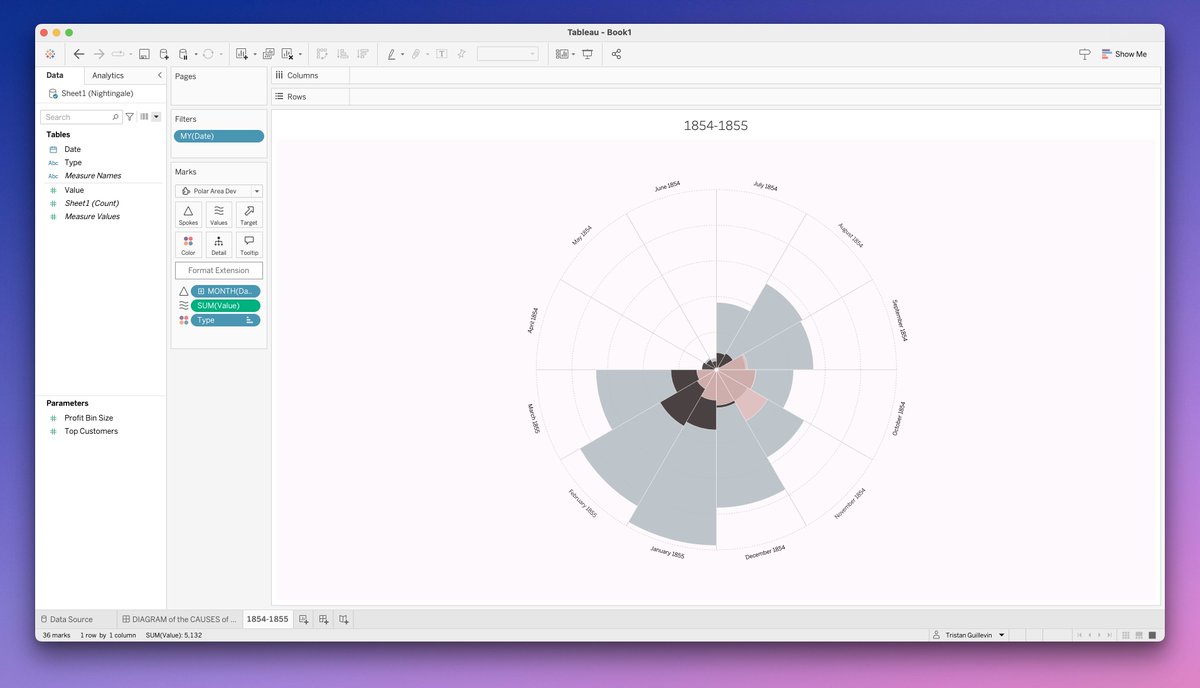
Florence Nightingale’s famous chart, recreated in @tableau with just 3 drag-and-drops using Viz Extensions!
No complex calculations, no data densification, no templates, no external sites.
Please @tableau, let us use Viz Extension them on @tableaupublic !
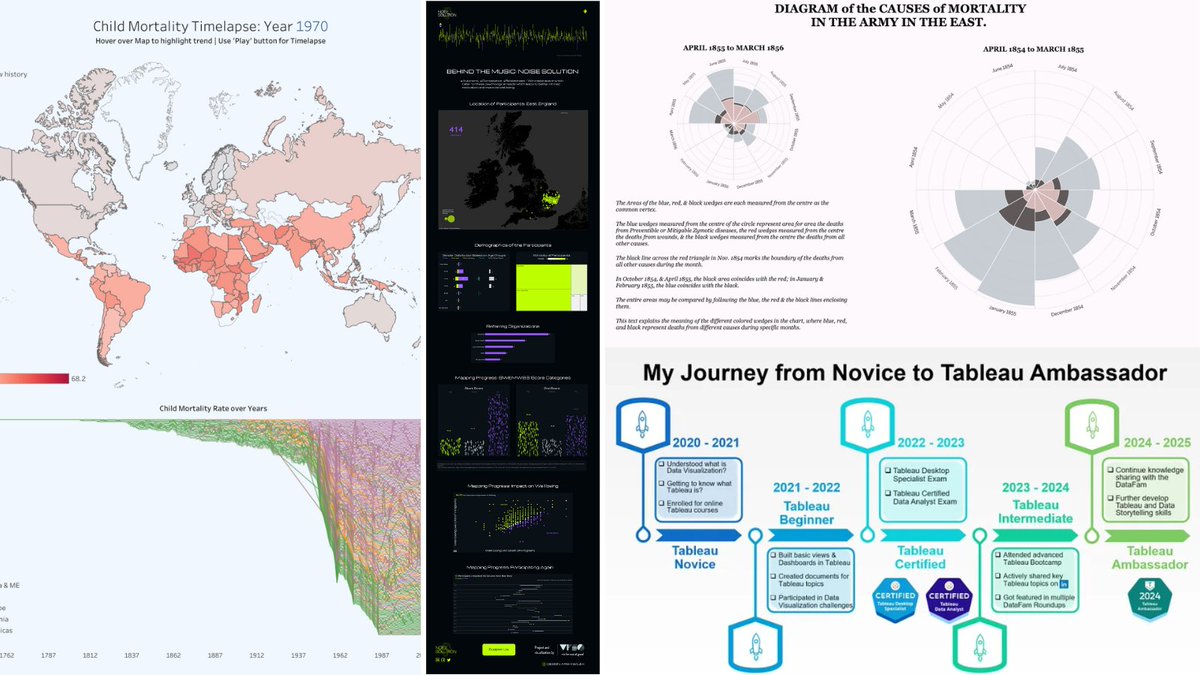
Tableau Community content together, all in one place.
Learn new data skills and get inspired by the latest visualizations in this week's #DataFam Roundup.
https://t.co/GZ1QBqPM9Y
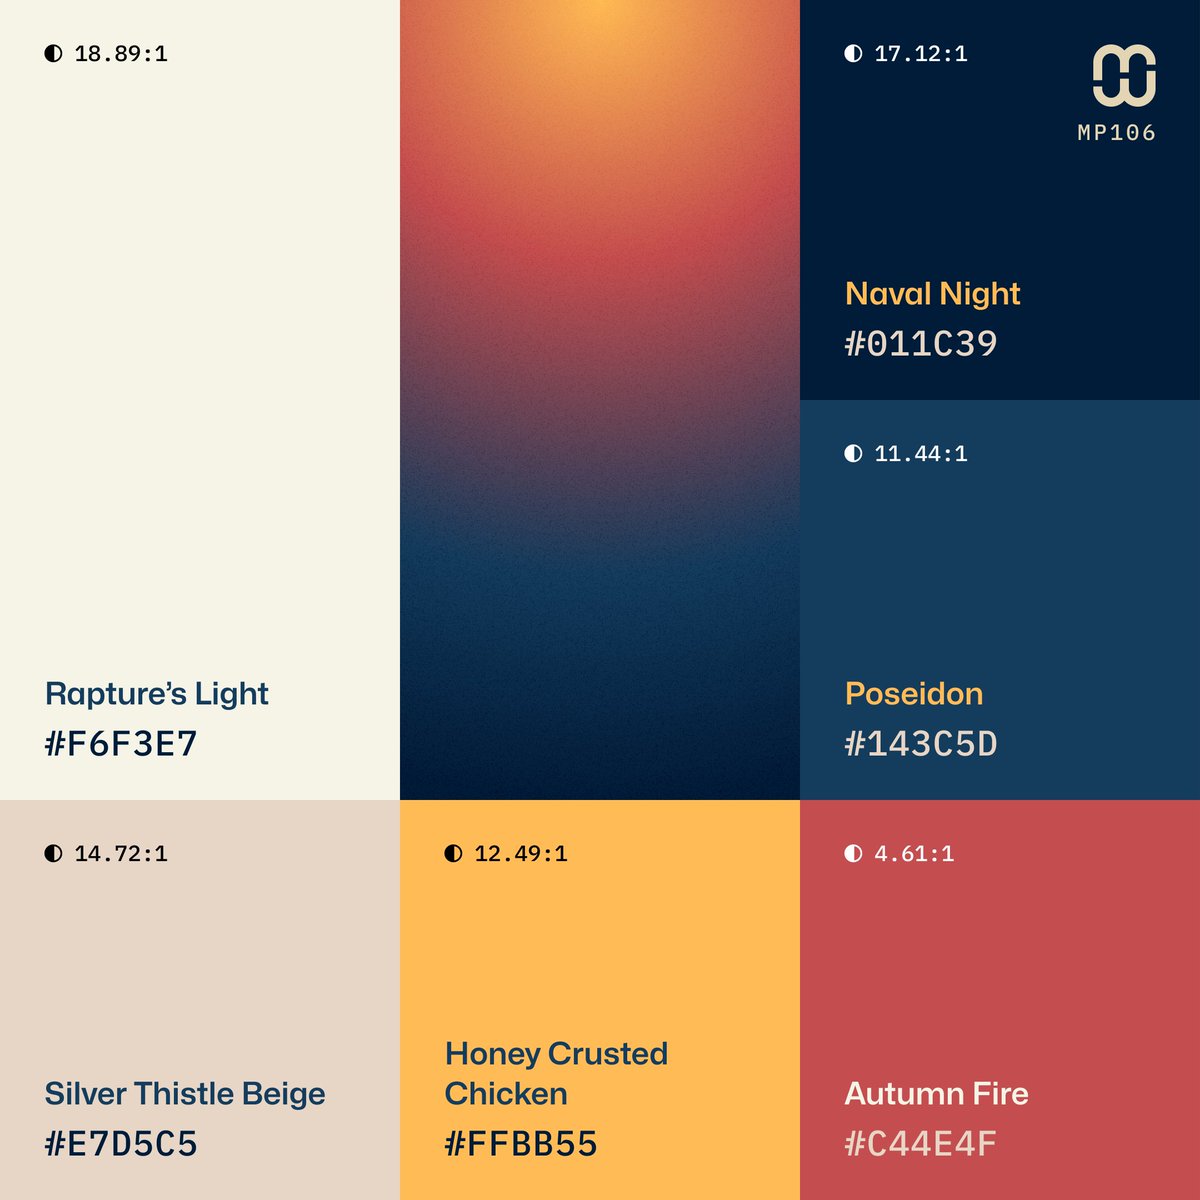
🆕 New color palette – #MindfulPalettes № 106 contrasts warm hues with deep navy blues in a cozy autumnal setting. It's a perfect fit for #branding projects, particularly with a rustic-theme.
And check out that stunning #gradient!
❤️ Hit the "Like" button for a colorful day!