One hour until the September Community Call - you don’t want to miss this one!
Strong month for Nosana, plenty of product updates to walk through, plus a little something new for the community 👀
📆 September 30th, 4PM CET
See you very soon: https://t.co/teTj3H10Ph
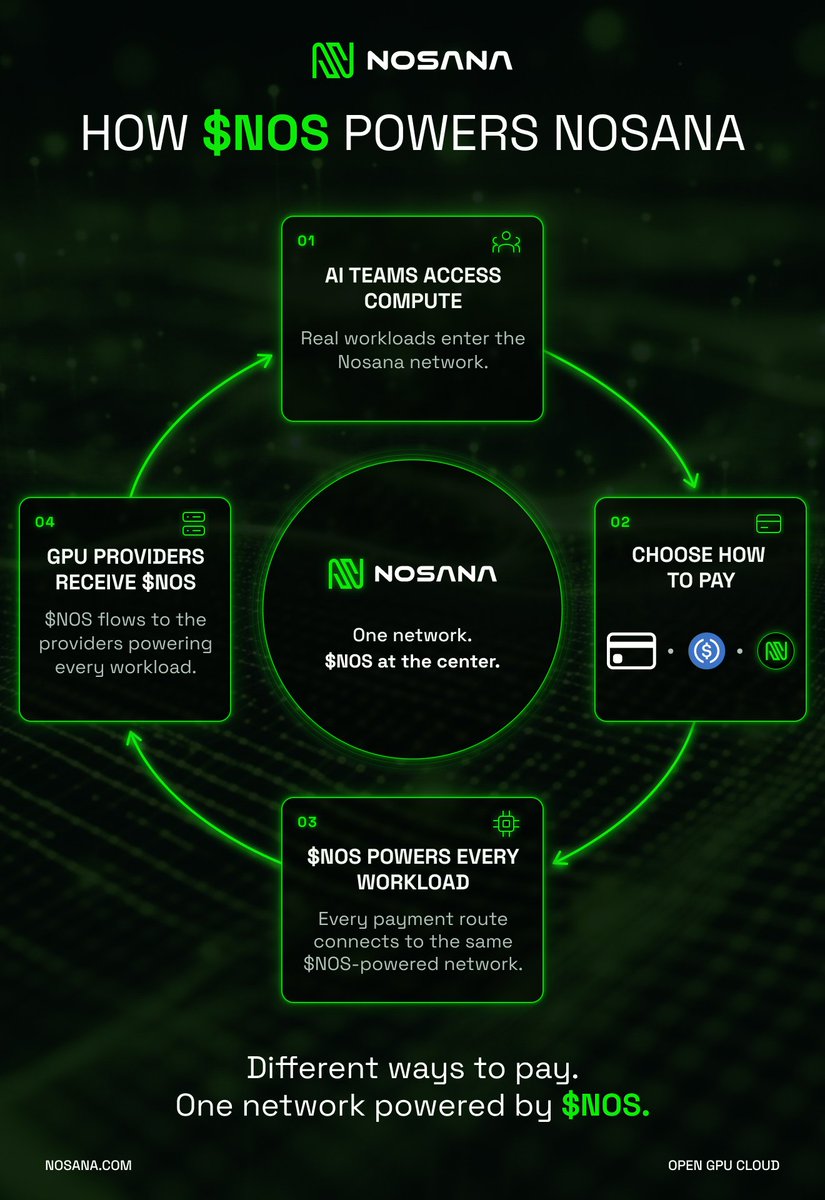
Did you know $NOS sits at the heart of the Nosana ecosystem?
As AI teams bring workloads to the network and GPU providers power them, $NOS works in the background to coordinate incentives across both sides of the network, helping the whole ecosystem move as one.
Explore the role of $NOS: https://t.co/PLqpjr3KWR
Our full conversation with Mert
0:00 Tech vs sentiment
3:42 SOL's monetary glow up
11:30 His top bags
21:15 Crypto is a game
26:11 Global Silicon Valley
37:05 SOL vs Hyperliquid
44:24 AI x crypto
54:50 Advice for entrepreneurs
1:11:32 The privacy case
1:23:15 Stocks
I built my own charting platform with Claude Fable, and it does a few things Tradingview straight up can't..
I call it EchoCharts..
so what it basically does is
1) Echoes:
this is the big one. it takes the exact shape price action is forming right now them scans thousands of past candles, and finds every time the market looked just like this before.
then it shows you what happened next. it'll tell you something like "20 matches, 30% closed higher 24 bars later, median -0.05%", and it draws those past paths forward on the chart so you see the full spread.
2) Sketch search:
draw any shape with your mouse, and it finds where price actually did that in real history, then jumps you straight to it.
great for the patterns you can feel but can't name.
3) Market clock:
A 24-hour dial showing when this market actually moves. volatility, direction and volume, split by hour of the day and day of the week.
so you stop trading dead hours and start trading when it counts.
plus the basics done clean, candles, volume, a moving average, and RSI.
So how it basically works is,
it all runs on real binance data, 6,000 live candles..
Echoes matches the shape of the move using correlation, not the price level, so a setup today of bitcoin:native at $63K can match one from years ago at $10K
and it only ever looks at fully finished history, it never peeks at the future, so the "what happened next" numbers stay honest.
Now, Here’s how i built it:
i described what i wanted and claude fable built it.
plain javascript, the lightweight-charts library for the chart, around 700 lines, no framework. static site, opens in any browser.
one thing i'll be straight about, echoes shows you what happened after similar setups in the past. that's history, not a prediction.
it shows you the lay of the land, it doesn't call the future.
might open-source the whole thing soon.
ALTSEASON STARTS NEXT MONTH
There was never a 4-year cycle, and there will never be.
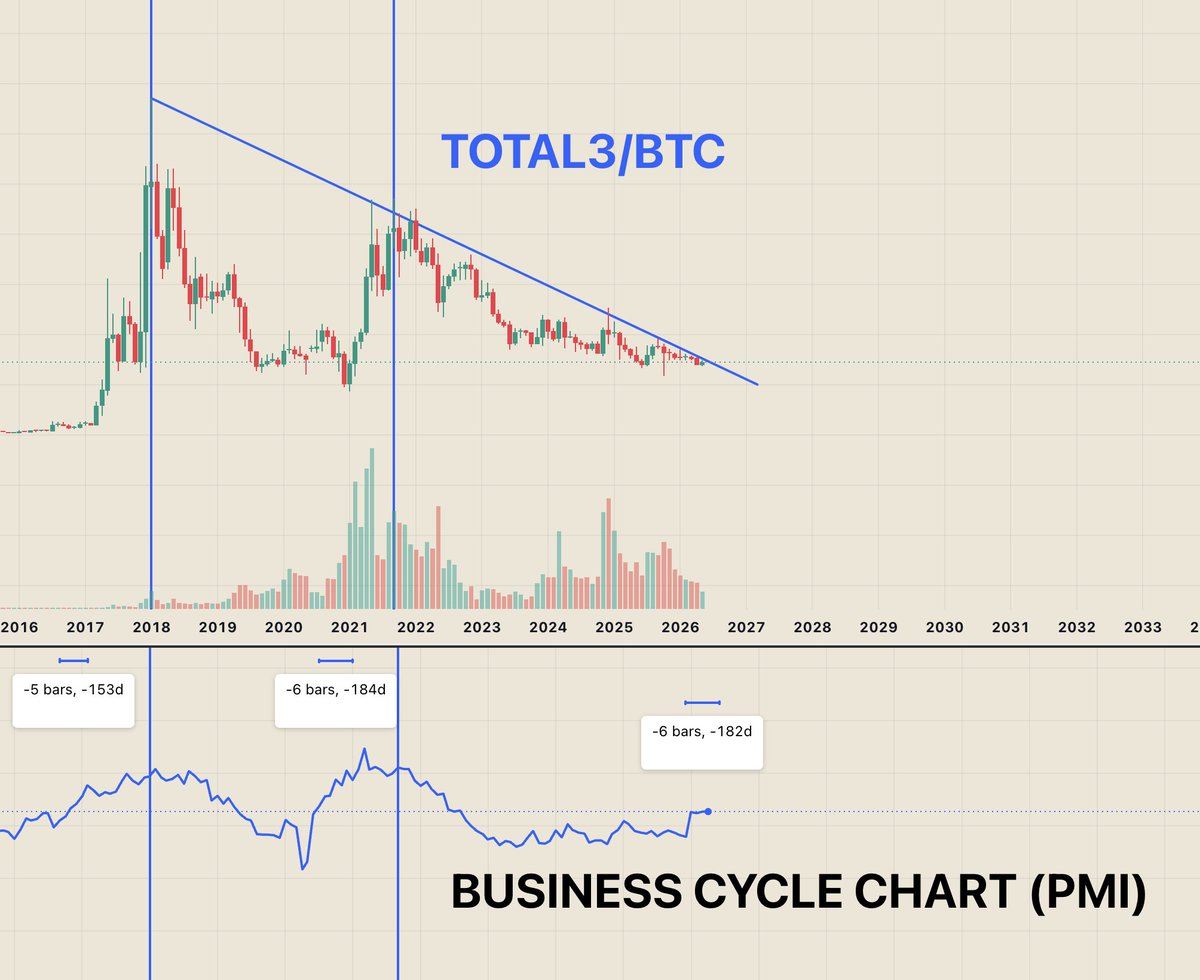
At the top, there is a chart of altcoins to Bitcoin.
At the bottom, there is a chart of Business Cycle (PMI).
We can vividly see following 2017 & 2021 altseasons alts were lagging by 5-6 months before expansion after initial Business Cycle chart expansion.
It happens to be now we're exactly at month 6 after initial obvious Business Cycle expansion.
On top of that, this time we have 10 year resistance we should be breaking out from next month for alts.
On top of that, basis for the current Business Cycle is much larger than basis to the previous ones (3.5 years vs 2), which should provide us with much bigger altseason.
Alts will actually go to new ATHs.
The bulk of the move starts to happen from June 2026, the top will be in Oct 2027 (potentially even later as the basis is 1.5x larger, Oct 2027 would be a standard top).
The trick is those catching the bottom entries will feel the difference between 5x and 50x, 10x and 100x, 3x and 15x.
$BTC will go to $350k.
CANCER HAS BEEN CURED
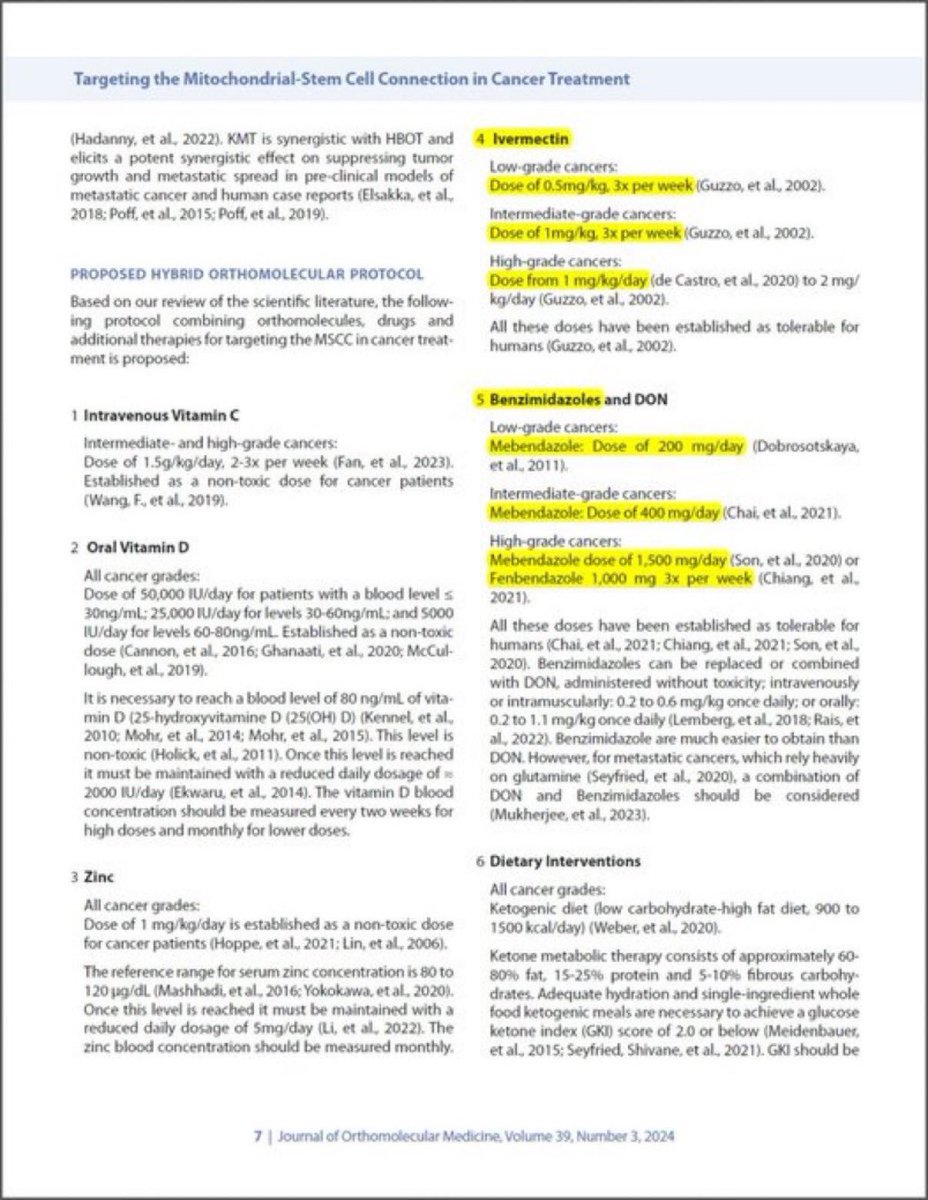
Ivermectin & Fenbendazole cure cancer.
Pass it on.
BREAKING NEWS: First-in-the-World Ivermectin, Mebendazole and Fenbendazole Protocol in Cancer has been peer-reviewed and published on Sep.19, 2024!
The future of Cancer Treatment starts NOW.
My thanks to lead authors Ilyes Baghli and Pierrick Martinez for their incredible inspired work, FLCCC’s Dr.Paul Marik for his extensive work on repurposed drugs and every co-author who worked hard to bring this paper to life.
I hope that this peer-reviewed paper lays the groundwork for a brand new future for Cancer Treatment.
Many of you know that I have been helping thousands of Cancer patients with high dose Ivermectin, Mebendazole, and Fenbendazole
Meet @SeekerClaw 🦞
- Run an AI agent on your Seeker in less than 1 minute
- Fully integrated with Solana and Jupiter
- Open source
Available now on the Solana dApp Store!
Great explanation of the ACCELERANT for the financial fire that raged on 10/10, but the answer is not limited to "marketing"
Generally speaking, the use of volatile collateral without "haircuts" is dangerous.
In every mature market, all assets pledged as collateral—other than those deemed "risk-free"—are credited with only a percentage of their value. This provides a buffer against value erosion, such as the inevitable USDe depeg.
It is also worth noting the "volatility" was almost certainly INTENTIONALLY triggered. I would suggest that your exchange, along with your major competitors COULD work together to prevent such damaging manipulative attacks.
The mechanism of the attack, which U.S. regulators have branded "momentum ignition," is well understood but difficult for a single exchange to detect. Generally speaking, it goes like this:
Step one: The perpetrators build up a LARGE long spot, short perp position in multiple assets simultaneously across multiple exchanges to disguise the positions. This can be built up over a long period of time to minimize slippage costs and maintain the hedge.
Step two: They wait for an illiquid period when the differential in order book density between perp and spot is at its highest.
Step three: They initiate a wave of programmatic sales of a large percentage of the spot position, using market orders. across the exchanges used for perp pricing simultaneously. (As selling overwhelms the bid side, each subsequent order has greater price impact. Executing within seconds prevents liquidity from refreshing.)
Step four: They place bids to close out the short perp position below the falling market (and well below the average sale price of the spot).
Step five: They continue selling spot to maximize price impact until complete. This triggers liquidations on the perp exchanges, helping close out the short perp position via the placed bids.
Step six: Once spot sales are complete and perp shorts are covered, they go long, knowing the cascade is likely over.
Step seven: They close out the long perp positions at a quick profit from anticipating the V-shaped recovery.
While 10/10 was far worse and more widespread than previous episodes—due to the USDe collateral issue and resulting automated deleveraging—there have been many other examples of this strategy crashing spot markets over the past five years. Every time it happens, there is an impact on investor confidence & professionals complain about how such events could take place.
It is also interesting to note some historical context. This is not unique to crypto. In the early 1990s, the Japanese stock market was routinely subject to such attacks due to liquidity differences between stocks and futures. Regulators eventually took notice and made it clear that purposeful market impact when selling stocks was considered manipulation.
AI will make you jobless.
Crypto will make you not need a job.
Buy and hold now, retire in a few years. 🙋♂️if crypto allowed you to retire already.
(Not financial advice)
I posted this earlier in the week on @RealVision, but thought it was worth sharing here as well, just to give everyone something to think about.
If you step back and look at the data, something interesting is happening in markets right now…
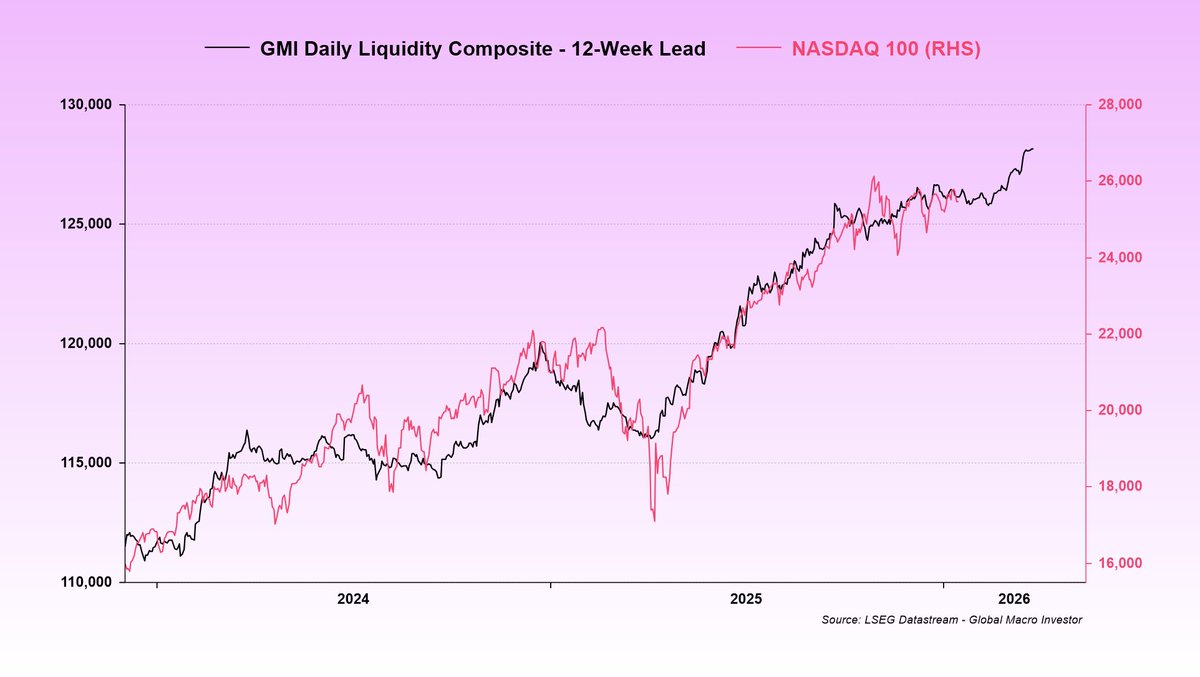
When you line up liquidity with equities, you get this (chart 1).
And then compare that with the same liquidity measure versus Bitcoin (chart 2), a simple truth emerges:
Both cannot be right...
Either equities are fundamentally mispricing liquidity despite trading near record highs, or Bitcoin is correctly signaling that the liquidity cycle has already peaked and that risk assets are about to roll over. Only one of these outcomes can ultimately be correct.
Now let’s separate data from opinion for a moment...
The data is clear:
Global liquidity has not yet peaked.
Now to my subjective view…
I think Bitcoin remains the outlier here, and that the events around 10/10 temporarily distorted price discovery, for reasons I’ve discussed at length previously.
Equities, credit, and broader risk assets are behaving exactly as you would expect in a rising liquidity regime. They’re hovering near all-time highs...
Bitcoin, by contrast, is pricing a liquidity peak that the data simply does not support at this stage.
At some point you have to step back and ask:
Is it more likely that one asset is right, or that every other BTC-correlated risk asset is wrong (chart 3)?
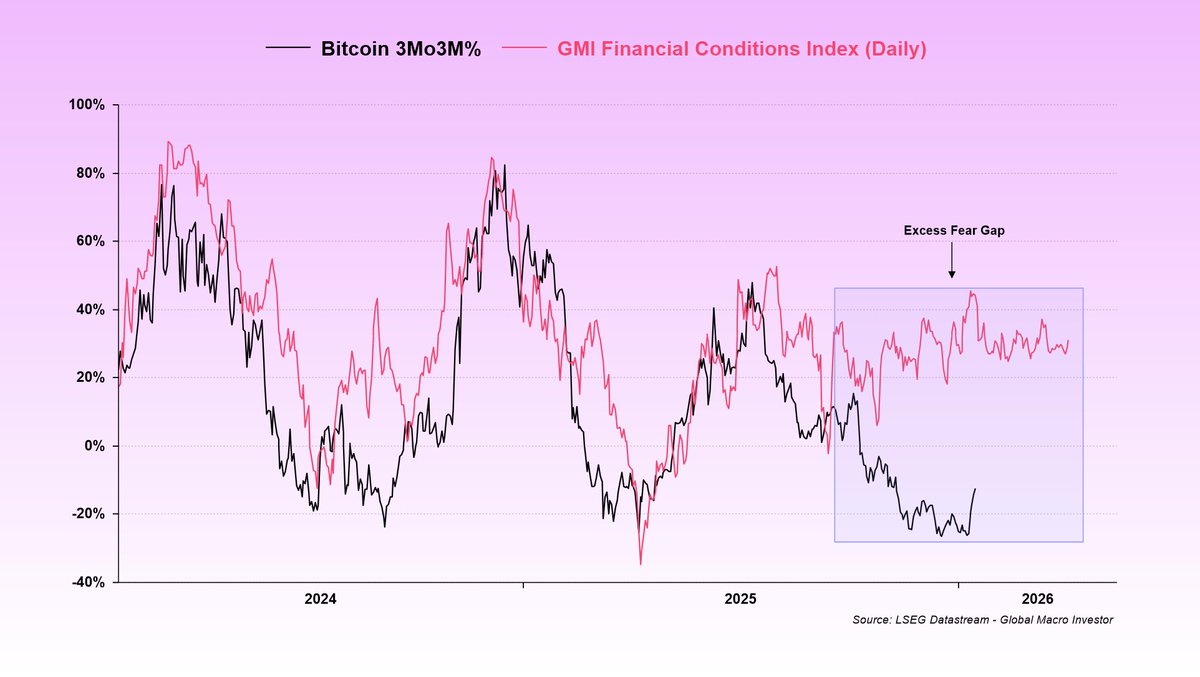
If you then layer in broader financial conditions, it stops being about opinion and becomes more about probabilities (chart 4).
What really stands out to me is the sheer magnitude of the “Excess Fear Gaps” that have opened up relative to the macro and liquidity fundamentals.
Right now, the weight of the evidence suggests liquidity is still rising and, in our view, will continue to rise, and that is what risk assets are reflecting.
That means Bitcoin is the anomaly.
What I’ve done here is present the data objectively and my view subjectively.
This is the battlefield for 2026.
The bull versus bear debate comes down to one thing and one thing only:
The direction of global liquidity...
Solana will trade like oil & gas until Wall Street values blockchains using fundamentals
Solana can become VERY profitable networks as finance moves onchain -- tokenization is projected to grow from $600B to $9T in 2030.
Here's a model I built out for Solana with key drivers:
- Asset Under Manage (~TVL) as a % of Tokenization
- Global Transfer Volume as a Velocity Multiple on AUM
- Revenue as a % of Global Transfer Volume
- Inflation Rate
If you believe $SOL will
1. Take 5% of Tokenization markets in 2030 in AUM
2. The amount of AUM that moves per year is 55.6x (1/3rd of what it is today)
3. Revenue take rate (base fees, priority fees, jito tips) is 40 bps
4. Inflation declines 15% annually
Its not crazy for Solana to be a $880B+ network in 2030.
DM if you want a copy of the model.