Major Wars & Their Triggers:
1. ⚔️ World War I — Assassination of Archduke Franz Ferdinand
2. ⚔️ World War II — Nazi Expansion & Invasion of Poland
3. ⚔️ Cold War — Ideological Conflict (USA vs USSR)
4. ⚔️ Vietnam War — Containment of Communism
5. ⚔️ Korean War — North vs South Korea Division
6. ⚔️ Gulf War (1991) — Iraq Invades Kuwait
7. ⚔️ Iraq War (2003) — Weapons of Mass Destruction Claims
8. ⚔️ Afghanistan War (2001) — 9/11 Attacks
9. ⚔️ Iran–Iraq War — Territorial & Political Rivalry
10. ⚔️ Arab–Israeli War (1948) — Creation of Israel
11. ⚔️ Six-Day War — Preemptive Israeli Strike
12. ⚔️ Yom Kippur War — Arab Coalition Offensive
13. ⚔️ Falklands War — Argentina Claims Falklands
14. ⚔️ Crimean War — Russia vs Ottoman Empire
15. ⚔️ Russo-Japanese War — Control of Manchuria & Korea
16. ⚔️ American Civil War — Slavery & States’ Rights
17. ⚔️ Spanish Civil War — Fascism vs Republicanism
18. ⚔️ Napoleonic Wars — French Expansion in Europe
19. ⚔️ Franco-Prussian War — German Unification
20. ⚔️ Opium Wars — Trade Disputes with China
21. ⚔️ Hundred Years’ War — England vs France Throne Claim
22. ⚔️ Peloponnesian War — Athens vs Sparta Rivalry
23. ⚔️ Punic Wars — Rome vs Carthage Power Struggle
24. ⚔️ Mongol Conquests — Expansion of Mongol Empire
25. ⚔️ Crusades — Religious Control of Holy Land
26. ⚔️ Indo–Pak War (1947) — Kashmir Conflict
27. ⚔️ Indo–Pak War (1971) — Bangladesh Liberation
28. ⚔️ Kargil War — Territorial Infiltration in Kashmir
29. ⚔️ China–India War (1962) — Border Dispute
30. ⚔️ Russia–Ukraine War — Territorial & Political Conflict
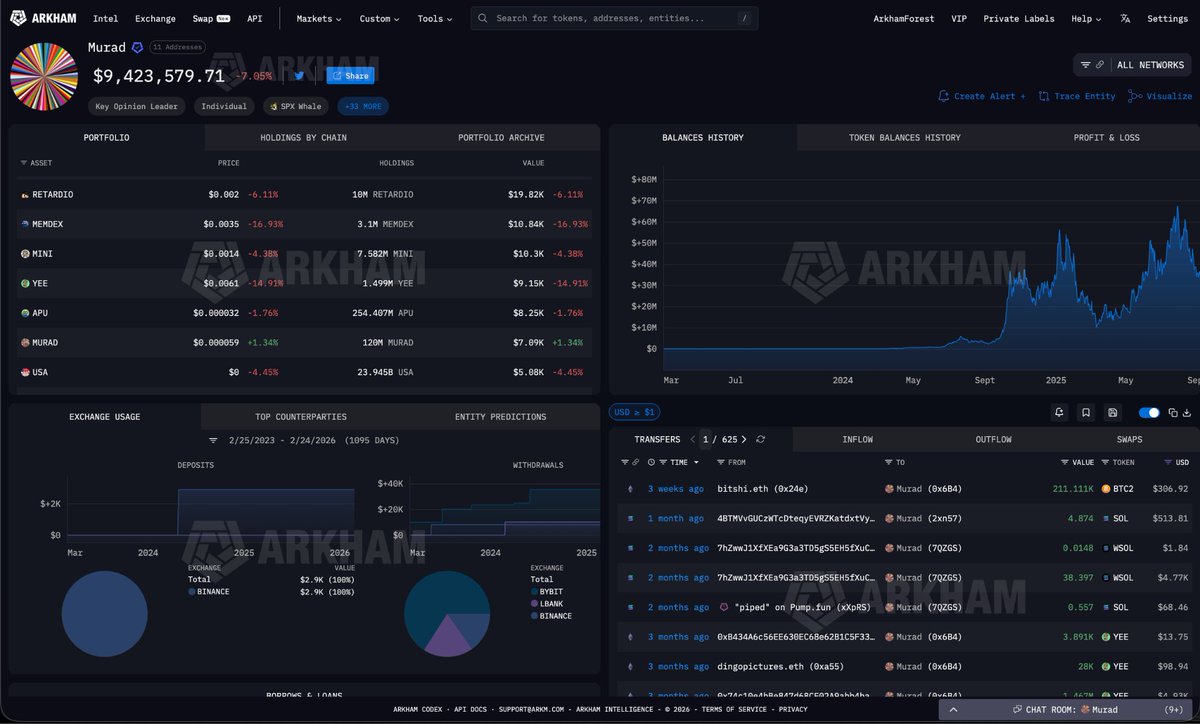
MURAD - DOWN BUT NOT OUT
Murad is down $57M (-86%) from his portfolio all time high, to $9.4M at current prices. But he's still holding ALL of his SPX6900, as well as the other 9 coins on his 2024 Memecoin Supercycle list.
Study conviction.
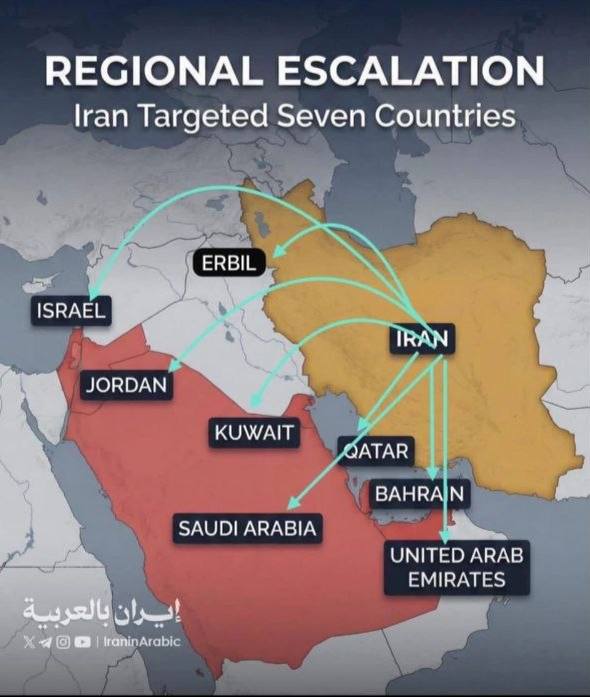
Iran is not Venezuela
The Iranian side announced two things:
1. The Iranian missile attack resulted in the deaths of approximately 200 American soldiers.
2. Iranian missiles destroyed an A/N FPS-132 Block 5 radar system, an advanced phased-array radar system deployed by US forces in Qatar. This radar has a detection range of 5,000 kilometers, and its primary mission is to provide early warning of ballistic missiles to the United States and Israel.
Didn't the kidnapping of Maduro without any casualties give Trump excessive confidence?
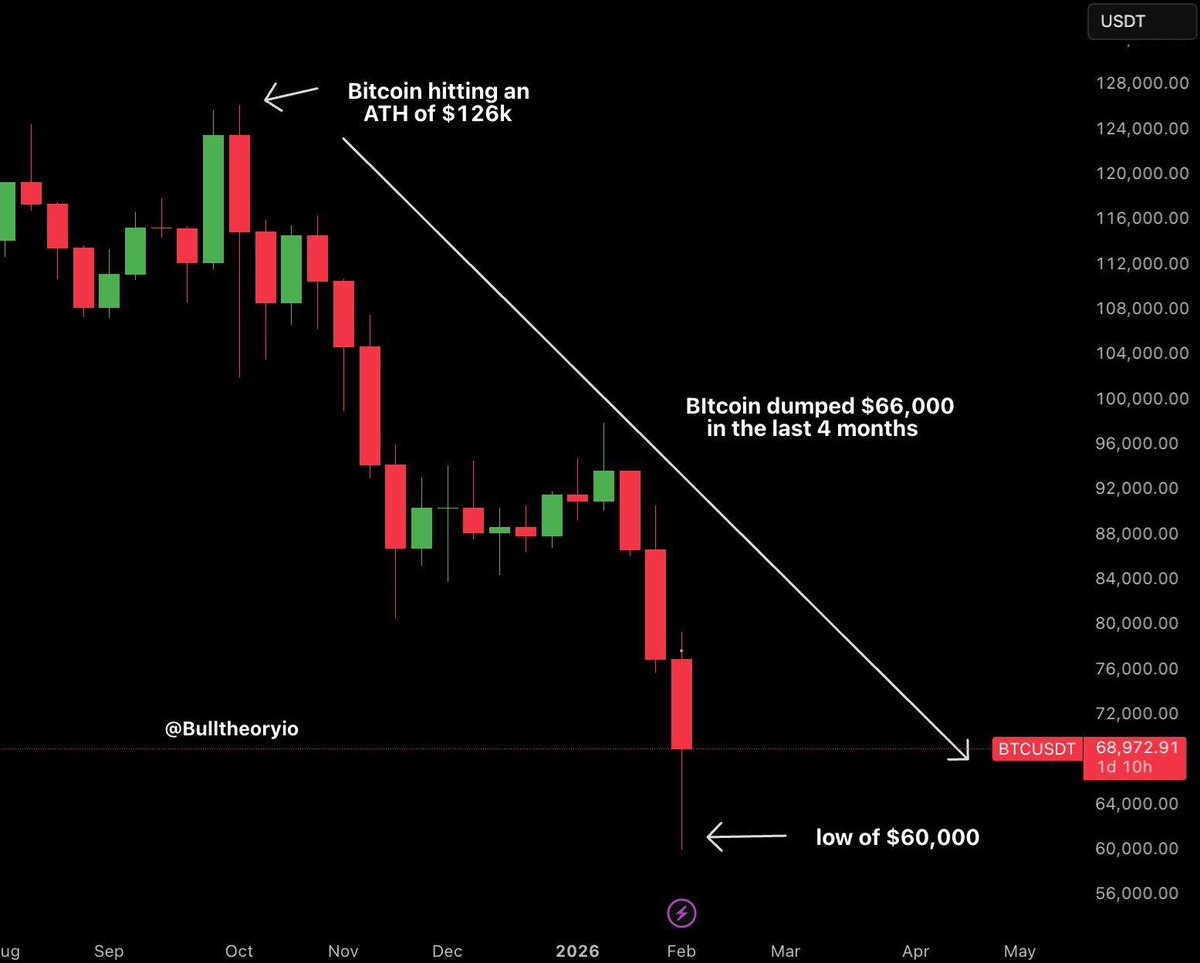
THIS IS WHY BITCOIN DUMPED NON STOP FROM $126,000 TO $60,000.
Bitcoin has now crashed -53% in just 120 days without any major negative news or event and this is not normal.
Macro pressure plays a role, but it’s not the main reason Bitcoin keeps dumping. The real driver is something much bigger that most people aren’t talking about yet.
Bitcoin’s original valuation model was built on the idea that supply is fixed at 21 million coins and that price moves based on real buying and selling of those coins. In the early cycles, this was mostly true. But today, that structure has changed.
A large share of Bitcoin trading activity now happens through synthetic markets rather than spot markets.
This includes:
• Futures contracts
• Perpetual swaps
• Options markets
• ETFs
• Prime broker lending
• Wrapped BTC
• Structured products
All of these allow exposure to Bitcoin’s price without requiring actual Bitcoin to move on chain. This changes how price is discovered because now selling pressure can come from derivative positioning rather than real holders selling coins.
For example:
If institutions open large short positions in futures markets, price can fall even if no spot Bitcoin is sold.
If leveraged long traders get liquidated, forced selling happens through derivatives, accelerating downside moves. This creates cascade effects where liquidations drive price, not spot supply.
That is why recent sell offs look very structured. You see long liquidation waves, funding flips negative, open interest collapses, all signs that derivatives positioning is driving the move.
So while Bitcoin’s hard cap has not changed, the effective tradable supply influencing price has expanded through synthetic exposure.
Price today reacts to leverage, hedging flows, and positioning, not just spot demand.
Adding to this, there are other factors too driving the current dump.
GLOBAL ASSET SELL-OFF
Right now, selling is not isolated to crypto. Stocks are declining. Gold and silver have seen volatility. Risk assets across markets are correcting.
When global markets move into risk-off mode, capital exits high-risk assets first and crypto sits at the far end of the risk curve. So Bitcoin reacts more aggressively to global sell offs.
MACRO UNCERTAINTY & GEOPOLITICAL RISK
Tensions around global conflicts, especially U.S.–Iran developments, are creating uncertainty.
Whenever geopolitical risk rises, supply chain risks increase, and markets shift toward defensive positioning. That environment is not supportive for risk assets.
FED LIQUIDITY EXPECTATIONS
Markets had been pricing a more dovish liquidity backdrop. But expectations around future policy leadership and liquidity stance have shifted.
If investors believe future Fed policy will be tighter on liquidity even if rates eventually fall, risk assets reprice lower.
ECONOMIC DATA WEAKNESS
Recent economic indicators job market trends, housing demand, credit stress are pointing toward slowing growth conditions. When recession fears rise, markets derisk.
Crypto, being the most volatile asset class, sees outsized downside during those transitions.
STRUCTURED SELLING VS CAPITULATION
Another important observation:
This sell off does not look like panic capitulation. It looks structured.
Consecutive red candles, controlled downside moves, and derivative driven liquidations suggest large entities reducing exposure, not retail panic selling.
When institutional positioning unwinds, it suppresses bounce attempts because dip buyers wait for stability before re-entering.
PUTTING IT ALL TOGETHER
It is a combination of:
• Derivatives driven price discovery
• Synthetic supply exposure
• Global risk-off flows
• Liquidity expectation shifts
• Geopolitical uncertainty
• Weak macro data
• Institutional positioning unwind
Until these pressures stabilize, relief rallies can happen, but sustained upside becomes harder.
🚨 BITCOIN MAX SUPPLY IS NO LONGER 21 MILLION NOW.
And this is what causing market's crash.
If you still think Bitcoin price is moving only because of spot buying and selling, you are missing the bigger picture. Bitcoin no longer trades purely as a supply demand asset.
That structure changed the moment large derivatives markets took control of price discovery.
And that shift is a big reason why price behavior feels disconnected from on chain fundamentals today.
Originally, Bitcoin’s valuation was built on two core ideas:
• Fixed supply of 21 million coins
• No ability to duplicate that supply
This made Bitcoin structurally scarce.
Price discovery was driven mostly by real buyers and sellers in the spot market.
But over time, a second layer formed on top of Bitcoin, a financial layer.
This layer includes:
• Cash settled futures
• Perp swaps and options
• Prime broker lending
• WBTC products
• Total return swaps
None of these create new BTC on chain. But they do create synthetic exposure to BTC price.
And that synthetic exposure plays a major role in how price is set. This is where the structure changes.
Once derivatives volume becomes larger than spot volume, price stops reacting mainly to real coin movement.
It starts reacting to positioning, leverage, and liquidation flows.
In simple terms:
Price moves based on how traders are positioned, not just on how many coins are being bought or sold physically.
There is also another layer to this, synthetic supply.
One real BTC can now be referenced or used across multiple financial products at the same time.
For example, the same coin can simultaneously support:
• An ETF share
• A futures position
• A perpetual swap hedge
• Options exposure
• A broker loan structure
• A structured product
This does not increase on chain supply. But it increases tradable exposure linked to that coin.
And that affects price discovery.
When synthetic exposure becomes large relative to real supply, scarcity weakens in market pricing terms.
This is often referred to as synthetic float expansion.
At that stage:
• Rallies get shorted through derivatives
• Leverage builds quickly
• Liquidations drive sharp moves
• Price becomes more volatile
This is not unique to Bitcoin. The same structural shift happened in: Gold, Silver, Oil, Equity indices.
Once derivatives markets became dominant, price discovery shifted away from physical supply alone.
This also explains why Bitcoin sometimes falls even when there's not much spot selling.
Because price pressure can come from:
• Leveraged long liquidations
• Futures short positioning
• Options hedging flows
• ETF arbitrage trades
Not just spot selling.
So the current Bitcoin decline cannot be understood only through retail sentiment or spot flows.
A large part of the move is happening in the derivatives layer, where leverage and positioning drive short term price action.
This does not mean Bitcoin’s supply cap changed on chain.
The 21 million limit still exists. But in financial markets, paper Bitcoin is now dominating and this is what's causing the crash.
🚨OVER $12 TRILLION WAS ERASED FROM GLOBAL MARKETS IN JUST 48 HOURS.
But why ?
This was not a normal volatility. This was a structural unwind across metals and equities happening at the same time.
First, look at the scale of the damage.
Precious metals collapse:
• Gold: −16.36%, wiping out $6.38 TRILLION
• Silver: −38.9%, wiping out $2.6 TRILLION
• Platinum: −29.5%, wiping out $235B
• Palladium: −25%, wiping out $110B
Equities:
• S&P 500: −1.88%, wiping out $1.3T
• Nasdaq: −3.15%, wiping out $1.38T
• Russell 2000: wiping out $100B
In total, well over $12 trillion vanished, which is more than the GDP of Germany, Japan, and India combined.
Here is what actually broke the market.
METALS WERE AT HISTORIC HIGHS
Silver had just printed 9 consecutive green monthly candles. That has never happened before.
The previous record was 8 green months, and that marked major cycle tops.
Silver had already delivered over a 3x return in 12 months. For a $5–$6 trillion asset, that is extreme.
At the peak, silver was up 65–70% YTD.
Gold was also deeply stretched after a parabolic run driven by easing expectations. At those levels, profit-taking was inevitable.
MOMENTUM PULLED IN LATE RETAIL AND LEVERAGE
The vertical rally sucked in a large wave of late buyers rotating out of crypto and equities. Most of this money did not go into physical metal.
It went into leveraged futures and paper contracts.
The dominant narrative was simple: Silver to $150–$200. That encouraged oversized long positions right at the top. When the price rolled over, liquidation started immediately.
LONG LIQUIDATION CASCADE TOOK OVER
Once silver dropped:
• Margin calls triggered
• Longs were forced out
• Price dropped more
• More liquidations followed
This is why silver collapsed over 35% in just 1 day. It was not sellers choosing to exit. It was forced selling.
PAPER MARKET STRESS VS PHYSICAL REALITY
The silver market is heavily paper-driven. Estimated paper-to-physical ratio: 300–350:1. That means hundreds of paper claims exist for every real ounce.
During the crash:
• COMEX silver fell sharply
• Physical markets stayed elevated
At one point, US silver was trading at $85–$90, and Shanghai silver was trading at $136. That gap exposed stress between paper pricing and real demand.
Paper markets unwind fast. Physical markets move slower.
MARGIN HIKES POURED FUEL ON THE FIRE
As prices were already falling, exchanges raised margins aggressively.
Effective Feb 2, 2026:
• Silver: 11% to 15%
• Platinum: 12% to 15%
Then a second hike in just 3 days:
• Gold futures: +33%
• Silver futures: +36%
• Platinum: +25%
• Palladium: +14%
Margin hikes force traders to post more collateral immediately. In a falling market, this means automatic liquidations. That is why the move felt violent and one-directional.
FED CHAIR CLARITY REMOVED A KEY BULLISH PILLAR
For months, markets were positioned around uncertainty over who would lead the Fed.
That uncertainty supported gold and silver, since hard assets tend to benefit when policy direction is unclear.
When Kevin Warsh’s probability of becoming Fed Chair surged, that uncertainty trade ended.
Warsh is not a new name. He served on the Fed during the 2008 crisis and has a long record criticizing aggressive QE, excess liquidity, and prolonged balance sheet expansion.
Markets had been priced for a more extreme outcome: fast rate cuts plus heavy liquidity injections.
Warsh getting nominated signaled rate cuts with balance sheet discipline.
That shift removed a major support for gold and silver and triggered capital outflows.
On its own, this would not have caused a crash, but combined with extreme leverage and crowded positioning, it accelerated.
This was not a demand collapse. This was:
• Historic overextension
• Extreme leverage
• Crowded positioning
• Forced liquidations
• Margin hikes
• And a sudden policy narrative shift
WHY SILVER IS EXPLODING LIKE NEVER SEEN BEFORE IN HISTORY ?
Silver just hit $120, up 450% in the last 2 years, adding over $6 trillion to its market cap and became the BEST performing assets in the world.
The main reason for this INSANE rally is supply chain + paper market problem happening at the same time.
Here’s what’s actually driving it:
1. THE MARKET HAS BEEN IN A REAL SUPPLY DEFICIT FOR YEARS
This is not a one month shortage.Over the last 5 years, the world has used more silver than it produced.
Total deficit: 678 million ounces.
That is almost one full year of global mine production missing from the system. So silver was already in shortage before the price started moving fast.
2. CHINA TURNED SILVER INTO A STRATEGIC EXPORT
China does not only mine silver. China controls a large part of the world’s refined silver supply. Recently, China tightened exports using licensing and restrictions. This means fewer silver bars are allowed to leave the country.
That directly reduces the amount of silver available for the rest of the world.
You can already see this in prices. Shanghai silver is trading near $127, much higher than global markets.
That premium exists because physical silver inside China is becoming harder to get.
When China slows exports:
• Other countries have to fight harder for limited supply
• Physical premiums rise quickly
• Factories pay higher prices to avoid production delays
3. INDUSTRIAL DEMAND IS GROWING RAPIDLY
Silver is not only a store of value. It is a critical industrial metal. Two major demand drivers are:
A) Solar demand
Solar panels need silver to conduct electricity inside each panel. Every panel uses silver in its internal wiring. As more countries build solar power plants, silver demand rises. Global solar silver demand is expected to grow from about. 200 million ounces per year to around 450 million ounces per year by 2030.
That alone can consume a very large part of global supply.
B) Data centers, AI, and electrification
More data centers are being built. Power grids are being upgraded. Electronics production is increasing. Silver is used because it carries electricity better than any other metal. In high performance systems, it cannot be easily replaced.
So demand keeps rising while supply is already tight.
4. THE PAPER MARKET IS WAY BIGGER THAN THE REAL METAL
Most silver trading happens through paper contracts, not real metal. Paper to physical leverage is estimated 350:1. That means for every 1 real ounce, there can be 350+ oz in paper claims. This only works as long as nobody asks for physical delivery.
But when physical delivery increases:
• Shorts cannot find metal
• They must buy contracts back
• Price moves up fast
• More shorts are forced to exit
That creates a forced buying loop.
5. LEASE RATES AND BACKWARDATION SHOWED PHYSICAL STRESS
A) Lease rates
Lease rates are the cost to borrow physical silver. Normally, lease rates are close to zero. They spiked close to 39% annualized recently. That means physical silver became extremely difficult to borrow.
B) Backwardation
Backwardation means spot prices are higher than futures prices. This happens when buyers want metal immediately, not later. Silver backwardation reached levels last seen around 1980 during some periods.
That shows severe physical shortage.
6. REFINING BOTTLENECKS MADE IT WORSE
About 9.7% of global refining capacity went offline in late 2025. Even when silver existed, it could not be processed fast enough into usable form.
That tightened supply further.
7. ETFs REMOVED EVEN MORE METAL FROM CIRCULATION
ETFs buy real silver bars and store them. Over 95 million ounces flowed into silver ETFs in early 2025 alone. That metal is no longer available for industry or delivery.
8. SILVER WAS CLASSIFIED AS A STRATEGIC MATERIAL
In August 2025, the U.S. added silver to its Critical Minerals List. This officially changed silver from a normal commodity into a strategic resource.
9. WHY SILVER MOVES FASTER THAN GOLD
Gold markets are large and deep. Silver markets are smaller and thinner. When demand rises, silver prices move much faster. Silver did not go parabolic for one reason.
It moved because of:
• Multi-year supply deficits
• China tightening refined exports
• Rising industrial demand
• Huge paper leverage with limited physical supply
• Lease rate spikes
• Backwardation
• London inventory stress
• Refinery shutdowns
• ETF absorption
• Strategic classification
The market stopped being driven by paper prices.
It started being driven by physical availability.
Murad Cancelled the Altseason Narrative in 2025, Claiming the Old Cycle Would Never Return.
Now That It’s 2026, Are We Getting a Selective Altseason Where Most Coins Get Left Behind?
🇨🇦 Eligible taxpayers in Canada, including international students and work permit holders, qualify for many CRA benefits payments
🇨🇦 Check out 7 CRA benefits, their eligibility, and all the payment dates in 2026 👇
https://t.co/7oGSfwS8xd