Tony´s B-wave boucne aligns with the wave 2 on the MCO price chart. This shows how you can come to similar projections with different wave counts.
$BTC #Bitcoin
$BTC
Bitcoin testing the support zone after reaching the expected July resistance. Classic.
$59,317-$62,436 is the line. Hold it and another rally toward $66,200-$76,600 stays on the table.
🚨 THE S&P 500 WILL DUMP TO THE 200W MA
You can call it doom posting.
You can call it impossible.
But every major correction eventually comes back to the same place.
→ 2016
→ 2018
→ 2020
→ 2022
And now the gap between $SPX and the 200W MA is stretched again.
I believe the next major correction sends the S&P 500 straight back toward that red line.
Most people won’t believe it until the selloff has already started.
Remember this chart.
I warned you before it happened.
@CredibleCrypto Relative strength thesis works if BTC/ETH bleed is orderly
ETH top trader L/S sitting at 1.45... that's a crowded long
A disorderly unwind doesn't pick favorites
DON’T SHORT $BTC NOW
First, $BTC will close the FVG at $70K
Then we’ll see the final drop
Here’s my plan:
1. First long zone – $64,700 (already opened)
2. Second long zone – $62,500/$61,200
3. It’s important to see a reversal structure on the 1H timeframe
4. Then a rally to $70K
5. 7–14 days of distribution
6. Then a breakdown below $59K
7. Flush to $48K
8. Final bottom test in the $38K–$44K zone
Let me also remind you: when #BTC reaches the $68K–$70K zone, we’ll see an altcoin bounce of roughly 40–100%
I expect the final decline to begin in August/September. So be careful with long positions
$ETH is showing strength, just as I mentioned in my previous post
After that, a drop will follow, because this is another bull trap
Many believe the bottom has already been reached.
I think the final part hasn’t started yet.
As a reminder, I warned about the bull trap at $82K and the summer drop.
MY NEXT CALL WILL BE THE BIGGEST ONE OF THIS CYCLE.
TURN ON NOTIFICATIONS. MOST PEOPLE WILL FOLLOW ME TOO LATE.
$BTC
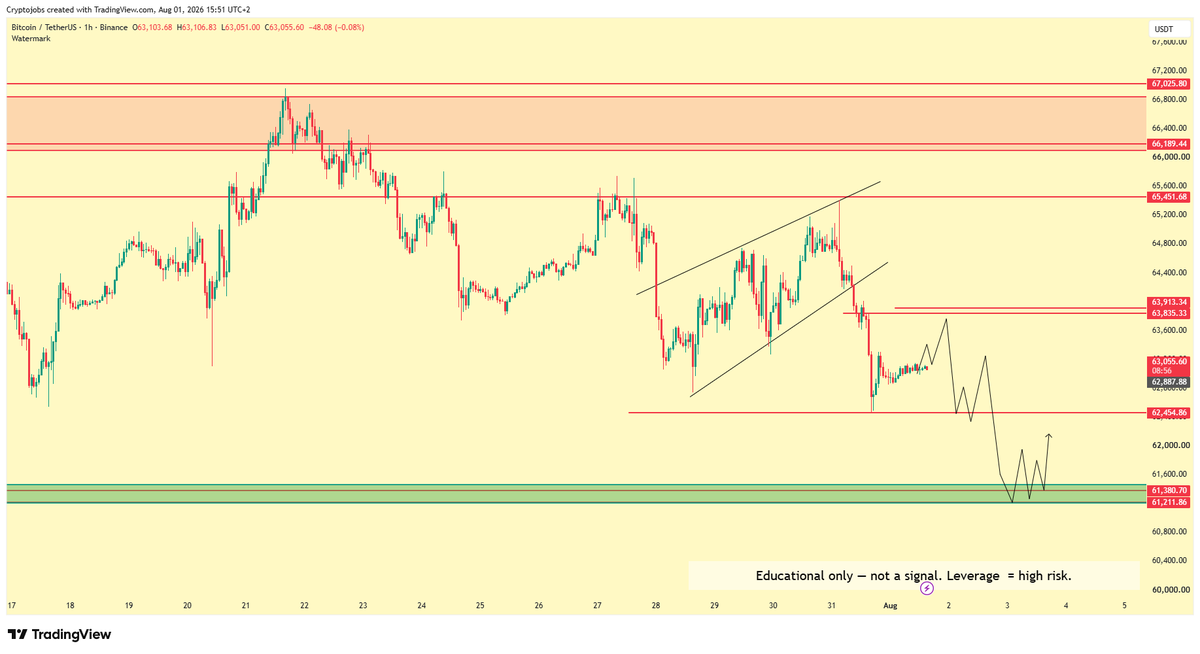
Getting the retest of the LTF zone like we planned for,
Now I am expecting a rejection from here towards the downside liquidity (Sub 62k), and look for longs on the marked zone below.
Imo, we are seeing the Sunday pump right now and it will be followed by a Monday dump tomorrow.
🚨 BITCOIN DUMPED TO $62K FOR A REASON
The relief rally is officially over.
The final liquidation starts next week.
$62K → $57K → $50K → $45K
Keep in mind:
I publicly called Bitcoin's $17K bottom in 2022.
Then I publicly called the $126K top in 2025.
The next major call will be posted here first.
Follow and turn notifications on.
$BTC
100% without a question, this will be the bottom
We had an aggressive rally, swept local 67K top, liquidity was stacking below all the time and that's exactly why we are dumping rn
Major bids are stacked at ~40K-60K zone
But I don't think we get 40K like it never gave 10K zone last bear cycle, target that became consensus at 15K
Now same will happen with bottom ~50K-55K
$BTC
Price is breaking down after the FOMC,
We still have un-swept levels remaining below so it's very likely that they are gonna be hunted very soon.
I will be looking for swing longs from the zone below (after the liquidity hunt),
And will target 65k as my first TP for the longs,
For max, I think we are gonna go to 67-68k, filling the mFVG there and then rejecting from there towards lower levels again.
For the time window, We should be dropping from Monday hunting the liquidity levels below into our Long zone,
Then slowly move move/grind upwards and fill the mFVG in the first 2 weeks of August and form the High for the range there.
Overall, I think August is gonna close Red following our Green July thesis.
🚨 The City of London Is Preparing for the Biggest Financial Bloodbath in Decades
A high-level figure from the City of London @LordBelgrave just broke silence.
The City Of London isn’t just a financial district. It’s a separate jurisdiction, with its own police and military system, effectively a country of its own at the center of London, controlled by an elite global network that no government fully oversees… and it runs global finance.
This man has sat in the closed-door meetings for decades.
Every time he quietly shared what was discussed behind those doors, it eventually played out exactly as he said.
Look at his previous post. He laid out the exact sequence:
Oil turmoil → Yen carry trade unwind → liquidity crisis → systemic event.
He had even posted the Euro sign with Japanese yen. Today, Washington has stepped in hard, dumping euros to buy yen, coordinating with the Bank of Japan, while Japan (and others) dump dollars.
It’s happening in real time.
His latest image.. two swans, both bleeding is the clearest signal yet:
THE CITY OF LONDON IS PREPARING FOR A FULL BLOODBATH.
The pressure is so extreme they’re intervening to stop the cascade.
The elites already know. They’re positioned.
The bloodbath is no longer a theory. The Fiat Era is nearing its implosion.
A GROUNDBREAKING study found sunlight PASSES THROUGH the human body, RAPIDLY boosting mitochondrial function and improving vision.
Just 15 minutes of infrared sunlight exposure improved blue-yellow vision by 16% and red-green vision by 9% within 24 hours.
Get sun.
🚨 HISTORIC ALERT: Washington just SOLD EUROS to BUY Japanese YEN in an extremely rare market intervention.
The U.S. is now acting as the BANK OF JAPAN!!
This is concrete proof the Reverse Carry Trade UNWIND is already underway and accelerating FAST.
Trillions in cheap yen-funded bets across the globe are about to get violently crushed. Markets are going to seize up, risk assets will cascade lower, and the pain will be brutal.
They wouldn’t do this unless they were 100% certain the RCT reverse is happening RIGHT NOW.
This is how the 2008 crisis started… but 10x worse.
Brace yourselves!!
🚨 WARNING
Every global crash starts with South Korea.
It sounds ridiculous.
Until you look at the history.
1997:
- The Korean won collapsed
- KOSPI crashed
- Foreign exchange reserves nearly ran out
- Then the Asian Financial Crisis spread across the world
2000:
- South Korean semiconductor stocks topped first
- Months later, Nasdaq dumped 78%
- The Dot Com Bubble popped
2008:
- Korean stocks started breaking down
- Just over a month later, Lehman Brothers collapsed
- The global financial system went with it
2021:
- Bill Hwang used extreme leverage through Archegos
- The fund exploded
- Global banks lost more than $10 billion
- Credit Suisse alone lost $5.5 billion
2022:
- Do Kwon launched LUNA and UST
- More than $40 billion vanished almost overnight
- Then came Three Arrows Capital, Celsius, and FTX
Now the warning is coming from KOSPI again.
Samsung and SK Hynix dominate the index.
More than $30 billion flowed into leveraged products tied to the two companies.
These products rebalance every day.
When prices rise, they buy more.
When prices fall, they are forced to sell.
The deeper the market falls, the more selling the products create.
KOSPI has already fallen 25% in just a month.
The leverage that created the boom is now creating the crash.
Forced selling is feeding more forced selling.
South Korea has warned the world before.
It's warning us again.
Keep in mind: I’ve called every major $SPX selloff, 2025 $BTC ATH and move from $126K → $60K
I was one of the only people who called the top in October, and I’ll do it again, that’s literally my job.
If you still haven’t followed me, you’ll regret it.
IVERMECTIN: FULL DOSAGE SCHEDULE FOR CANCER & PREVENTION
1000s of people use Dr. William Makis MD’s IVERMECTIN dosing chart. Here’s a clear, categorized breakdown based on body weight (mg/kg per day).
LOW DOSE: ≤ 0.5 mg/kg/day
**Best for:**
- Cancers in remission
- Strong family history or genetic predisposition
- Prophylaxis (preventive)
**Side effects:** No long-term side effects reported.
**Example:** Dr. Tess Lawrie reported a Stage 3 ovarian cancer case treated with chemo + 12 mg ivermectin daily. Tumor marker CA125 dropped from 288 to 22 after 2 months and the tumor vanished.
MEDIUM DOSE: 1.0 mg/kg/day
**Best for:** Starting dose for **most cancers** (lung, pancreatic, renal cell, gastric, etc.).
**Side effects:** No long-term side effects reported.
**Example:** Dr. Shankara Chetty’s 70-year-old prostate cancer patient (PSA 89) took 45 mg/day (plus lactoferrin). After two months PSA fell to 10.9.
HIGH DOSE: 2.0 mg/kg/day
**Best for:** Very aggressive cancers (leukemia, pancreatic, brain cancers).
**Side effects:** No long-term side effects reported.
**Example:** Dr. Allan Landrito’s Stage 4 gallbladder cancer patient took 2 mg/kg daily for 14 months — cancer disappeared.
VERY HIGH DOSE: ≥ 2.5 mg/kg/day
**Best for:** Extensive metastatic disease, extremely poor prognosis, or certain brain cancers.
**Side effects:** Possible short-term & transient visual effects (usually resolve in a few days).
**Example:** Dr. Shankara Chetty treated a patient with 2.5 mg/kg/day — no side effects reported.
**Quick conversion example (for a 60 kg / 132 lb person):**
- Low: ≤30 mg/day
- Medium: 60 mg/day (≈5×12 mg tablets or 1 teaspoon liquid)
- High: 120 mg/day
- Very High: ≥150 mg/day
Many anecdotal reports exist of long-term daily use (months to over a year) with no serious toxicity, but individual responses vary.
Always work with a knowledgeable clinician, especially if you have pre-existing conditions (e.g., vision issues or glaucoma). This is for educational purposes only.
Share to spread awareness — information. Follow for more .IVERMECTIN: FULL DOSAGE SCHEDULE FOR CANCER & PREVENTION
1000s of people use Dr. William Makis MD’s IVERMECTIN dosing chart. Here’s a clear, categorized breakdown based on body weight (mg/kg per day).
LOW DOSE: ≤ 0.5 mg/kg/day
**Best for:**
- Cancers in remission
- Strong family history or genetic predisposition
- Prophylaxis (preventive)
**Side effects:** No long-term side effects reported.
**Example:** Dr. Tess Lawrie reported a Stage 3 ovarian cancer case treated with chemo + 12 mg ivermectin daily. Tumor marker CA125 dropped from 288 to 22 after 2 months and the tumor vanished.
MEDIUM DOSE: 1.0 mg/kg/day
**Best for:** Starting dose for **most cancers** (lung, pancreatic, renal cell, gastric, etc.).
**Side effects:** No long-term side effects reported.
**Example:** Dr. Shankara Chetty’s 70-year-old prostate cancer patient (PSA 89) took 45 mg/day (plus lactoferrin). After two months PSA fell to 10.9.
HIGH DOSE: 2.0 mg/kg/day
**Best for:** Very aggressive cancers (leukemia, pancreatic, brain cancers).
**Side effects:** No long-term side effects reported.
**Example:** Dr. Allan Landrito’s Stage 4 gallbladder cancer patient took 2 mg/kg daily for 14 months — cancer disappeared.
VERY HIGH DOSE: ≥ 2.5 mg/kg/day
**Best for:** Extensive metastatic disease, extremely poor prognosis, or certain brain cancers.
**Side effects:** Possible short-term & transient visual effects (usually resolve in a few days).
**Example:** Dr. Shankara Chetty treated a patient with 2.5 mg/kg/day — no side effects reported.
**Quick conversion example (for a 60 kg / 132 lb person):**
- Low: ≤30 mg/day
- Medium: 60 mg/day (≈5×12 mg tablets or 1 teaspoon liquid)
- High: 120 mg/day
- Very High: ≥150 mg/day
Many anecdotal reports exist of long-term daily use (months to over a year) with no serious toxicity, but individual responses
Bitcoin closed July $62,818
200-week moving average $63k
Realized price $52k (still decreasing)
Monthly RSI 43 (still < 50)
It looks like bitcoin has started the bottoming process. This normally takes 1-3 months and BTC would drop lower during this phase (below realized). DYOR.
THE ETHEREUM TREND LINE ALREADY GOT TESTED. IT HELD. ALMOST NOBODY BOUGHT IT.
$1,530 is where the line and exhaustion met. Price tapped it and pumped straight off it.
2020 printed that same point at $110. Then the range broke and $ETH ran to $4,900.
ETH is $1,867 now. The people waiting for a "better entry" watched the better entry happen.
My bids still run down to $1,500, because a line that holds once usually gets tested twice.
Max pain isn't a warning. It's the entry nobody takes.
$BTC HIT 65K
and is now pressing right into the upper boundary of the descending channel
this is the same zone where whales have been stacking heavy shorts
a major resistance area that could decide what happens next
break higher and we invalidate the descending channel, reject here and the downtrend stays intact
this level matters
what do you think, do bulls have enough strength to absorb the sell pressure?