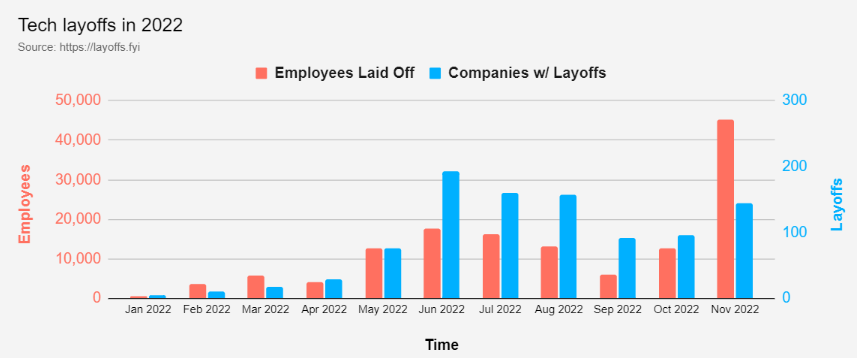
The tech industry is going through a terrible churn right now with more than 120,000 layoffs in 2022.
But, what makes it worse is the overall direction.
September ~6,000 layoffs
October ~ 12,500 layoffs
November ~ 45,000 layoffs with still a week to go!
Worked with AG Grid today, which allowed for a more interactive Streamlit dataframe.
This introduced much better sorting and filtering utility.
I especially like the capability to select rows within the main table, to then output those rows into a separate table for review.
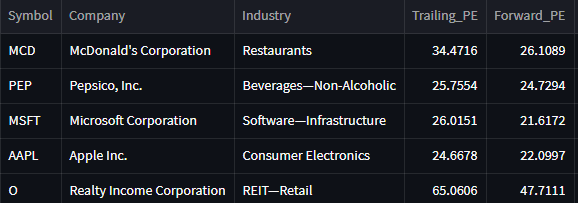
Studying different variations of multiples analysis to evaluate the valuation of a stock.
First up is the P/E ratio: Share price / Earnings Per Share (EPS)
Trailing P/E utilizes historical earnings data for its EPS.
Forward P/E takes expected earnings for its EPS.
And I noticed high coupling in my code was I made adjustments to things such as renaming columns.
I'll need to review and optimize this in another refactoring session.
More and more work with Streamlit and yfinance library.
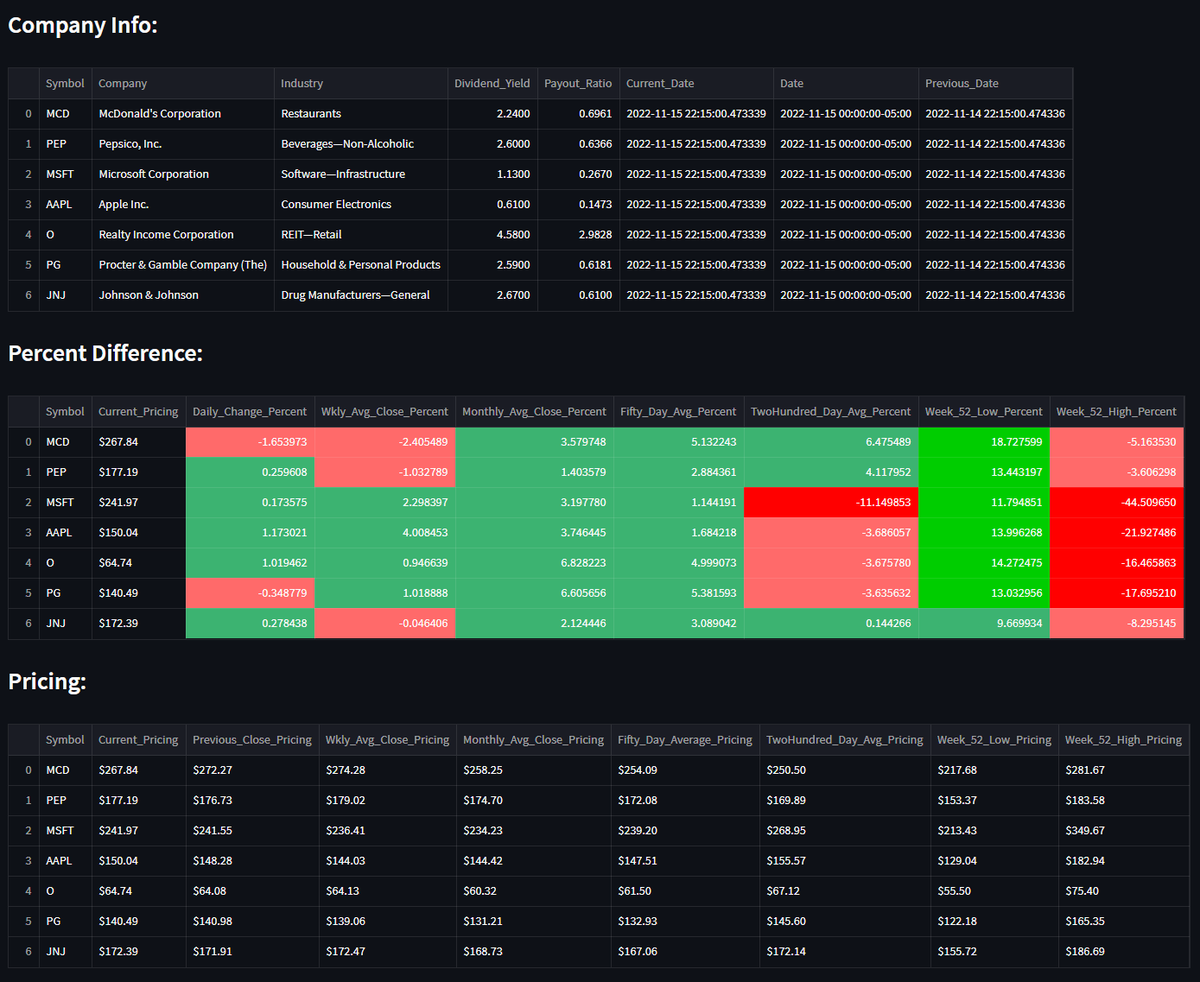
Pulled out additional attributes of interest like dividend yield or payout ratio of a stock.
Also separated the merged data frame into different table outputs to prevent the need to side scroll.
Day 66 | #66daysofdata
And with that, this challenge is complete. Admittedly, the latter half of the challenge saw a steep drop in length of study/practice.
Either way, I've accomplished my primary goal, which was to integrate Python automation to optimize my day-to-day job.
Worked more with my yfinance library. There's just so many different methods to explore, I can't seem to put it down.
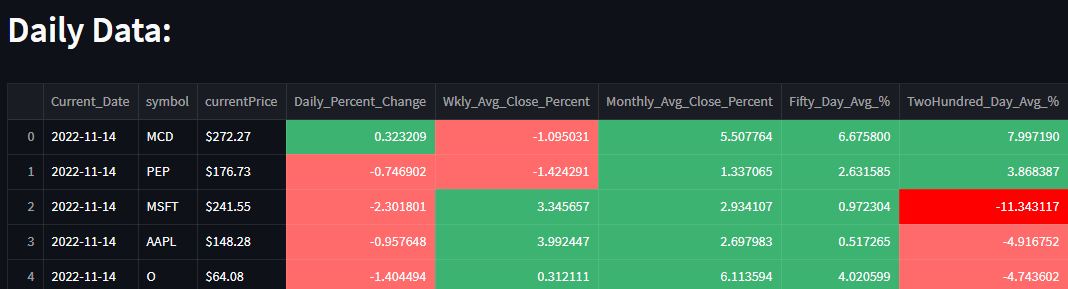
After merging a couple of dataframes, I pulled the data into Streamlit with a few conditional statements to denote different colors based on percent change.
More code refactoring.
While building my projects up, I start in Jupyter notebooks.
But D.R.Y principle is typically not followed during this process.
Eventually, I copy the code to a .py file to find areas to optimize design.
#66daysofdata
Having some fun with Streamlit.
Using Pandas to import yfinance data on stocks of interest, exporting that data into a .csv, and then writing it into Streamlit.
Created a few derived columns based on rolling average calculations for different time intervals.
#66daysofdata
@DataWithFay I wouldn't credit a single resource, but I did focus on connecting to SQL data using pyodbc and then Pandas for importing, exporting, and cleaning data.
At my job, I found areas where Excel reports were being manually created/altered and used Python to automate these processes.
Day 65 | #66daysofdata
Did more work on my investment portfolio project. Hand picked a few stocks that I would like to track percent changes over different time intervals.
Day 64 | #66daysofdata
Dealing with data being transformed incorrectly. I.e., leading zeros from a .CSV format being dropped when being converted from a .TXT pipe delimited format.