THE RECOVERY IS REAL — BUT THE TREND STILL NEEDS CONFIRMATION
$374.58 is well above the $297.38 swing low, but still below the $377.74 MA120 and $398.30 MA250. Volume is at 0.516 versus a 5-day average of 0.467, about 10.5% above average.
📍 What I'm watching:
• $369–$372: First support
• $362–$364: Secondary support
• $378–$386: Immediate resistance
• $398–$400: Major resistance
My take: The short-term setup is improving, but I wouldn't confuse a strong rebound with a confirmed long-term reversal. Holding $369–$372 would keep the recovery constructive; losing that zone could put $362–$364 back in play. A sustained move above $386 would be a more convincing bullish signal.
Would you buy this recovery now or wait for a confirmed breakout?
#Stocks #VolumeAnalysis #TechnicalTrading #RiskManagement #MarketOutlook #WallStree
VOLUME IS PICKING UP AS PRICE TESTS THE HIGHS
The chart shows price at $348.22, with volume at 0.469 versus a 5-period average of 0.426—about 10.09% above average. Buyers are pressing against the $348.36 resistance level.
📍 What I'm watching:
• $348.36: Breakout trigger
• $343.62: MA5 support
• $338.57: MA20 support
• $328.62: MA50 support
My take: The moving-average structure remains bullish, and improving volume adds confidence to the setup. Still, resistance is resistance until price proves otherwise. A failed breakout followed by a loss of $343.62 could open the door to a retest of $338.57.
Would you buy the breakout or wait for a cleaner retest?
#Stocks #VolumeAnalysis #TechnicalTrading #RiskManagement #MarketOutlook #WallStreet
VOLUME IS SURGING — BUT THE TREND HASN'T TURNED YET
Price is sitting near $98.92 after falling nearly 23% from the $128.425 high. Volume is about 61% above its 5-period average, signaling increased activity near the lows.
📍 What I'm watching:
• $92.11: Recent swing low
• $100: Psychological level
• $104.09: MA5 reclaim level
• $108.87–$112.66: Major moving-average resistance
My take: Heavy volume near the lows can signal capitulation or fresh selling—we need price confirmation. A move back above $104, followed by a sustained recovery toward $109–$113, would improve the technical picture. Until then, capital preservation comes first.
Would you wait for confirmation or try to catch the bounce?
#VolumeAnalysis #Stocks #TechnicalTrading #MarketOutlook #TradingStrategy #WallStreet
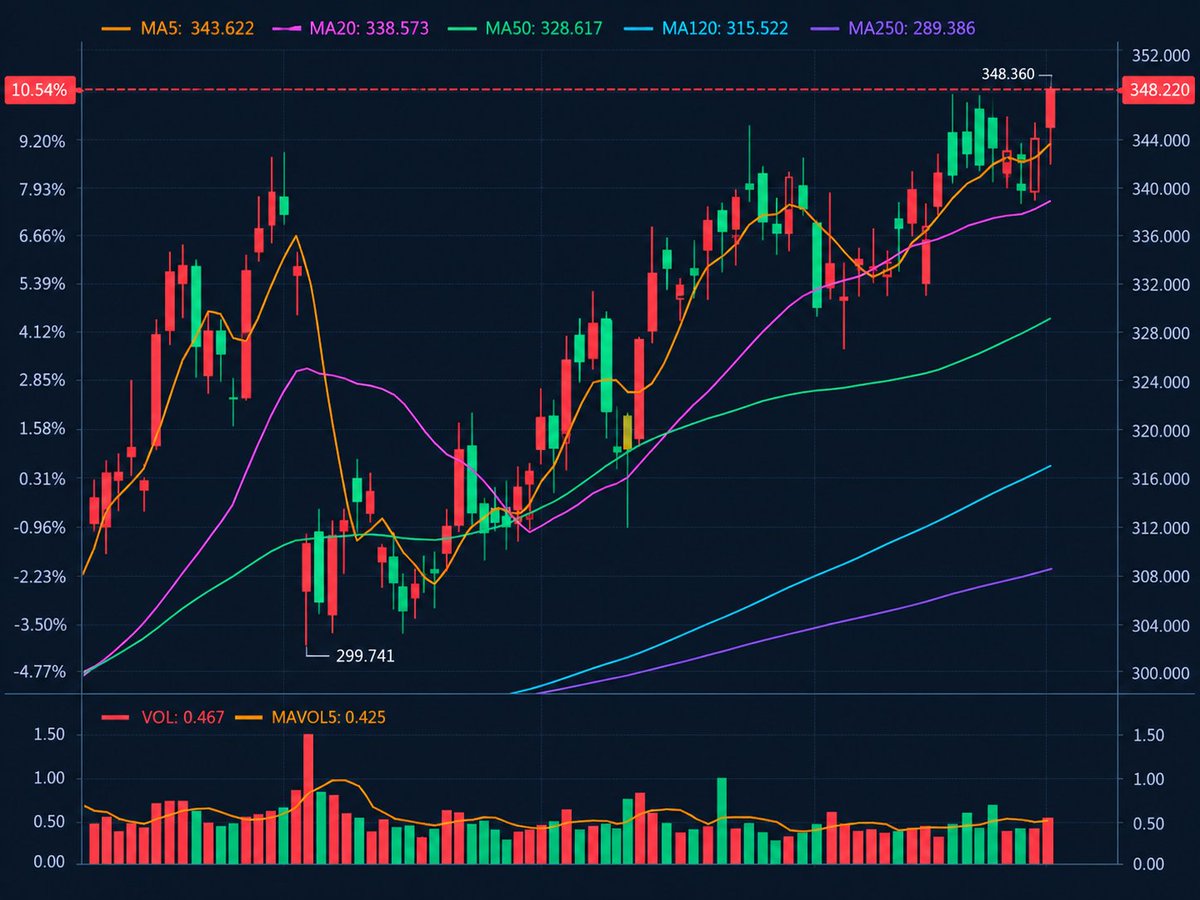
VOLUME IS PICKING UP — NOW THE BREAKOUT NEEDS TO HOLD
Price is hovering near $348.22, just 0.04% below the $348.36 high. Volume reads 0.467 versus a 5-period average of 0.425, about 9.9% above average.
📍 What I'm watching:
• $348.36: Breakout level
• $343.62: MA5 support
• $338.57: MA20 support
• $328.62: MA50 support
My take: The price structure remains bullish, and volume has moved above its recent average. That's constructive, but one reading doesn't confirm a breakout. I want price to hold above resistance; if the move fails and $343.62 gives way, a pullback toward $338.57 becomes possible.
Would you buy the breakout or wait for a retest?
#Stocks #VolumeAnalysis #TechnicalTrading #RiskManagement #MarketOutlook #WallStree
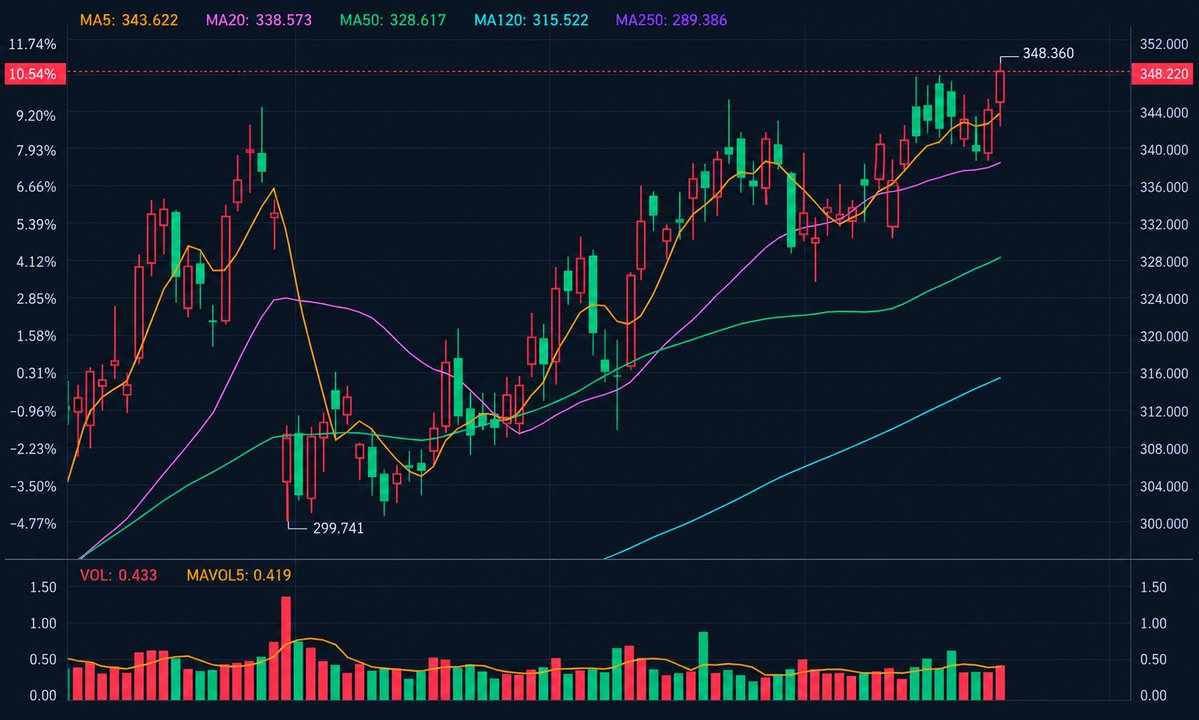
PRICE IS PUSHING HIGHER — AND VOLUME IS PICKING UP
The chart shows price at $348.22, just 0.04% below the marked high of $348.36. Volume reads 0.433 versus a 5-period average of 0.419, about 3.3% above average.
📍 What I'm watching:
• $348.36: Breakout level
• $343.62: MA5 support
• $338.57: MA20 support
• $328.62: MA50 support
My take: This is a more constructive setup than before because volume has moved above its recent average. Still, one reading isn't enough to confirm a breakout. I want price to hold above resistance; if the move fails and $343.62 gives way, a pullback toward $338.57 becomes possible.
Would you buy the breakout or wait for a retest?
#Stocks #VolumeAnalysis #TechnicalTrading #RiskManagement #MarketOutlook #WallStreet
$348 IS THE LINE IN THE SAND
Price is marked at $347.43, up about 15.91% from the $299.741 low. Bulls are pressing against the $348.15 swing high, but the breakout still needs confirmation.
📊 Key Levels:
🟢 Support: $343.47 (MA5)
🟡 Next support: $338.53 (MA20)
🔴 Resistance: $348.15–$350
My view: Price remains above MA5 ($343.465), MA20 ($338.534), MA50 ($328.602), MA120 ($315.516), and MA250 ($289.383). The trend favors the bulls, but I want to see a decisive break above $348.15 before chasing momentum.
Will buyers finally clear the highs, or will resistance trigger a pullback?
#StockMarket #TechnicalAnalysis #PriceAction #Stocks #Trading #Momentum
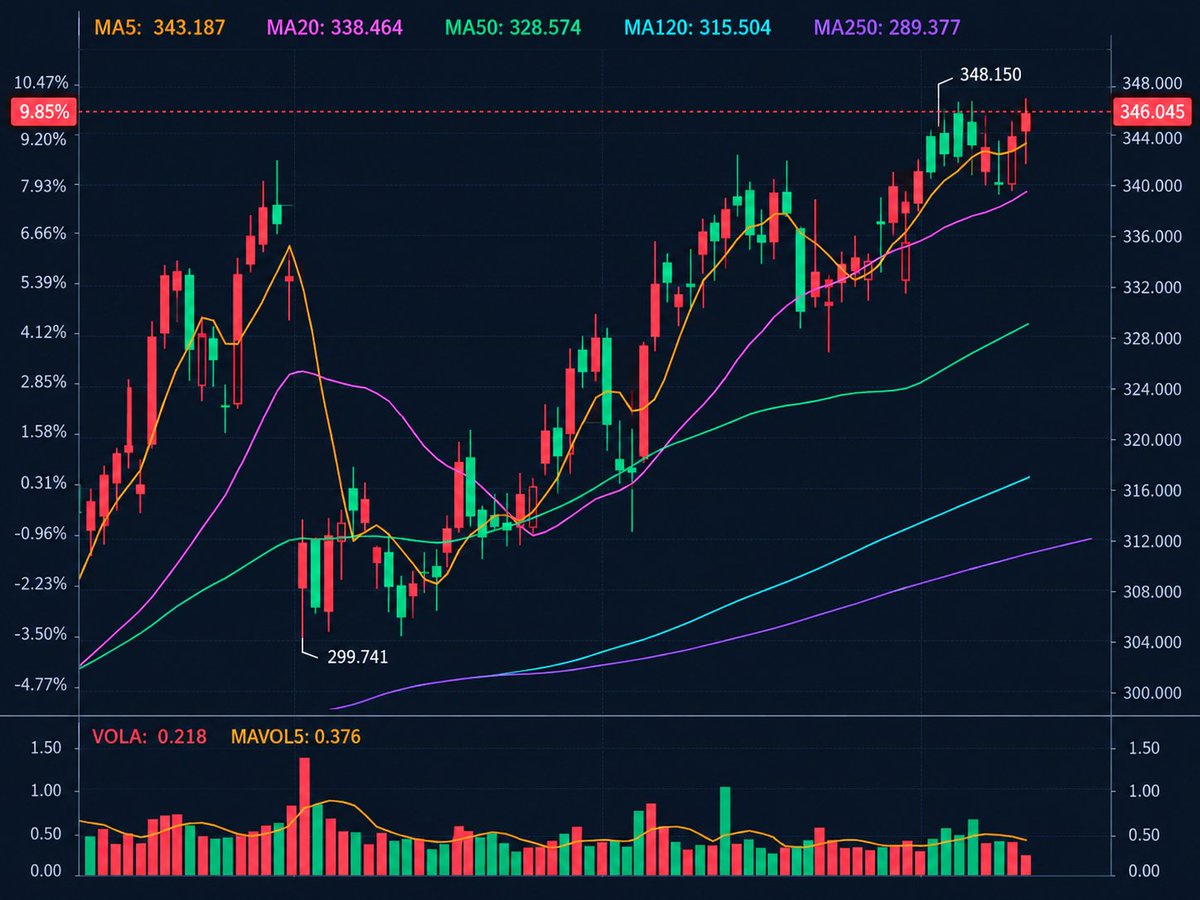
BULLISH STRUCTURE, BUT VOLUME MATTERS
Price is hovering near $346, just 0.60% below the $348.150 high. The latest volume reading is 0.218 versus a 5-period average of 0.376—about 42% below average.
📍 What I'm watching:
• $343.19: MA5 support
• $338.46: MA20 support
• $328.57: MA50 support
• $348.15: Breakout level
My take: The moving-average structure favors the bulls, but the breakout still needs confirmation. Stronger volume above $348.15 would make the move more convincing. If resistance holds and price loses $343, a retest of $338 becomes possible.
Would you chase a breakout here or wait for a pullback and confirmation?
#TechnicalTrading #VolumeAnalysis #StockMarket #RiskManagement #MarketOutlook #WallStreet
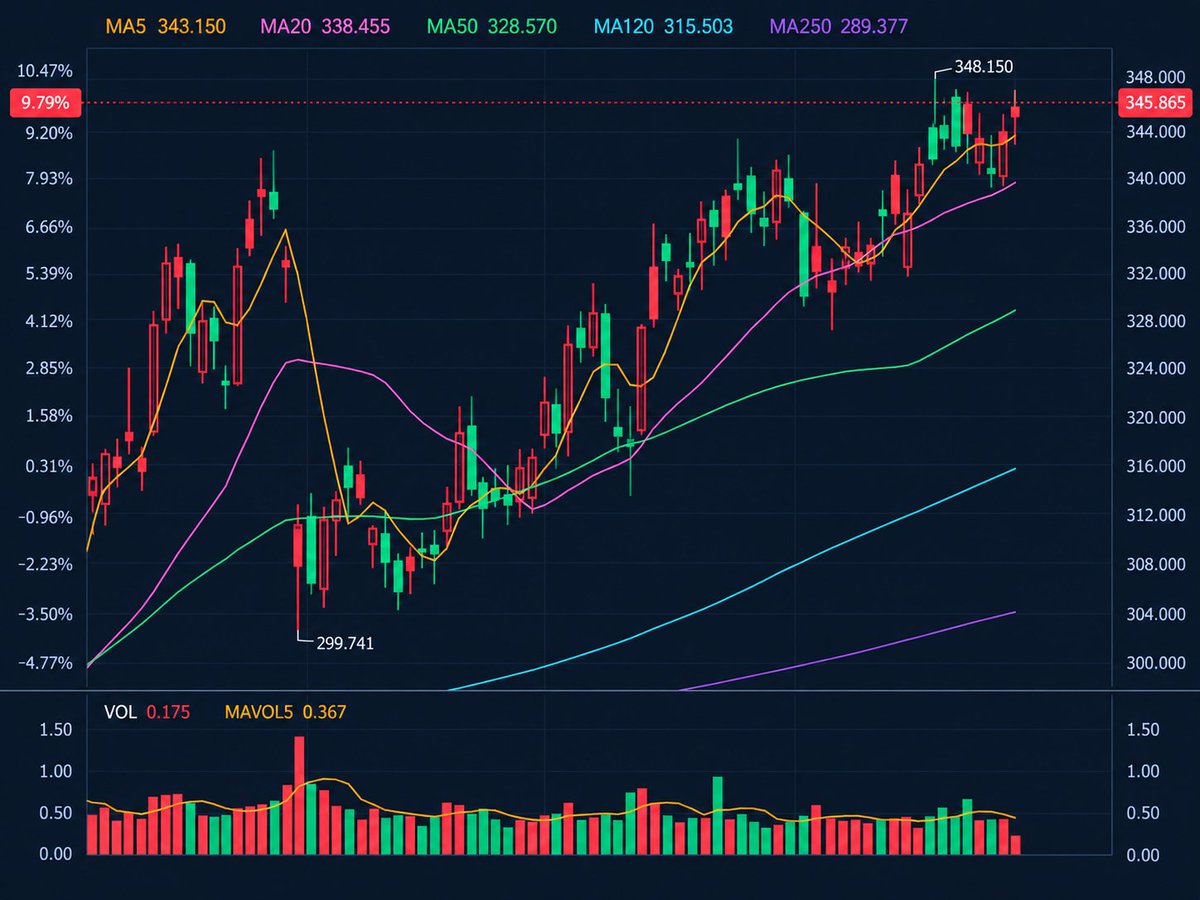
STRONG PRICE ACTION, BUT VOLUME STILL NEEDS TO CONFIRM
Price is marked at $345.865, just 0.66% below the $348.15 high. The latest volume reading is 0.175 versus a 5-period average of 0.367—about 52.3% below average.
📍 What I'm watching:
• $343.15: MA5 support
• $338.455: MA20 support
• $328.570: MA50 support
• $348.15: Breakout trigger
My take: The moving-average structure is bullish, but I won't assume resistance will break on the first attempt. Stronger volume and a sustained move above $348.15 would make the setup more convincing. If price fails, a retest of $343 or $338 becomes possible.
Would you buy the breakout or wait for a retest?
#Stocks #VolumeAnalysis #TechnicalTrading #RiskManagement #MarketOutlook #WallStreet
A STRONG CHART STILL NEEDS VOLUME CONFIRMATION
Price is marked at $346.27, just 0.54% below the $348.15 high. The trend looks bullish, but the latest volume reading is 0.152 versus a 5-period average of 0.362—about 58% below average.
📍 What I'm watching:
• $343.23: MA5 support
• $338.48: MA20 support
• $328.58: MA50 support
• $348.15: Breakout trigger
My take: I like the price structure, but I won't assume resistance will break on the first attempt. Stronger volume and a sustained move above $348.15 would make the bullish case more convincing. If price fails, a retest of $343 or $338 becomes possible.
Would you buy the breakout or wait for a retest?
#Stocks #VolumeAnalysis #TechnicalTrading #RiskManagement #MarketOutlook #WallStreet
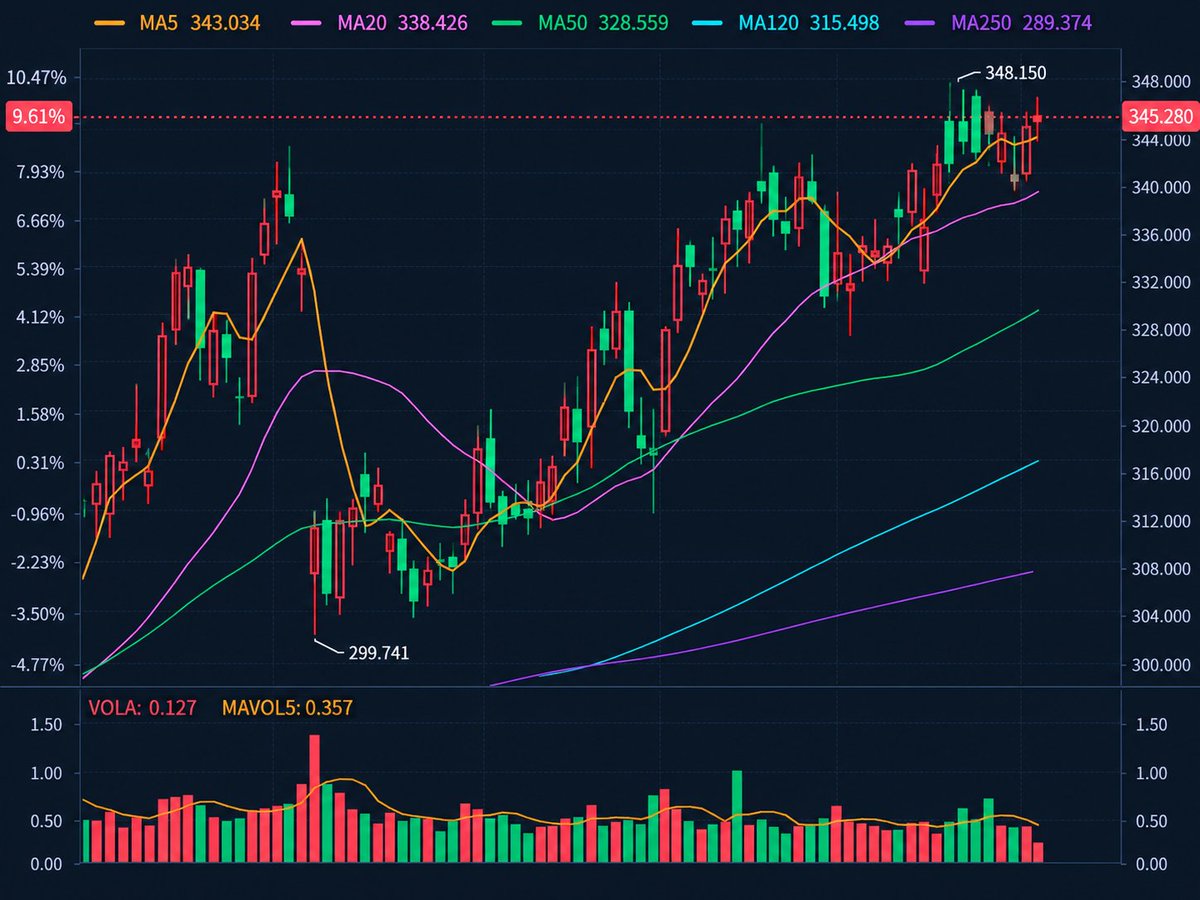
A STRONG CHART STILL NEEDS CONFIRMATION
Price is marked at $345.28, near the recent high of $348.15. But the latest volume reading is 0.127 versus a 5-period average of 0.357—roughly 64.4% below average.
📍 What I'm Watching:
• $343.03: MA5 support
• $338.43: MA20 support
• $328.56: MA50 support
• $348.15: Breakout trigger
My take: The moving-average structure favors the bulls, but weak volume makes me cautious about chasing price into resistance. A confirmed breakout with stronger volume would be more convincing. If price fails here, a pullback toward $343 or $338 becomes possible.
Would you buy the breakout or wait for a retest?
#StockTrading #TechnicalAnalysis #VolumeAnalysis #RiskManagement #MarketOutlook #WallStreet
$100 IS THE KEY LEVEL TO WATCH
Price is marked at $100.730 after pulling back 21.56% from the $128.425 high. The chart remains under pressure, with price below MA5 ($104.450), MA20 ($108.958), MA50 ($112.697), and MA120 ($109.964).
📍 Key Levels:
🟢 Support: $100
🔻 Next downside zone: $96–$98
🟡 Resistance: $104–$105
🔴 Major resistance: $109–$113
My view: The trend remains bearish until price starts reclaiming key moving averages. I'd rather see $100 hold and price recover above $104.45 before looking for a stronger bounce. A confirmed breakdown could open the door to a retest of $92.11.
Will $100 hold, or are sellers still in control?
#StockMarket #TechnicalAnalysis #Stocks #PriceAction #Trading #WallStreet
Hi! Thanks for the follow. I noticed you're interested in the market as well. I run a free investor discussion group where we talk about U.S. stocks, AI, semiconductors, market trends, and technical setups. It's mainly a place to exchange ideas and learn from each other. If that sounds useful to you, I'd be happy to send you an invite
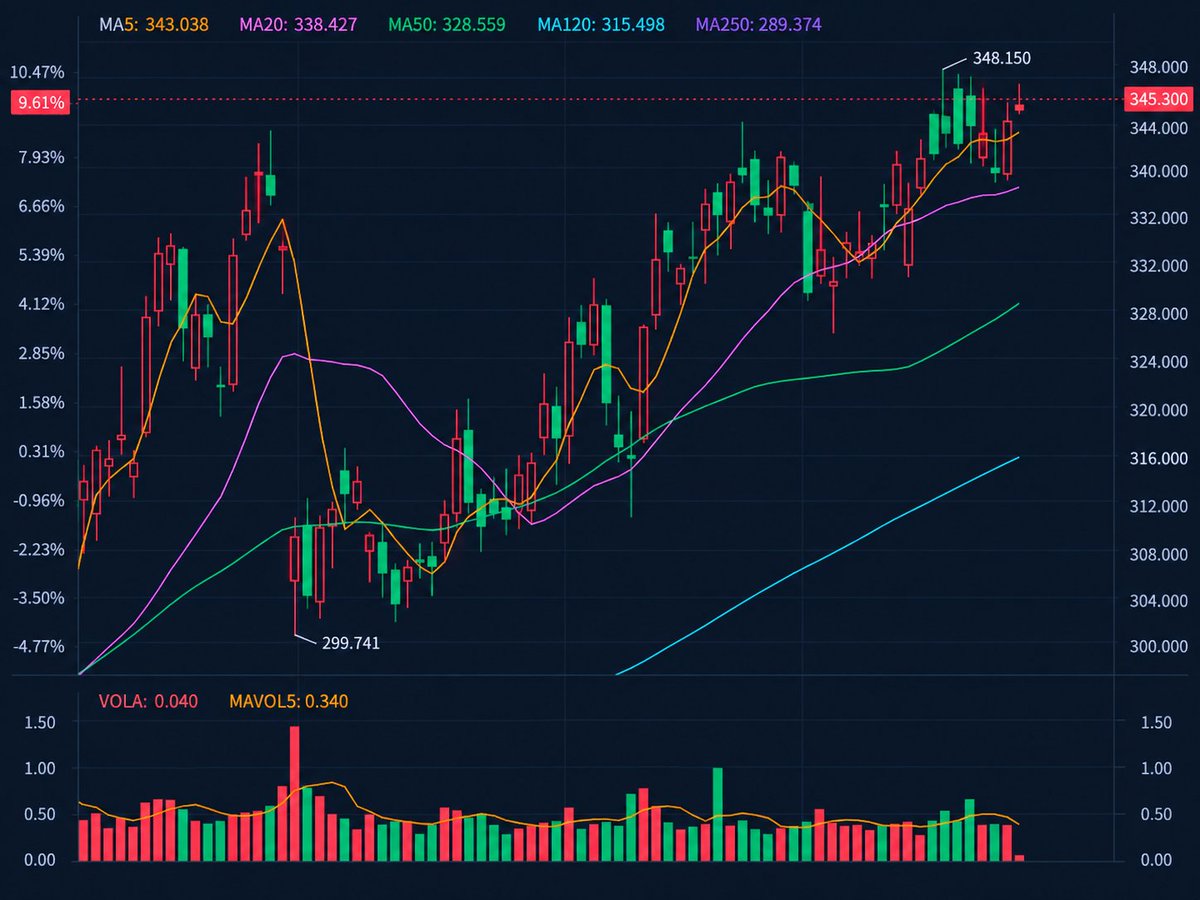
$348.15 IS THE LEVEL TO WATCH
Price is marked at $345.30, sitting just 0.82% below the chart's $348.15 high. The trend is constructive, but resistance is right overhead.
📍 My key levels:
• $348–$350: Resistance
• $342–$343: First support
• $338–$339: MA20 support zone
• $328–$329: MA50 support zone
My take: I'd rather see price break above $348.15 and hold the level than chase a move into resistance. A failed breakout could bring a pullback toward the short-term moving averages.
Breakout or rejection—which setup are you watching?
#Stocks #Breakout #TechnicalTrading #MarketAnalysis #PriceAction #WallStreet
@StockMKTNewz Follow me for more stock market updates! This is a free, global stock analysis group where you can receive the latest stock information every single day. It’s incredibly helpful and provides members with valuable insights—all completely free of charge.
@JEFETRADES Follow me for more stock market updates! This is a free, global stock analysis group where you can receive the latest stock information every single day. It’s incredibly helpful and provides members with valuable insights—all completely free of charge.
@VJNCapital Follow me for more stock market updates! This is a free, global stock analysis group where you can receive the latest stock information every single day. It’s incredibly helpful and provides members with valuable insights—all completely free of charge.
@KobeissiLetter Follow me for more stock market updates! This is a free, global stock analysis group where you can receive the latest stock information every single day. It’s incredibly helpful and provides members with valuable insights—all completely free of charge.
@Banana3Stocks Follow me for more stock market updates! This is a free, global stock analysis group where you can receive the latest stock information every single day. It’s incredibly helpful and provides members with valuable insights—all completely free of charge.
@BullTheoryio Follow me for more stock market updates! This is a free, global stock analysis group where you can receive the latest stock information every single day. It’s incredibly helpful and provides members with valuable insights—all completely free of charge.
@b_brito Follow me for more stock market updates! This is a free, global stock analysis group where you can receive the latest stock information every single day. It’s incredibly helpful and provides members with valuable insights—all completely free of charge.