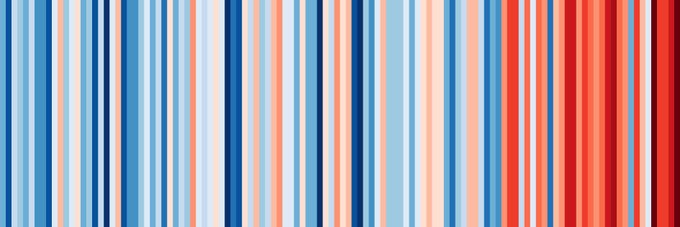
Climate change is everywhere. You can now easily visualize how much annual temperatures have warmed where you live (these are for Amsterdam) by using @ed_hawkins' awesome "climate stripes" tool at https://t.co/RptvzZipZw. #showyourstripes
I was on the BBC World Service this morning, attempting to explain the Dutch election results and the country’s nitrogen crisis in just a few minutes. You can listen to it at about the 33 minute mark here:
https://t.co/bcwESHvUeF
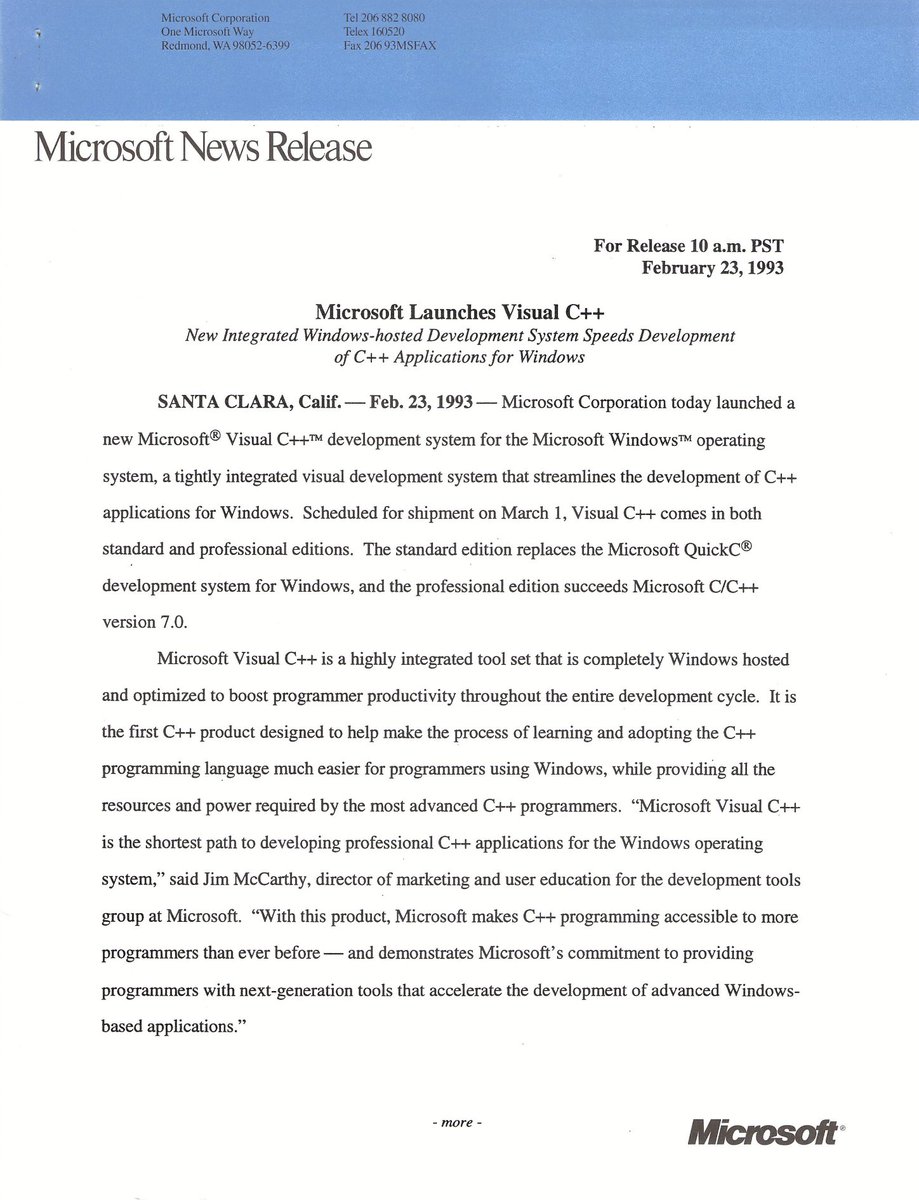
Happy 30th Birthday, @VisualC++.
https://t.co/Z8IUPtbu9Z
Launched at Software Development '93, Santa Clara, 30 years ago.
Launch video: https://t.co/WXEhTMGjuS starring @ricomariani@mccarthyjim1 and Denis Gilbert.
@cschleiden@Outlook I've noticed the same starting a couple of weeks ago...a significant jump that's sustained since then. Very annoying to say the least.