@CasiTrades I don’t think calling another move down is completely wrong, but I believe given the confluence on the higher timeframe , it it low probability and you’ll have to redo your wave count.
https://t.co/b99yKe3uH1
XRP
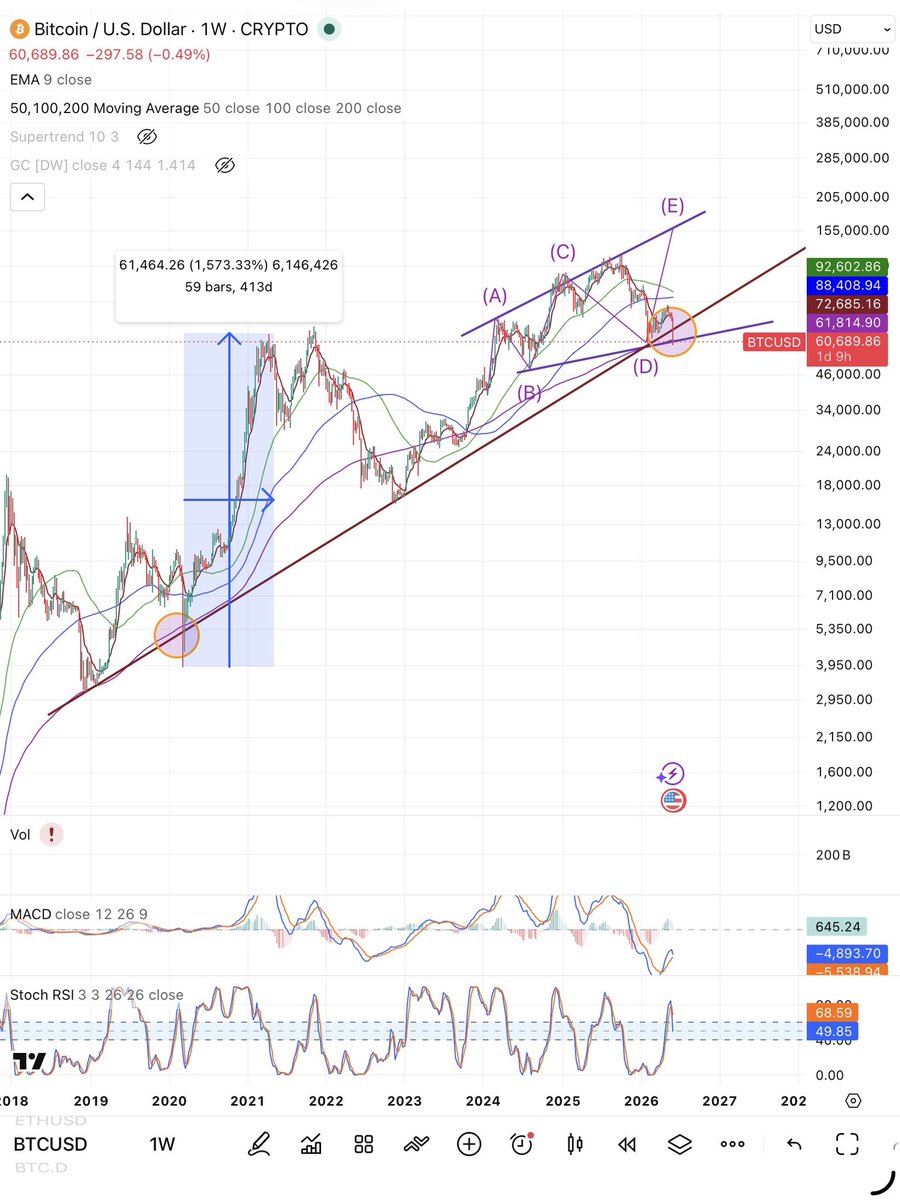
The more and more I look at this, the more confluence I see for reversal
12 year trendline support
.5 fib of the wave 1 move
200W ema support
Just math using Fibs, trendlines, and wave counts.
#xrp
ripple:native
#xrparmy
XRP
The more and more I look at this, the more confluence I see for reversal
12 year trendline support
.5 fib of the wave 1 move
200W ema support
Just math using Fibs, trendlines, and wave counts.
#xrp
ripple:native
#xrparmy
@ChartNerdTA Using the mcap chart the trendline has already been tapped, and the 200w EMA is support.
This can go at any time.
Waiting for sub $1? .90? .70? Good luck
This trendline cannot be ignored. The 12 year trend runs from 2014 and right up to the Feb 2026 low, and market cap is currently sitting on top of it as support, as it sits toward the last move of a bullish megaphone formation.
The next move is imminent
$xrp
#XRPArmy#XRP
#xrpcommunity
I follow @quantum_ascend
I recommend you do the same.
https://t.co/dgmCoP3QIO
@PeterSchiff My trendline is longer bro
Did you say the same thing in 2020?
I’d say gold short term is likely to retest 3600-3800 before BTC hits 25k.
bitcoin:native
Solana is now connected to Axelar Mainnet.
Solana has one of the most vibrant ecosystems in Web3 across DeFi, payments, and tokenization, and is now part of Axelar alongside Ethereum, XRP Ledger, Stellar, Hedera, and others.
Ultimately, developers, users, and institutions shouldn't need to think about which chain they're on. Infrastructure should make ecosystem boundaries increasingly irrelevant.
$ADA vs $XLM vs $XRP
Cardano & Ripple look very similar to Stellar before it took off.
"But XLM had a news event".
Classic show me a chart and I'll tell you the news.
Let's see how the next couple weeks play out 🤝
@Cryptollica Love this chart, but I think for long term price action, you need to use the market cap chart due to tokenomics and inflation of token releases.
Here’s a redo using the MCAP chart
This looks amazing
ripple:native
#XRP
@ChartNerdTA Same theory using the correct chart.
The bottom is likely in, but if the trendline gets retested again, it won’t be below $1, and the reversal will be fast and furious (see XLM).
ripple:native
ethereum:0x516d31321928700c6b4fb0db0c8c6bc5d6799787
stellar:native