@JanWillemTulp@buttsmeister Thanks. This helps -- although I'm still not 100% convinced I get all the nuances. In any case, congrats @JanWillemTulp on a beautifully designed interactive.
@JanWillemTulp@buttsmeister OK, I think get the idea. However, I don't see how it works with more than two connected nodes -- because moving a node A towards another node B directly affects the edge length of all the other nodes connected to A which would (incorrectly) imply changes in their impedance.
NEW PROJECT: a simulation of one of the busiest days of train traffic in The Netherlands. It distorts the map based on how well connected cities are. Go check out the live version: https://t.co/6t4m8xPsSo #dataviz
Excellent article from @jihjeon0 and collaborators about Smoking and Lung Cancer Mortality in the US. https://t.co/h0ZtOsmqR7 Interactive visualizations here https://t.co/mVIAYDAG4L
Outstanding web-based health evaluation tools by @doug_manuel and his team at https://t.co/92ejChR0ra. I really like the super-easy-to-use UI and the custom controls to explain the results. Sample output from one of the tools:
@matthew_daniels I think you hit the main points (and were careful not to make Africa=DRC) Thinking about flights was innovative. It got me thinking about how to juxtapose exports (gold, diamonds, cobolt, copper, etc.) and imports (weapons) over time. See
https://t.co/IahyJCfq8a for an idea.
new shit after FOREVER. This one was a personal goal to finish in two weeks and stick with static charts using @observablehq -> @figmadesign https://t.co/SxSBNq0VZo
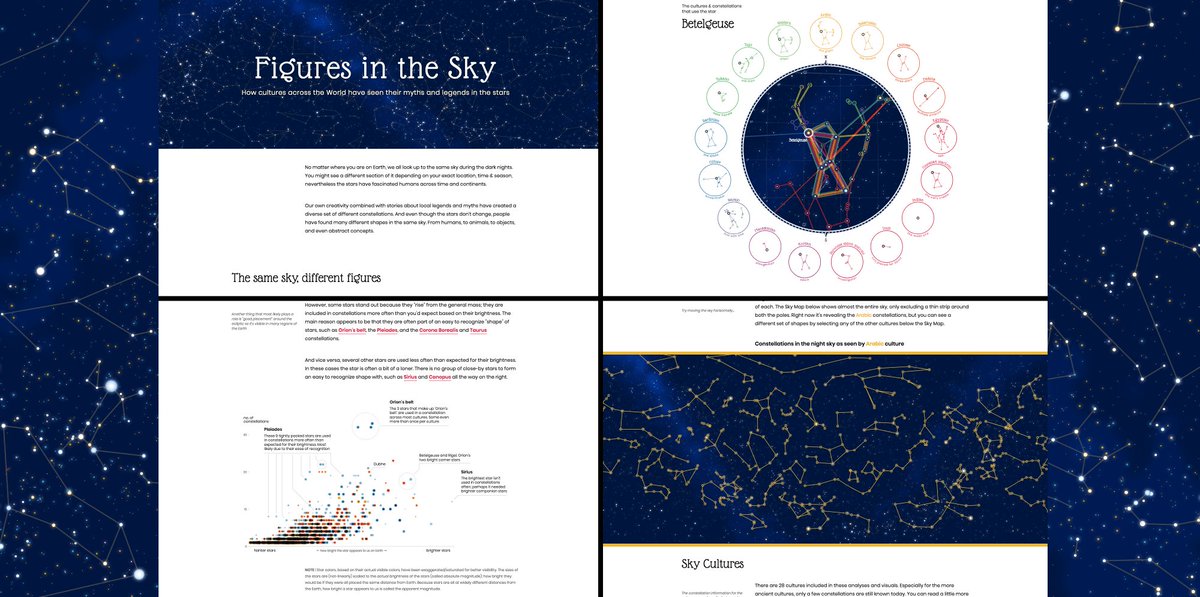
NEW!! 🎉 Come read my interactive #dataviz-driven story: Figures in the Sky ⭐ https://t.co/ntUzogoKF7
See how current & past cultures across the world have seen their myths in the stars. Shapes found everywhere, fascinating constellations & even stranger meanings. Enjoy! 😃
@simongerman600 Would like to see the y-axis scale and for bonus points where the 1975 distribution factors into the 2018 distribution given the increase in population.