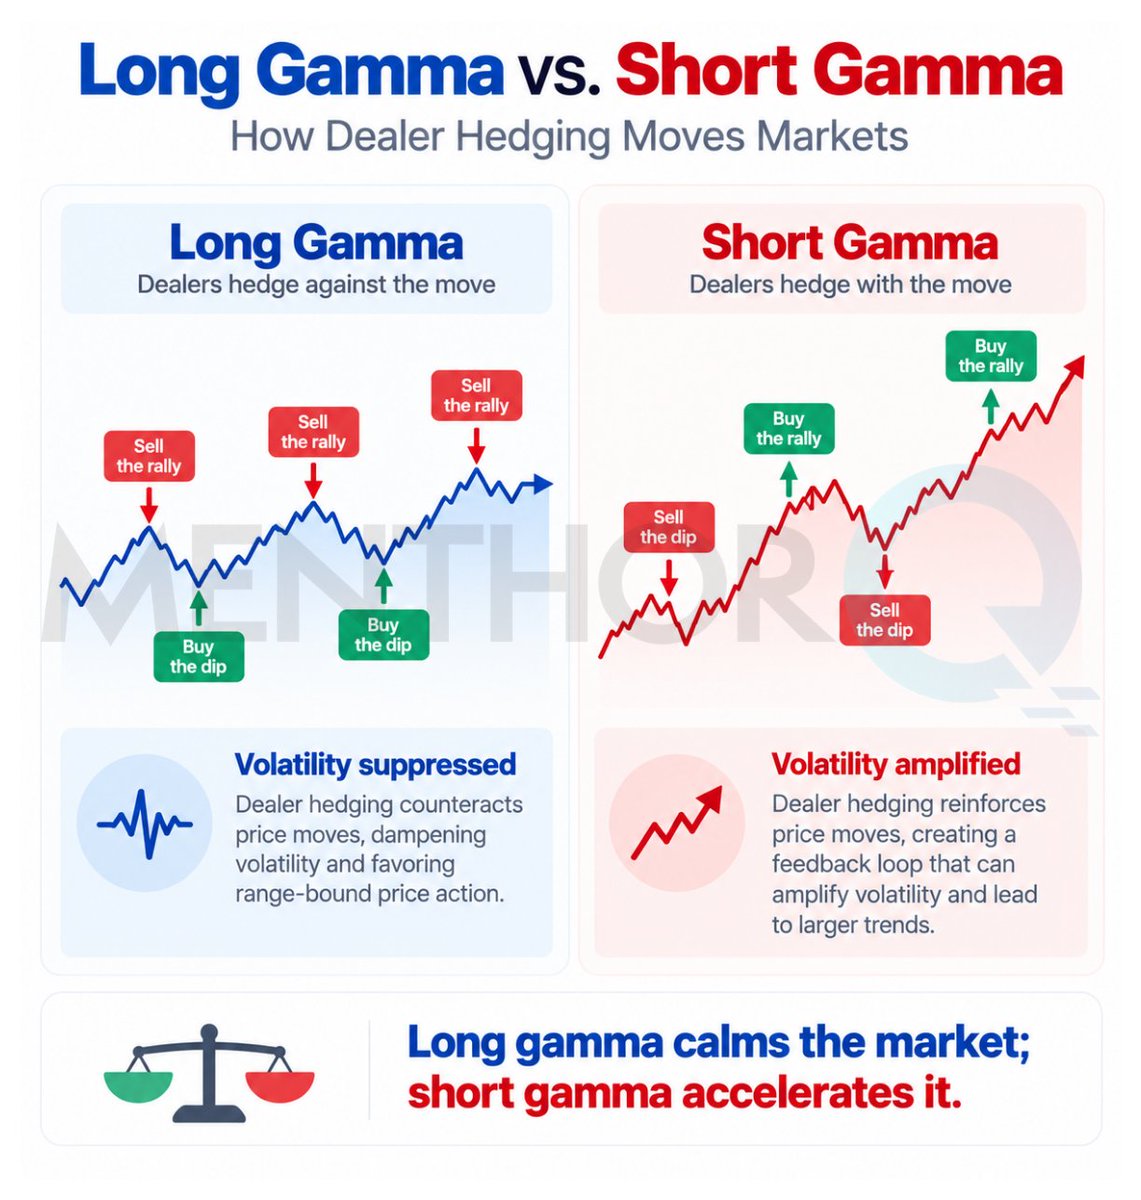
1/ Gamma sounds complicated, but the basic idea is simple:
Delta measures how much an option responds to a move in the underlying.
Gamma measures how quickly that delta changes as price moves.
That second layer can have a real impact on market behavior.
Gold positioning is at its most bearish in years. Trend-following funds have continued to sell, yet gold has failed to make a new low. The market is nearing a more complete capitulation, and the pool of potential sellers may be narrowing.
1/ Total open interest in CME gold futures is only around 400,000 contracts. At the same time, gold’s weight in broad commodity indices is rising, while leverage in risk-parity and volatility-targeting portfolios has reached what appears to be a reasonable ceiling. These two large, relatively sticky sources of open interest should be contributing more to positioning. That makes the persistently low total open interest striking. Estimated leverage in long/short quant fund portfolios is approaching 5x, yet gold open interest remains near 400,000 contracts. This divergence supports the view that gold is underallocated.
2/ More specifically, CTAs are estimated to hold their largest net short in gold since October 2021. One way to estimate discretionary traders’ futures positioning is to subtract the portion of CFTC money-manager positions attributable to CTAs. On that basis, discretionary traders have unwound 55% of the long positions they accumulated in June. Spot-flow tracking also suggests that they have largely stayed on the sidelines in recent months.
3/ The key to gold’s overlooked setup is the mismatch between the scale of selling and the price response. Over the past month alone, cumulative CTA selling amounted to 52% of their historical maximum position size. That monthly flow ranks in the third percentile historically—an extreme level of selling. Yet gold has not made a new low. One inference is that offsetting buying flows are growing stronger. A “mystery buyer” appears to be emerging in gold, though we do not know who it is.
4/ For now, every technical signal in gold points lower. Once trend-following signals have all turned bearish, however, further substantial selling would likely require a different scenario: discretionary traders and macro funds building large outright shorts while reserve managers continue to buy. That appears less likely.
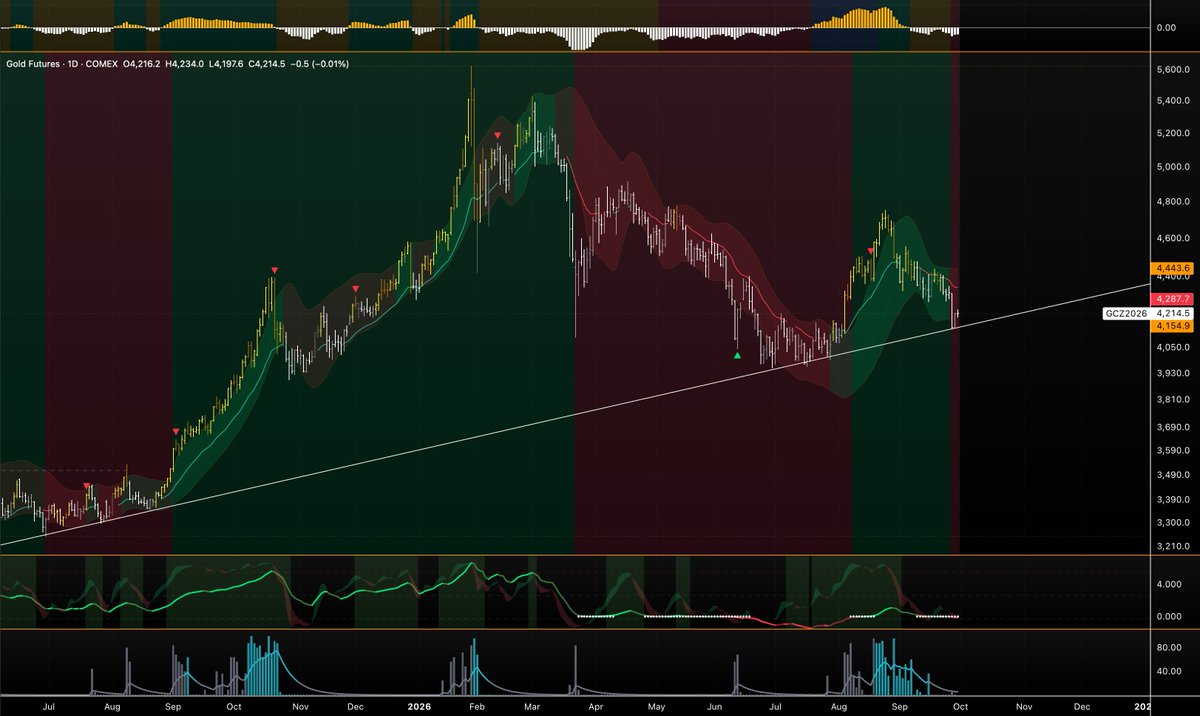
5/ The next upside trigger for gold CTAs is $4,321, associated with potential buying of 12%; the next downside trigger is $4,177, associated with potential selling of 11%. The downside trigger is marked as the closer of the two to the current market. A sharper decline could still expand the net short further, while an advance would prompt some short covering.
Time to level up in the game.
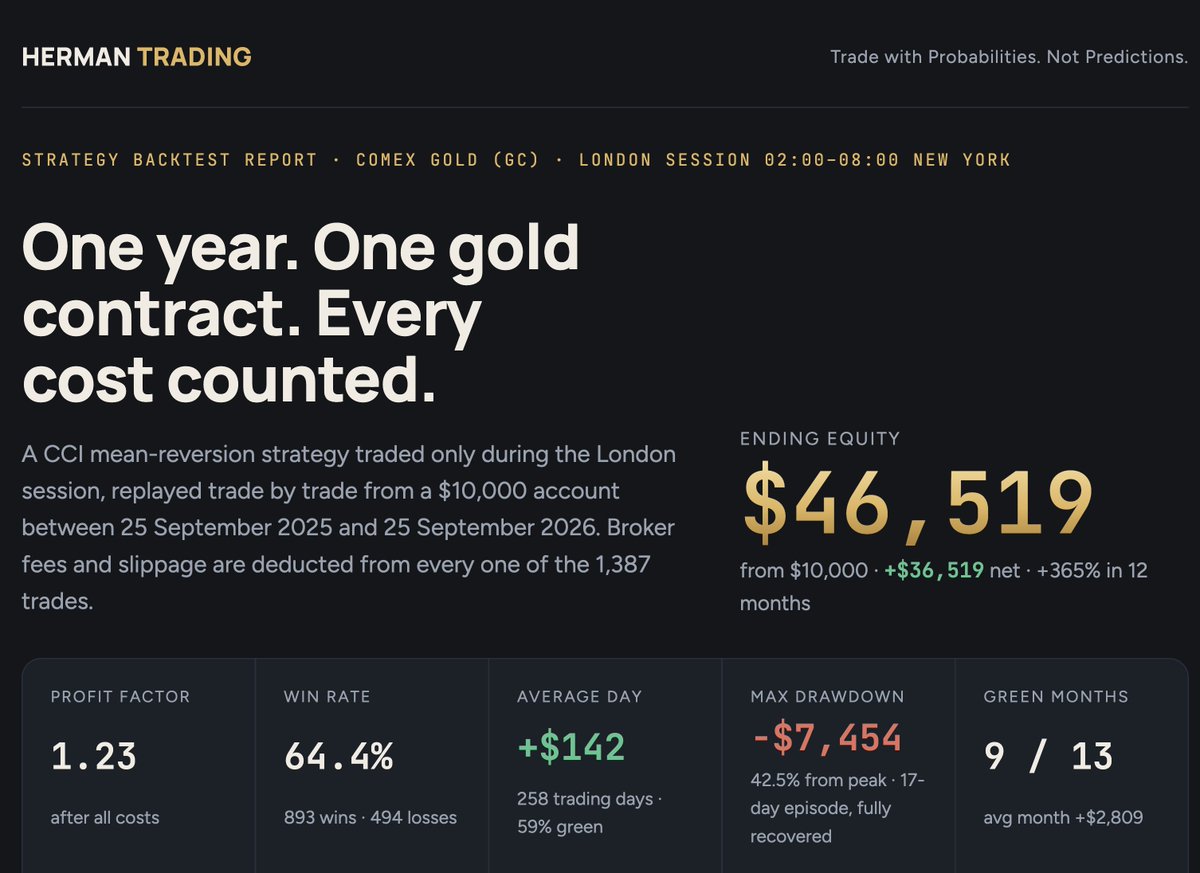
Next stop: a $10,000 personal futures account.
One Gold contract.
London session only, 2–8am
One strategy, 100% automated - my hands never touch an order.
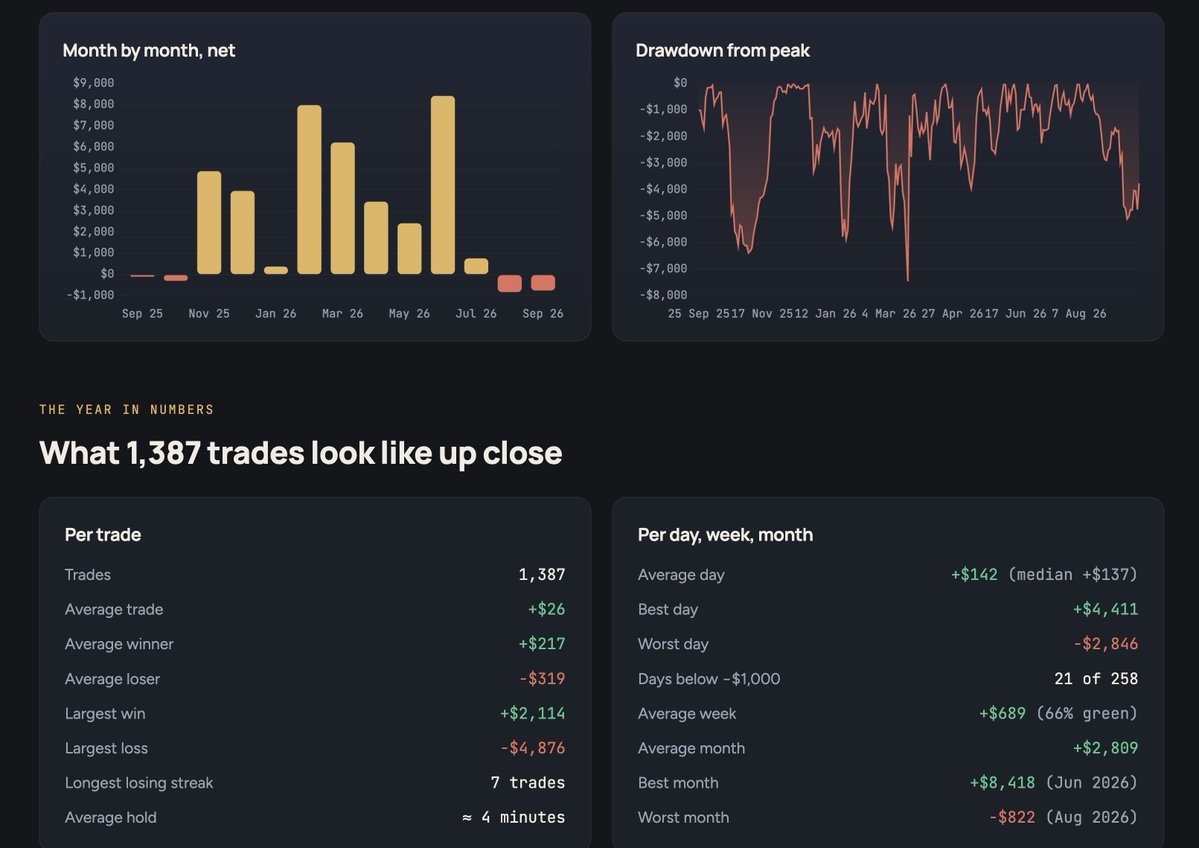
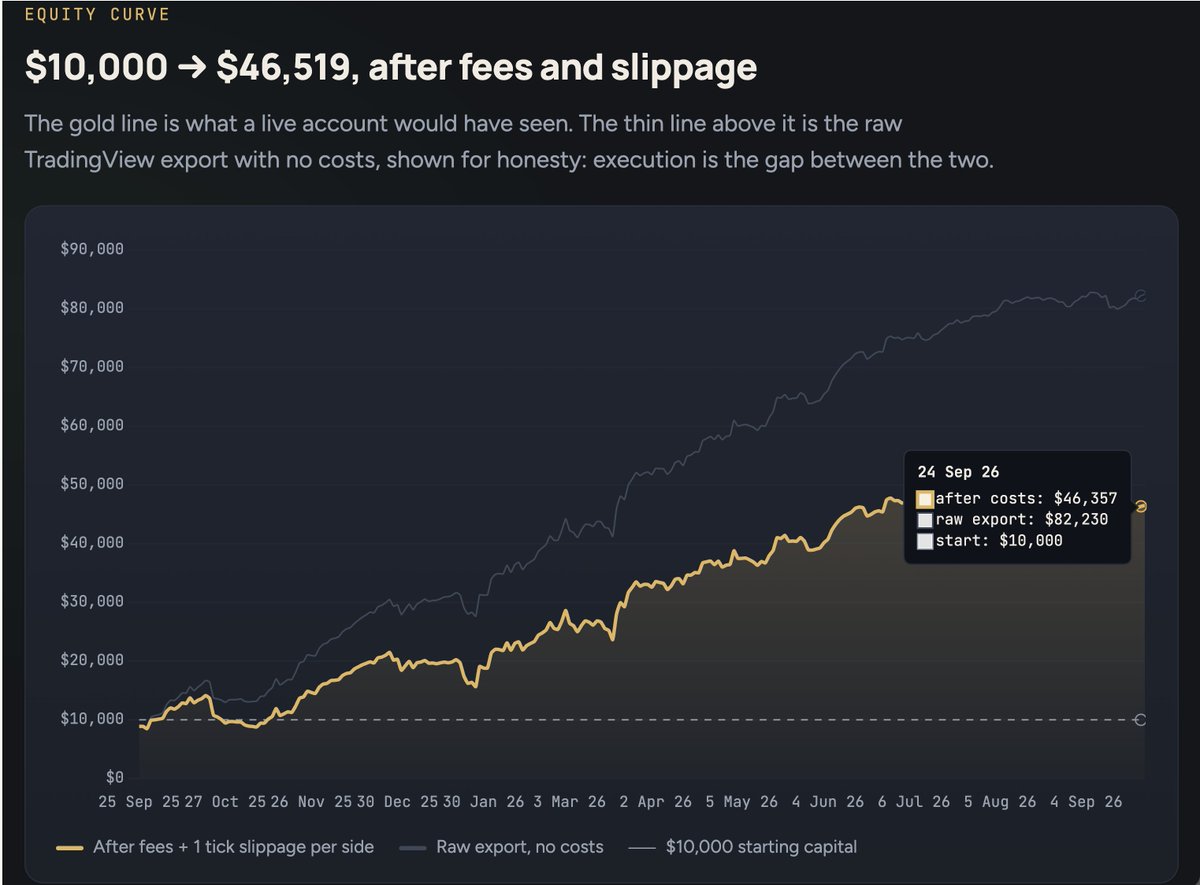
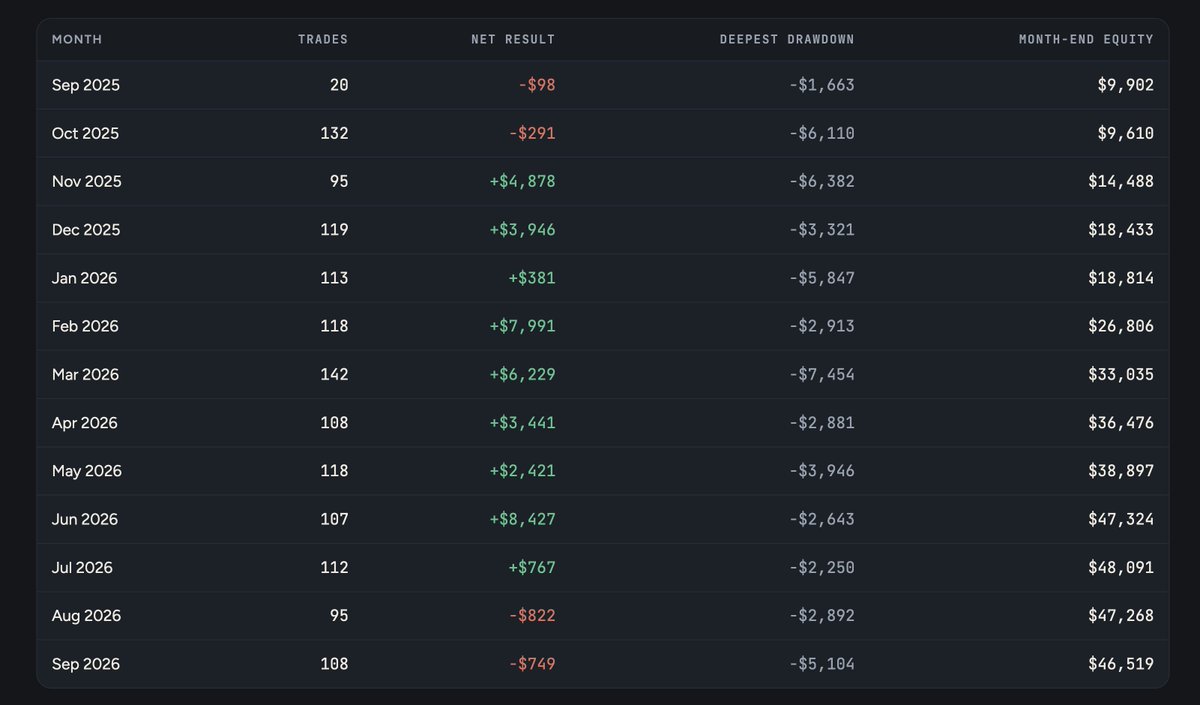
$10,000 → $46,519
+$142 a day on average
9 of 13 months green
Worst drawdown −$7,454, back at highs 17 days later
Then I reshuffled that year 5,000 times.
The account survives 92% of them.
Not a promise.
A bet with my own capital, and I know exactly what I'm betting on.
When it goes live, the real statement gets posted next to the backtest every month.
Green or red.
The game just changed. Watch this space.
Larry Williams turned $10k into ~$1.1M (11,376%) in the 1987 Robbins World Cup by trading T-bond and S&P futures.
He used a conditional approach: COT reports for directional bias from commercial positioning, seasonality and cycles for timing, plus technicals like Williams %R and volatility breakouts for entries/exits.
The real driver was extremely aggressive money management—risking up to ~20-30% of equity per trade (Kelly-style sizing) and scaling up as the account grew. Equity peaked near $2.2M, dropped to $750k in the October crash, then recovered.
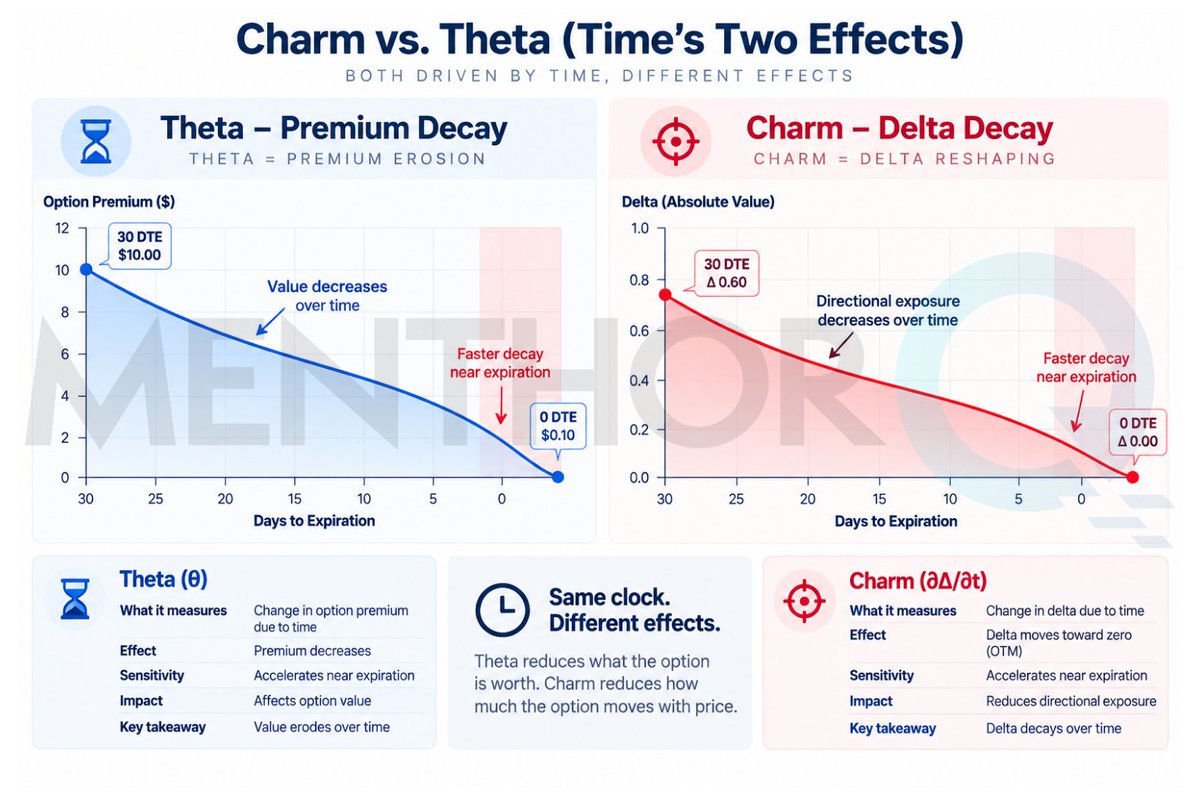
1/ Two Greeks dominate time decay, but they're not the same thing.
Theta = the rent you pay (or earn) holding an option each day
Charm = how your directional exposure shifts as days pass
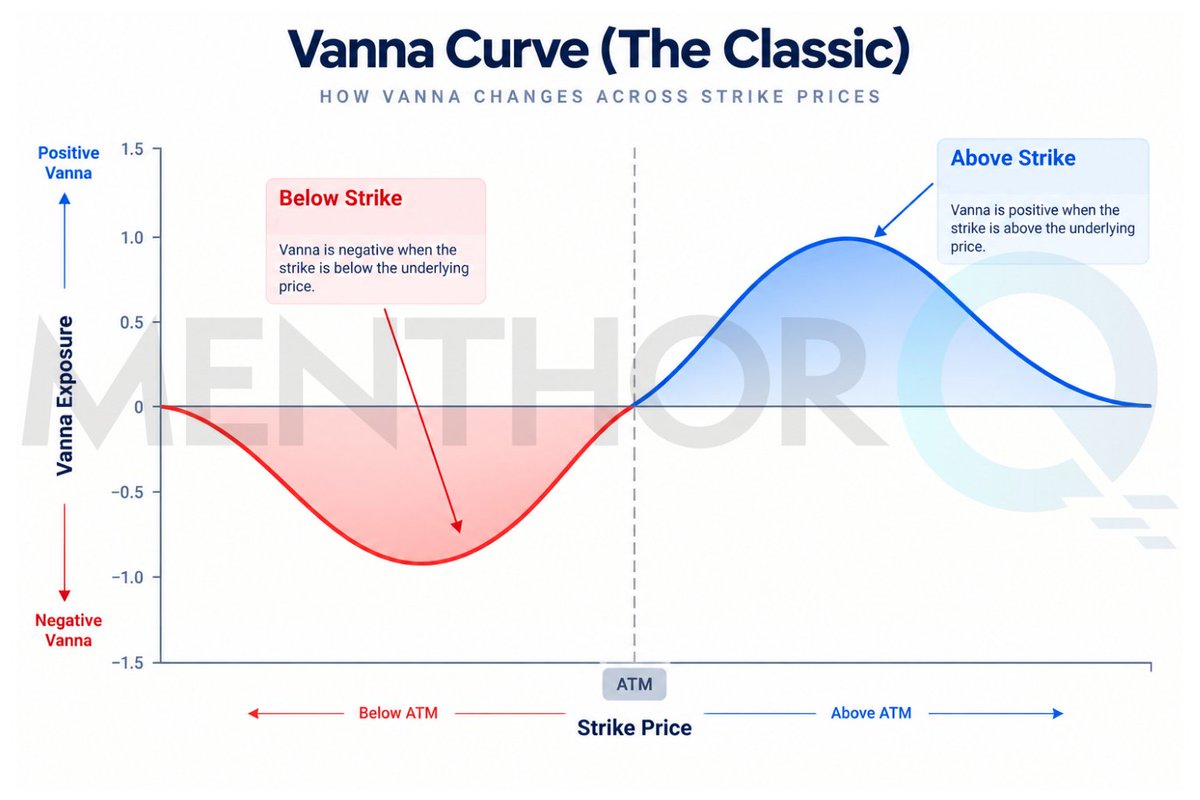
Vanna helps explain how changes in implied volatility can reshape dealer hedging flows even without a major move in price.
Gamma reacts to price. Charm reacts to time. Vanna reacts to volatility.
Together, they reveal a deeper layer of market structure.
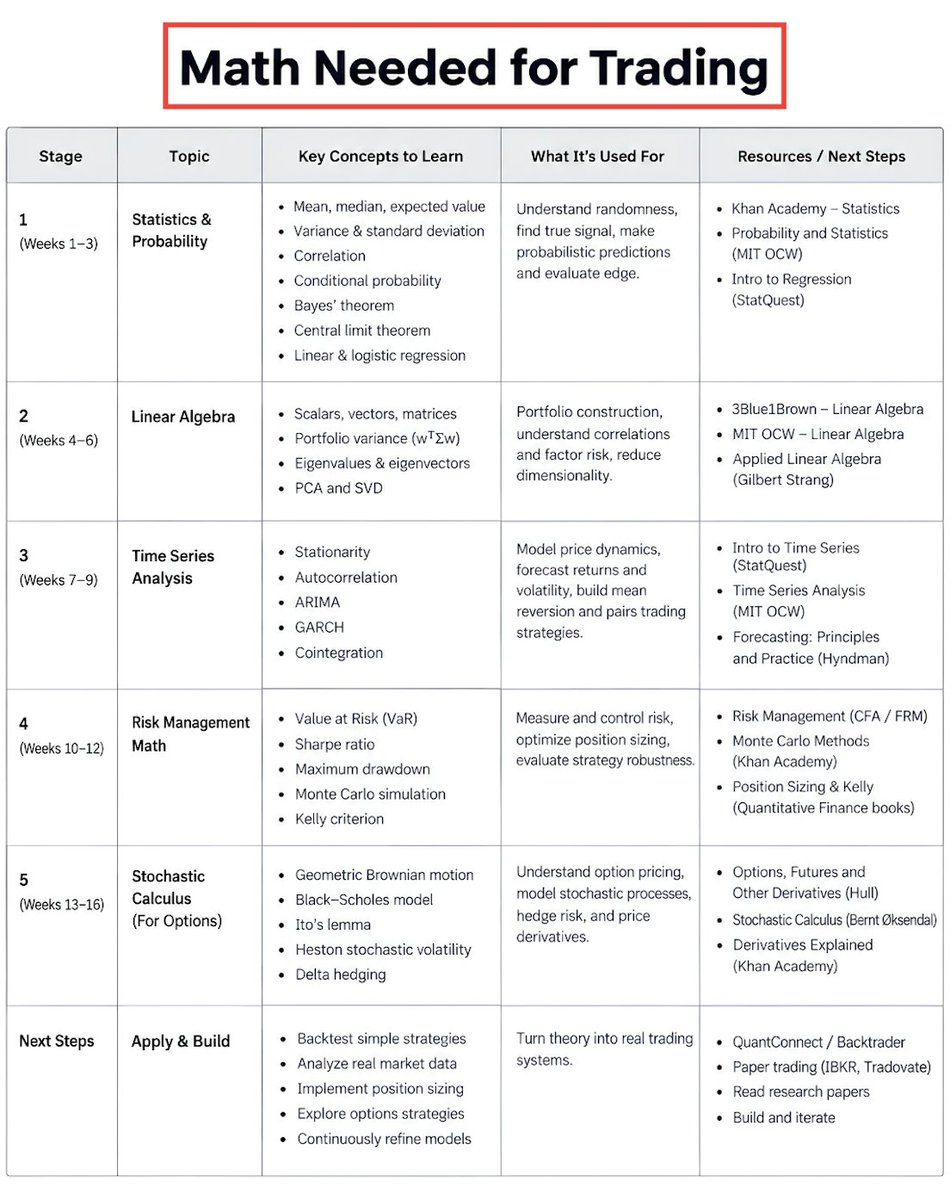
THE MATH NEEDED FOR TRADING (COMPLETE ROADMAP):
today I'll will break down the essential math you need for trading & this is the exact roadmap that helped me personally
when i started, i thought math was for interviews, two months into live trading i realized every position i took was pure math running in production
here's the complete map of what math actually fires on real trades:
---------------
1. statistics and probability
every price move is signal plus randomness. statistics separates the two
what you need:
> mean, median, expected value = EV formula (win% × avg win) - (loss% × avg loss) is what you're actually maximizing
> variance and standard deviation = foundation of every position sizing formula, becomes volatility when applied to returns
> correlation from -1 to +1 = tells you if strategies are actually independent
> correlation 0.9 across 3 strategies = you have one strategy dressed as three
> conditional probability = the biggest edge upgrade retail misses. P(win) = 55% unconditionally, but 70% when VIX < 15
> Bayes' theorem = how you update beliefs when new information arrives. never work with static beliefs
> central limit theorem = why portfolio-level statistics behave cleaner than individual trades
> linear and logistic regression = building blocks for mean reversion and binary prediction
---------------
2. linear algebra
the moment you hold multiple positions, you're doing linear algebra whether you know it or not
what you need:
> scalars, vectors, matrices = your portfolio is a weighted sum of vectors
> portfolio variance = w^T Σ w. not the sum of individual variances. one matrix operation
> eigenvalues and eigenvectors = reveal where risk actually lives. in a 500-stock universe, top 5 eigenvectors explain 70% of variance. the other 495 are noise
> PCA and SVD = reduce 50 correlated indicators into 5 independent factors explaining 90% of variation
---------------
3. time series analysis
markets have memory. today's price depends on yesterday's. volatility clusters. trends persist
what you need:
> stationarity = assumption most statistical tests make, but markets aren't stationary, this is why strategies decay when regime shifts
> autocorrelation = positive means momentum, negative means mean reversion, zero means random walk
> ARIMA = framework for forecasting returns and volatility
> GARCH = formalizes what every trader knows, volatility clusters. after a big move expect more volatility
> cointegration = the foundation of pairs trading. two assets can both trend but their spread stays stationary
---------------
4. risk management math
edge doesn't matter if you size wrong
what you need:
> Value at Risk = 95% VaR of $5,000 means 95% of the time you won't lose more, but 5% of the time you might lose much more
> Sharpe ratio = (return - risk-free rate) / volatility. institutional threshold is Sharpe > 1.5 before deployment
> maximum drawdown = biggest peak-to-trough loss. more intuitive than volatility for most traders
> Monte Carlo simulation = randomizes trade sequencing to show the range of possible outcomes
> Kelly criterion = f* = (bp - q) / b. professionals use 0.25x to 0.5x fractional Kelly because your true edge is never certain
---------------
5. stochastic calculus (for options)
if you trade options, every price on your screen came from a stochastic differential equation
what you need:
> Black-Scholes = dS = μS dt + σS dW. the underlying follows geometric Brownian motion
> Ito's Lemma = why the σ² term exists. this is why gamma exists
> Heston stochastic volatility = dv = κ(θ - v)dt + ξ√v dW. captures the volatility smile that Black-Scholes misses
> delta hedging = stochastic calculus running in production. every rehedge is dictated by the SDE governing the underlying
---------------
MINIMUM TO START
you don't need everything above to start
for your first backtest:
> mean, median, standard deviation
> correlation
> basic probability
> Sharpe ratio and max drawdown
start with statistics, that alone separates you from 95% of retail traders
---------------
every real trade is math executing in production:
> entry = conditional probability
> validation = statistics
> portfolio = linear algebra
> sizing = Kelly optimization
> risk = VaR, Sharpe, max drawdown
> options = stochastic calculus
the traders who make consistent money see markets as continuous equations, everyone else guesses
if you're a complete beginner shoot me a DM and I'll share the resources with you
MATH IS EVERYTHING <3
The Secret Formula for Trading Success:
🔻🔻🔻
p
(K+B)
S = ────── x Log( C )
(F+E)
Where:
S = Success in trading
K = Knowledge about the market (measured in books read or videos watched)
B = The number of times you’ve listened to "Buy low, sell high"
P = Patience (measured in cups of coffee consumed while waiting for the right trade)
F = Fear of missing out (FOMO) incidents per week
E = Emotional decisions made (preferably zero)
C = Confidence (boosted by every profitable trade)
So remember,
keep your K and P high, and
F and E low for maximum S!
It's the old man yelling at clouds thing. I get it. I started back when you had to write tight code. Hardware was much more expensive. I would say the transition to looser code (I won't call it slop but it is) started around 2000. Even when we transitioned off Microsoft Assembler in the early 90s to C (and eventually C++) we'd still use inline assembly code to optimize things like loops. I did that until my last professional days of coding in 2015. The compiler would still put out trash because it had to be generic. Maybe one day AI will gen code on par with humans. But not right now.
1/ Most futures traders don’t fail because they lack effort.
They fail because three structural mistakes compound over time:
Lagging signals. Misunderstood risk. Misused leverage.
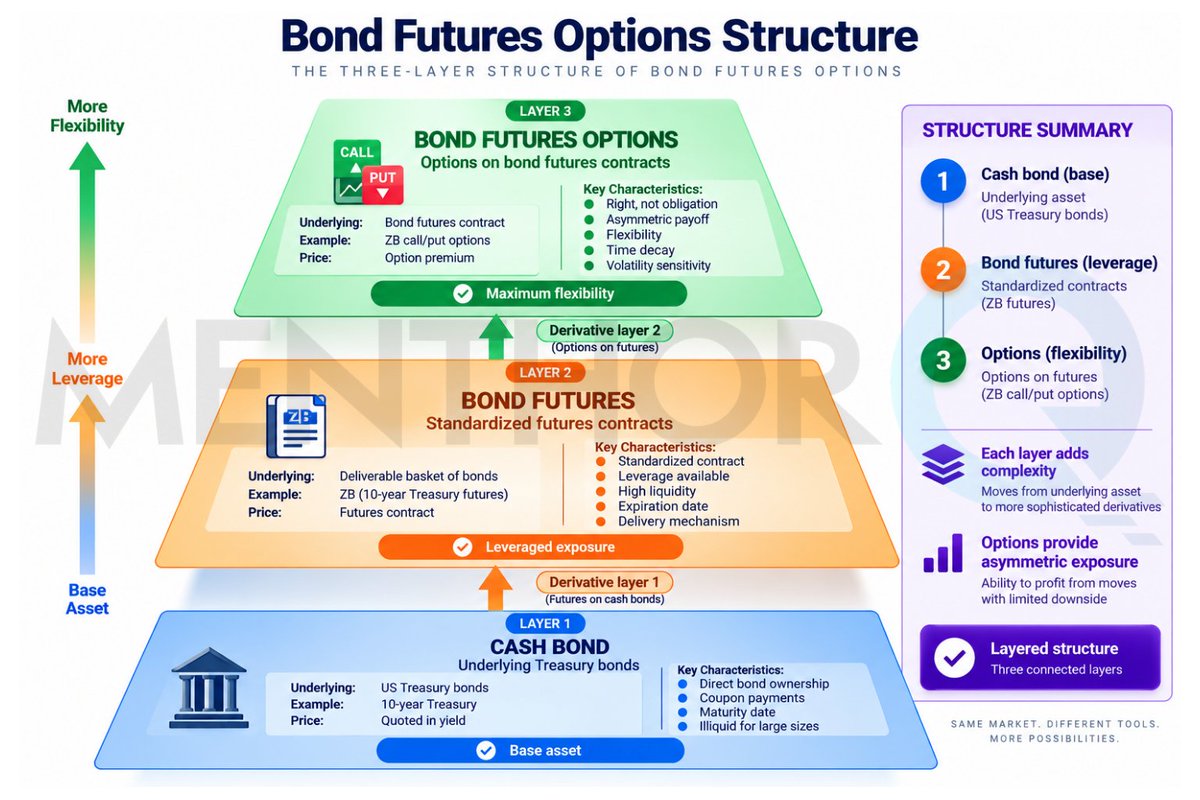
Bond futures options aren’t just about direction.
Gamma Levels help reveal where dealer hedging may pin price, create mean reversion, or accelerate a breakout adding positioning context to rates and volatility.
Understand the positioning behind the move.
Quants - Sharpe, Sortino, and other informational bullshit.
Dumb Retail Traders - profit factor, win rate, R:R, max drawdown, expectancy
Institutions want smooth, predictable, non-correlated returns.
Dumb Retail Traders want cash flow to pay bills and should be concerned about expectancy and capital preservation. If your expectancy is positive and your max drawdown keeps you away from financial ruin you can shove your Sharpe ratio up your ass.