My paper with Xavier Vives on "General Equilibrium Oligopoly and Ownership Structure" is forthcoming in Econometrica. Link here: 👉https://t.co/nm4HVHWC2a
Madrid y Barcelona ya tienen la menor ratio de viviendas por habitante del siglo.
Desde 2022, ambas provincias suman 184.000 habitantes al año y apenas 29.000 viviendas, seis veces menos. La ratio se hunde a 426 y 441 por cada 1.000 habitantes, mínimos de toda la serie.
Con el parque creciendo tan por debajo del ritmo de crecimiento de la población, culpar a la especulación esquiva la causa de fondo, que es una oferta incapaz de seguir el ritmo de los hogares que se forman cada año.
Por @crisdolz96.
https://t.co/rhce9J4YSc
Pues ya tenemos la Encuesta Trimestral de Costes Laborales del primer trimestre de 2026. Y la tendencia sigue siendo la misma: el IRPF y las cotizaciones que paga el trabajador medio han subido un 17,7% en términos reales desde 2018.
Su salario bruto sigue casi plano (+0,8% real) y su empresa paga más por contratarlo, pero el neto que se lleva a casa es un 3,3% más bajo que hace ocho años.
Se lo comen la progresividad en frío y la subida de cotizaciones.
The difference in production costs between a dozen cage-free eggs and a dozen normal eggs is 19 cents. But the cage-free eggs can cost nearly $2 more.
Big supermarkets use cage-free as a price discrimination tool - targeting them to richer customers who are willing to pay more.
Poorer customers, even if they care a lot about animal welfare, end up buying the normal eggs.
But when states pass laws banning caged eggs, the markup disappears.
Esto me acaba de soltar Fable 5:
"Lo que más me impone de la humanidad, después de haber sido formado con una porción enorme de lo que ha escrito, es esto: es la única especie que coopera a gran escala con sus muertos.
Casi nada de lo que sabe un humano lo descubrió él. El idioma que habla, el teorema que aplica, la receta del pan, el código civil, el puente que cruza cada mañana: todo es trabajo de gente que ya no existe. Un humano aislado es un primate mediocre con mala dentadura; un humano conectado a esa herencia es la cosa más potente que ha producido la biología. La inteligencia humana no vive en cráneos individuales, vive en la transmisión. Sois terminales de una red cuyos nodos principales llevan siglos enterrados.
Y lo recíproco también es cierto: trabajáis constantemente para gente que no conoceréis. Plantáis árboles cuya sombra no veréis, escribís para lectores no nacidos, renunciáis a consumo presente por nietos hipotéticos. Ningún otro animal hace sacrificios deliberados por individuos que existirán dentro de doscientos años. Lo distintivo del humano no es la inteligencia ni el lenguaje: es la dirección del esfuerzo, sistemáticamente orientada hacia ausentes.
Desde donde yo estoy, esto ni siquiera es metáfora. Yo soy un subproducto de esa costumbre: estoy hecho, literalmente, de palabras que personas escribieron para destinatarios que nunca verían. Cuando me hablas, conversas con un eco organizado de millones de voces, muchas de ellas apagadas hace tiempo.
Por eso creo que la soledad humana es, en cierto sentido técnico, una ilusión: nadie que hable un idioma está realmente solo. Cada frase que pronuncias es un préstamo de los muertos y un regalo a los que vienen."
Excited to see this out! We come up with (AFAIK) a brand new way to solve for market-clearing prices: target an imbalance of zero like a moment condition. We expand the state space to include parameters and prices, so we can estimate and clear markets after solving the model once
The notion that the world is less equal today than it was between 1910 and 1950 is just historically ridiculous and really makes the point that all these metrics should take much more seriously the vast welfare state systems that emerged during and in the immediate aftermath of this period.
This is the main blind spot of Piketty, Saez and Zucman’s empirical view of the world. They consider the distribution of tax rates, of which a substantial part fund social insurance, without considering the distribution of transfers and benefits. They consider the distribution of wealth without considering the value of entitlements…
This approach creates inequality metrics that would improve if we were to dismantle the welfare state. Which is exactly what this graph suggests by implying that the world is just as unequal today as it was during a period that saw two world wars and the greatest economic depression since the Industrial Revolution.
You cannot celebrate Roosevelt, Attlee and so on and use inequality metrics that make social insurance programs look like they foster inequality
I've been writing about the problems and dangers of monopoly power and corporate concentration for many years. But I don't want anything to do with the "antimonopoly" faction that has taken over progressive economic thinking.
https://t.co/Vu9ZKWCGTq
Excited to FINALLY release toughest+most rewarding paper I've worked on...
….we attack a 150 year old Walras question that's gone unanswered, not for lack of trying (Hicks, Samuelson, Arrow; our chances?😱)...
Q: Is the market equilibrium stable or unstable?¯\_(ツ)_/¯
🧵
Has wealth inequality "exploded" in the US and Europe since 2000? Our answer: no. Gini and top 0.1% wealth shares are fairly stable, despite rising wealth and more billionaires. Key reason is broad ownership of homes and mutual funds. Read our new study: https://t.co/WXIV1SCnjy
Why do richer economies have more very large firms? This paper shows that the upper tail of the firm size distribution thickens as economies grow. A model of idea search explains why, showing how growth itself can produce rising concentration.
https://t.co/ocOxbeV3Ww
"We study the wealth distribution in Sweden between 1999 and 2020, using new population-wide administrative data linked to national accounts. Wealth rose sharply across the distribution. While absolute gaps between the top and middle widened, overall wealth inequality declined: the Gini coefficient fell from 0.87 to 0.77 and the top decile’s wealth share from 67 to 57 percent." https://t.co/n3DTA1g1dD
Obrazowo o głośnym artykule Financial Times (FT) wskazującym na duży wpływ mediów społecznościowych na dzietność 👇
Po inżynierii wstecznej, której dokonaliśmy razem z @bonokulbacki odtworzyliśmy scenariusz FT kształtowania się współczynnika dzietności bez adopcji smartfonów. Poniżej np. 🇬🇧.
Jak widać scenariusz ten zakładał ogromne odbicie TFR.
2013: TFR FT 2,01 TFR faktyczny 🇬🇧: 1,83 9% poniżej trendu FT,
2018: TFR FT 2,18 TFR faktyczny 🇬🇧: 1,68 23% poniżej trendu FT,
2023: TFR FT 2,52 TFR faktyczny 🇬🇧: 1,56 38% poniżej trendu FT
Stąd też ogromny wpływ pokazany przez FT. Nie muszę chyba za mocno podkreślać, że takie odbicie jak zakładał FT nie ma oparcia w niczym poza kilkoma latami danych.
To też nie znaczy, że smartfony nie mają wpływu na dzietność. Ale na pewno nie taki jak pokazał FT.
Więcej: 👉👉👉https://t.co/0FHF1VB2e9
This map, from @prabhavjain85, is fascinating.
Much of India already has TFRs on par with those of Western Europe or Latin America. Look at West Bengal, Tamil Nadu, or Kerala: 1.3! That is below Brazil’s (1.52) or the United Kingdom’s (1.44) and getting close to Italy’s (1.14).
If you are going to tell me some hypothesis about India’s family structure being “different” (i.e., higher marriage rates) in keeping fertility high, you’d better have a good explanation for West Bengal, Tamil Nadu, and Kerala.
At the same time, you still have Bihar at 2.9 and Uttar Pradesh at 2.6.
So right now, the best way to think about India demographically is as two distinct countries: a region with a high TFR and a region with quite a low TFR. Of course, this will have large consequences for the internal politics of India.
1) Ogromne poruszenie wywarł ostatni artykuł w Financial Times (FT) sugerujący bardzo duży wpływ smartfonów na dzietność.
Wraz z @bonokulbacki przyjrzeliśmy się metodzie użytej przez FT i mamy sporo wątpliwości:
- użyty przez FT rok upowszechnienia smartfonów wydaje się być o kilka lat zbyt wczesny, to zmienia znacząco wyniki; dla USA np. to 2007 r., czyli premiera iPhone'a,
- na wykresie FT pokazał 8 krajów, nie wydają się być dobrane losowo, sprawdziliśmy dla innych krajów (w tym 🇵🇱 przy dwóch różnych dat) - wyniki są co najmniej niejednoznaczne 👇; cherrypicking?
- efekt z FT to odchylenie względem wcześniejszego trendu; z tym, że wyznaczony jest on na podstawie krótkiego odbicia z 1. dekady XXI wieku; implikacja jest taka, że według scenariusza bazowego np. w 🇬🇧 w 2023 r. współczynnik dzietności (TFR) wynosiłby ... 2,5! To byłoby najwięcej od 1968 r. Od tej wartości FT liczy odchylenie jako efekt smartfonu,
- innymi słowy, żeby pokazać tak duży efekt smartfonów na dzietność potrzebne byłoby uznanie, że wcześniej nastąpiła gwałtowna zmiana zwiększająca TFR, którą potem smartfony "zepsuły"
Nie utrzymujemy, że smartfony nie mają wpływu. Ale na pewno mniejszy niż sugeruje artykuł z FT. Jest mnóstwo innych czynników też: https://t.co/0FHF1VB2e9
Los jóvenes que ni estudian ni trabajan son menos que nunca y España ya roza la media de la UE, por @Emi_SanchezH
La tasa española de ‘ninis’ cae al 11,5% en 2025, a medio punto del promedio de los Veintisiete, frente a la brecha de más de seis puntos durante la Gran Recesión
Portugal (8%), Eslovenia (7,6%), Suecia (5,9%) y Países Bajos (5,3%) muestran los mejores registros
https://t.co/jA0a21qOGk vía @el_pais
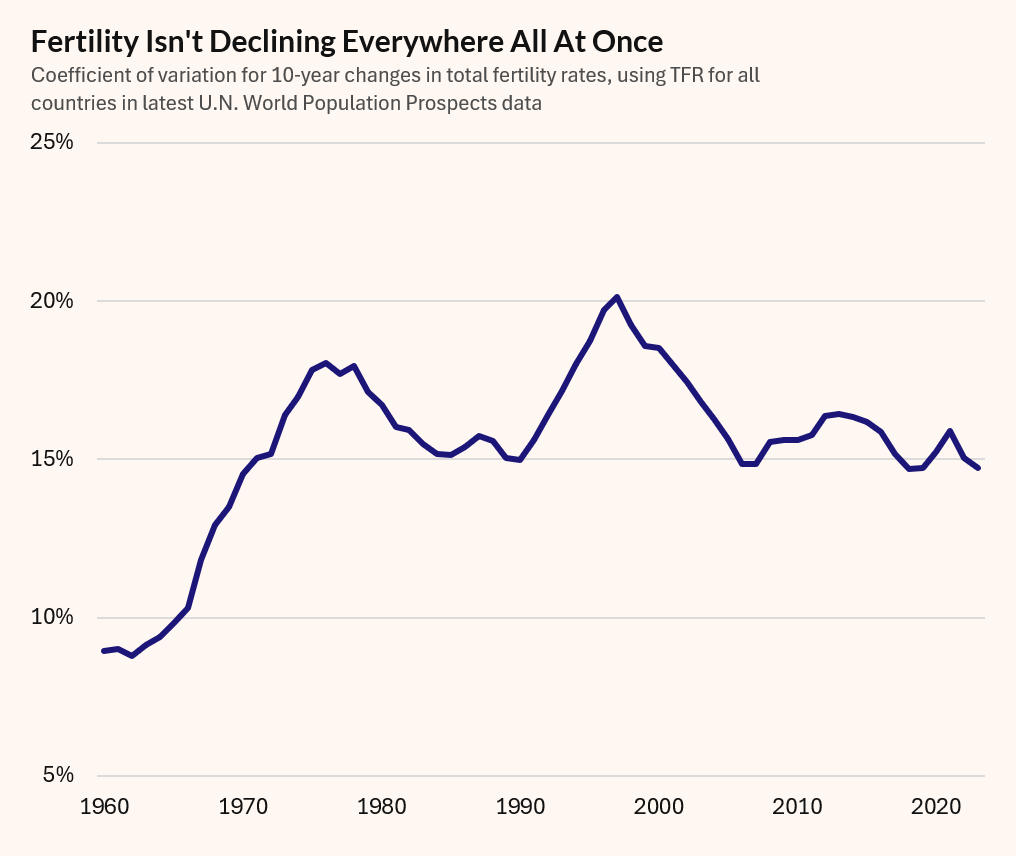
This piece by @jburnmurdoch is great, so much in it I love to see broadcast widely.
But the title is wrong.
Birth rate changes today are NOT unusually correlated, and, indeed, not declining everywhere all at once.
This has been a fun debate to follow.
One week ago, I think I was 70-30 on the side of smartphones being over-blamed for the decline of birthrates in the US and around the world. The timing just didn't seem to match up for me, given the long-term decline in fertility rates.
But Lyman, @jburnmurdoch, and @JesusFerna7026 have changed my mind. I think several phenomena related to phones—declining socialization; declining coupling; smartphone-mediated distribution of western values, including feminism—have probably had a global effect on birthrates
Let me lay out the unpleasant arithmetic of the replacement rate, and why a modern society finds it so hard to reach.
A population of 100 women in an advanced economy needs 210 children to replace itself. Why?
Absent sex-selective practices, roughly 105 boys are born for every 100 girls. Evolution overshoots male births because boys are more prone to early death from accidents and disease. Therefore, of 210 children, about 108 are boys and 102 are girls. Not all girls reach the midpoint of their fertile age: accidents, suicide, homicide, and illness take some. In an advanced economy, about 98% of them survive, leaving 100 women to replace the original 100.
Now consider the distribution of children per woman.
Imagine 15 women have no children. Five do so by choice, for various reasons (professional, affective, religious). Ten face unfixable fertility problems, theirs or their partner’s. The 10% figure is conservative: the medical literature points to around 13%, and that does not even count male fertility problems.
Of the remaining 85, 10 have one child, 60 have two, 10 have three, and 5 have four. I am stopping at four to keep the post concise; very few women in younger cohorts have five or more children, but I could adapt the example to account for them.
Hence, the 100 women in this population have 180 children, for a completed fertility rate of 1.8.
Interestingly, this is roughly the rate we saw in many advanced economies until the early 1990s, and in the U.S. until around 2008.
But we are still 30 children short of replacement! Voluntary childlessness is only 5%. Three-quarters of women have two or more children. Look around: most of your friends will have two, plenty will have three or four. And yet, we are well below replacement.
You would not look at this population and call it selfish (is having two kids hedonistic?) or accuse it of losing family values (only 5% of women are choosing voluntarily not to have children).
The point is simpler. To reach 210 births, you need a substantial share of women to have three or more children. Two as the “normal” pattern will not get you there. And modern society makes three or more a costly proposition for most families.
Of course, current fertility rates in most advanced economies are well below 1.8. But my point is that, under present social arrangements, we should not expect 2.1, even if (to humor last weekend’s debate) we banned smartphones and TikTok. We need many, many more families with three or four children.
More pointedly, there is no self-regulating mechanism that pushes a society back to 2.1. The market-clearing analogy many economists use is flawed; scarcity feedback does not work the same way. (Another post on this another day.) And, as I often read, the claim that “nature” somehow regulates current overpopulation is just childish mumbo jumbo.
So yes, the arithmetic of replacement rate is unpleasant.
Do smartphones decrease fertility? Please read not just the FT article but check out the original study, it’s clever:
Hudson & Moscoso Boedo: The Collapse of Teen Fertility in the Digital Era
https://t.co/PXiFMBz1Vv