Those final edits are a huge headache using natural language and surprisingly easy in most design software.
Nobody has tackled all of this yet. If you know anyone working on it, let me know.
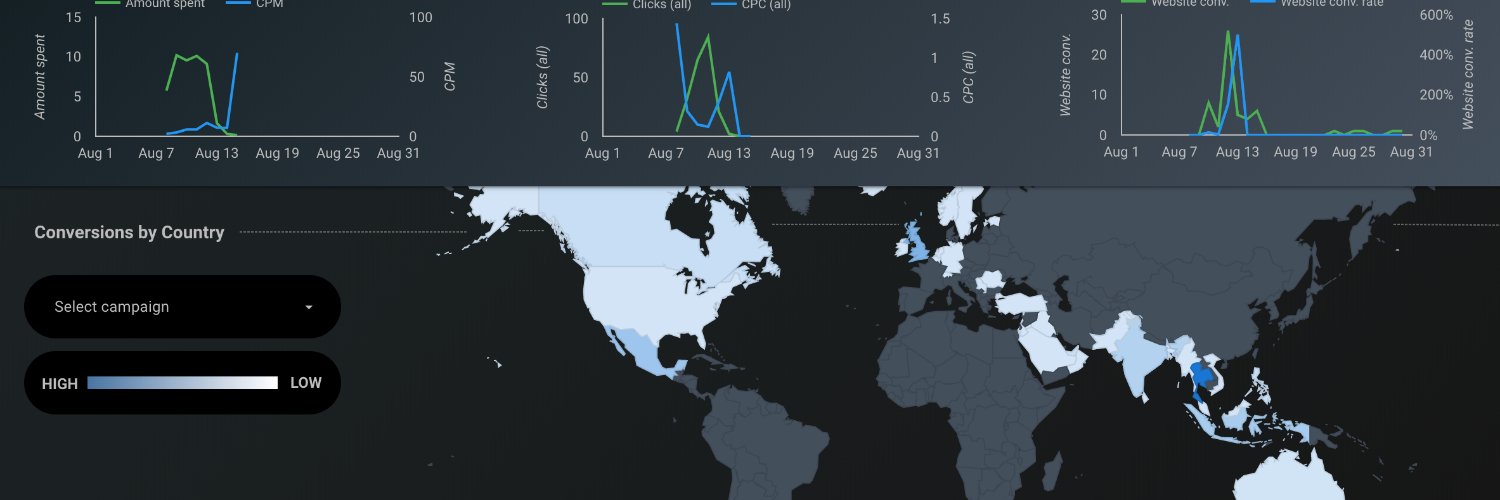
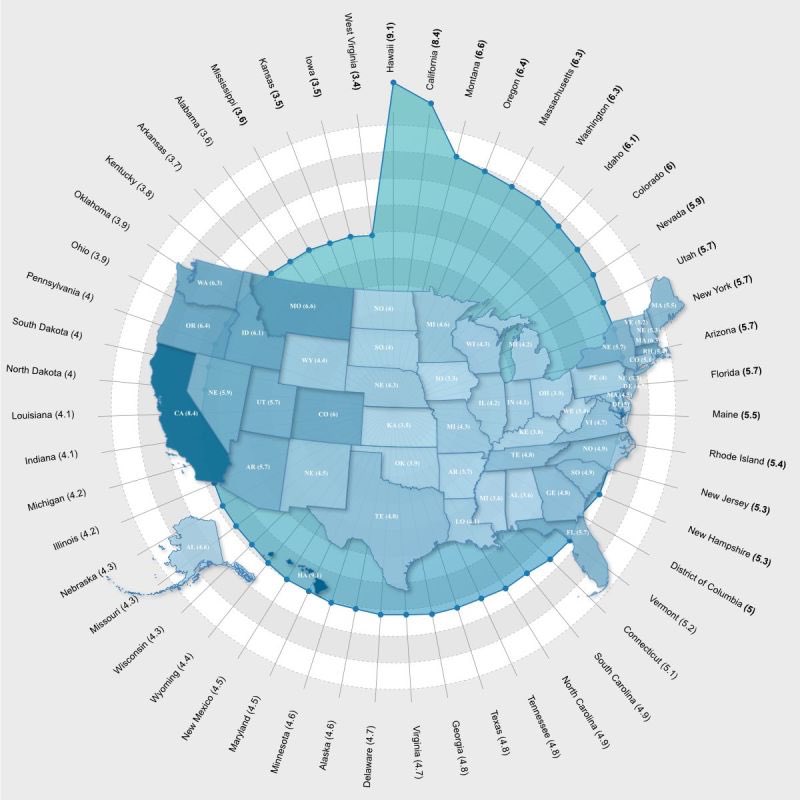
I think *most* intermediate Excel users can now use Copilot, ChatGPT or Claude to build custom-coded visualizations using D3 or Plotly. The skills gap is basically gone but…
for fine tuning that last 10%. Inevitably you won’t be able to get a certain gradient right, or you’ll have one weird label that just doesn’t work, or the transparency needs to be adjusted and LLMs will keep getting it wrong.
@levelsio@followmarcos If they had just taken the time to actually nail the execution of the design, then I think it would genuinely have had a chance. But the only good design is the physical build quality. UI/UX.... arguably the most important part of the product, seems like it took a backseat.
@levelsio How much of the price increases/housing price changes have to do with Digital Nomads vs other factors? Just curious to hear your opinion. People seem to blame DNs for this but I imagine it's more than that.
@thesamparr@Reedjd He's got some interesting perspectives on where you can actually build relationships with your audience - I'd like to hear more about what he thinks the Tik-Tok types can do to strengthen those audience relationships.
@SineadOS1@benmcredmond@heyequals @martajamrr Yeah wow, this is definitely in my wheelhouse of spreadsheet+dashboard magic. I bet I could do some really cool stuff with this tool.
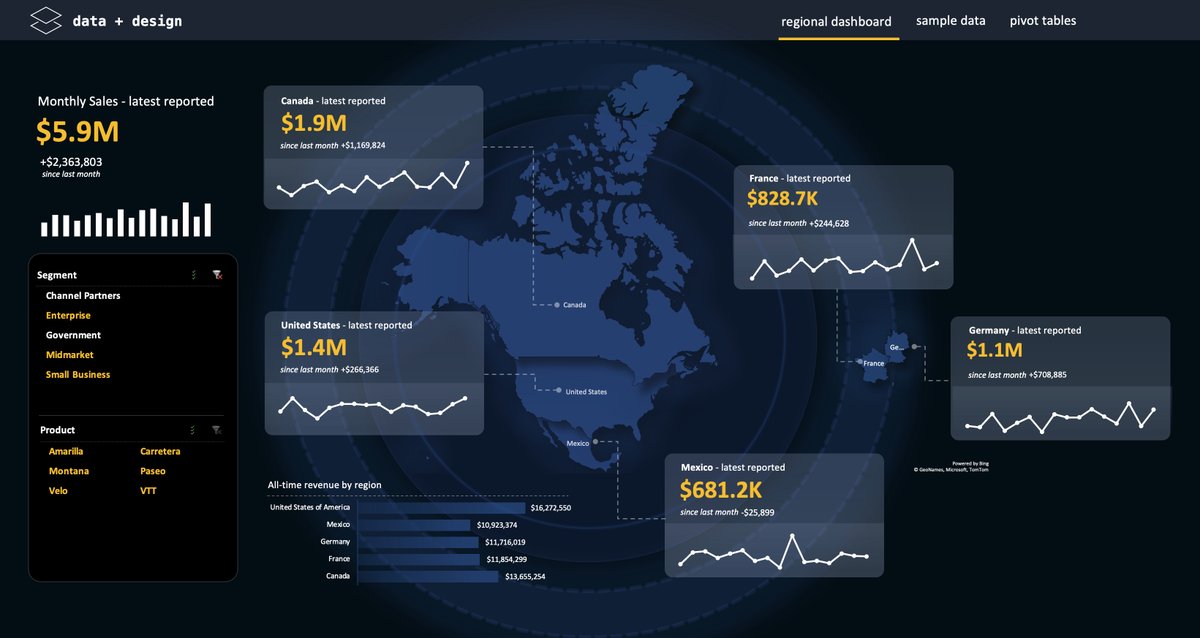
@RDondret Thanks! PowerBI is a great tool and there are many situations where it will work better than Excel, but I just like to show people that Excel can look just as good in terms of visuals. I think sometimes people don't realize that Excel can be more than a grid of cells.
I send out free templates (like this one) to my newsletter each month. You're welcome to join if you want to start learning how to build better dashboards in Excel. https://t.co/U2hc7yYDJY
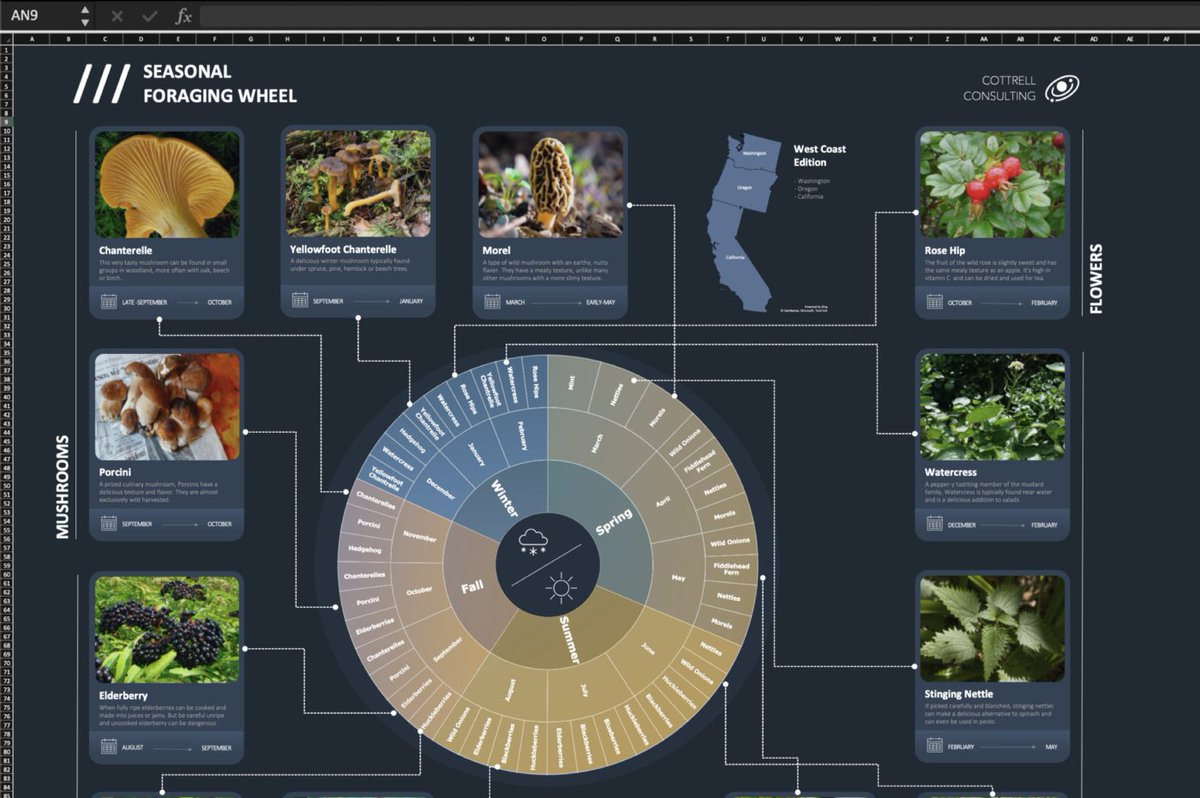
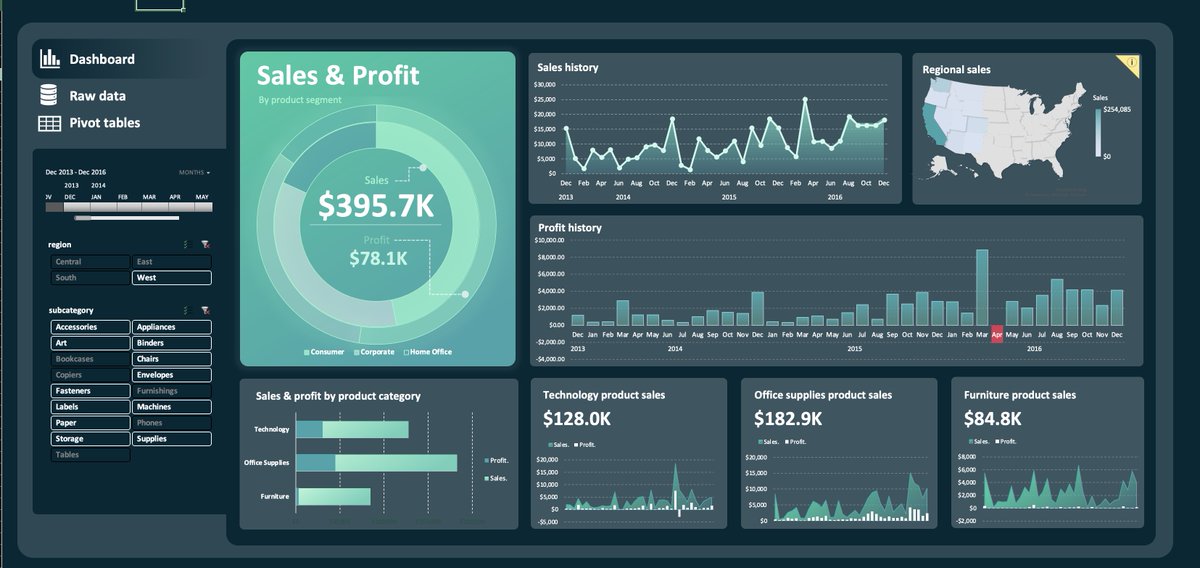
Excel may be your most overlooked design tool...
That's because of a few Excel features that you already know about but probably aren't using.
Here's how to use them so that you can make Excel look less like... Excel.
WIth a bit of creativity you can build powerful dynamic dashboards and visualizations that look great.
Here's a video walkthrough if want to see a live example: https://t.co/RcpPYOS8QN