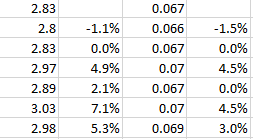
@draglikepull Other than goalie fatigue, or luck -- this has to be the answer. Your sig figs distort the changes. Here is your data as a percent change, makes the second look more impactful, though I don't have your data to include the extra decimal point.
@OleSuperSub@MikeKellyNHL@SensCentral it's a rate stat -- it includes every minute they were all playing together, divided into a rate. Time missed doesn't matter.
@draglikepull You shouldn't do it like that though. You're essentially calculating a mean (pts%) where OT games are weighted heavier than regulation games. You've done (2+3)/5 instead of (2/2 + 3/3)/2. Make OT magically worth 10 pts and see what it does to yours vs mine.