美股重大交易机会显现,MOVE指标告诉你
MOVE指标 衡量美国国债收益率/利率的不确定性;
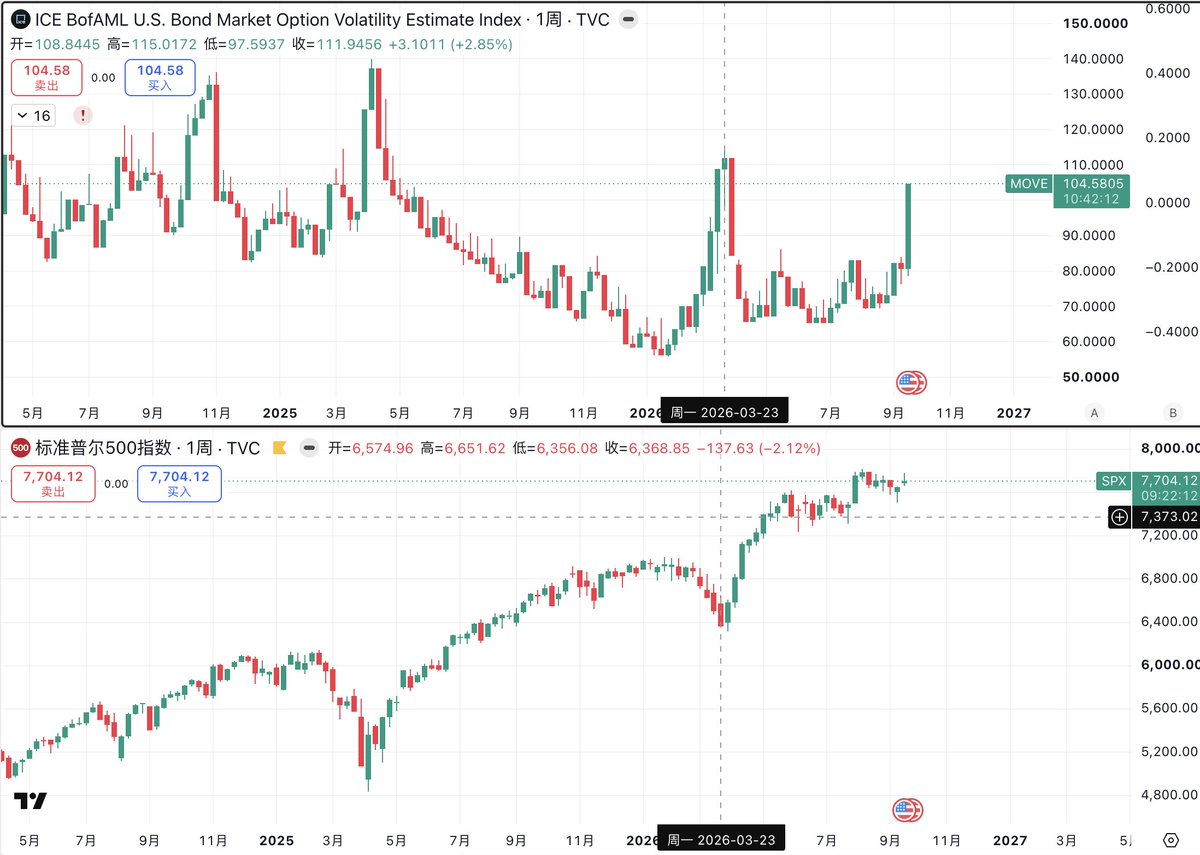
下图,是MOVE指标和SPX指数走势对比图,两者不直接关联,但呈现显著的负相关;
前面2次MOVE的高位,分别是25年4月,26年3月的美股大底;
MOVE可以简单理解为美债市场的 VIX,当MOVE出现极端高位后见顶回落,反而经常对应一个非常值得关注的风险资产(美股/加密币)买点窗口;
目前,这个窗口临近。
MOVE在高位,美债收益率在超高位,贝森特比我们更着急;
有些粉丝,被这两天的回调吓到了;
目前,不应该恐慌卖出,反而应该分批买入!
150买了点 $UPRO
60买了点 $TNA
点赞,关注,不迷路!
A major trading opportunity is emerging in U.S. stocks—and the MOVE Index is telling us why.
The MOVE Index measures uncertainty and volatility in U.S. Treasury yields and interest rates.
The chart below compares the MOVE Index with $SPX. While there is no direct one-to-one relationship, they have shown a notable inverse relationship during periods of market stress.
The previous two major spikes in MOVE coincided with major U.S. equity bottoms—in April 2025 and March 2026.
Think of MOVE as the VIX of the U.S. Treasury market. When MOVE reaches extreme levels and then peaks and starts falling, it has often created a buying window worth watching closely for risk assets—including U.S. equities and crypto.
That window may now be approaching.
MOVE remains elevated, while Treasury yields are at extremely high levels. Bessent may be even more anxious about this than we are.
Some followers have been shaken by the market pullback over the past two days.
This is not the time to panic-sell. I’m doing the opposite—scaling in on the dip.
Bought some $UPRO at $150.
Bought some $TNA at $60.
Like, follow, and stay tuned!
DAN ZANGER THE WORLD TRADER:
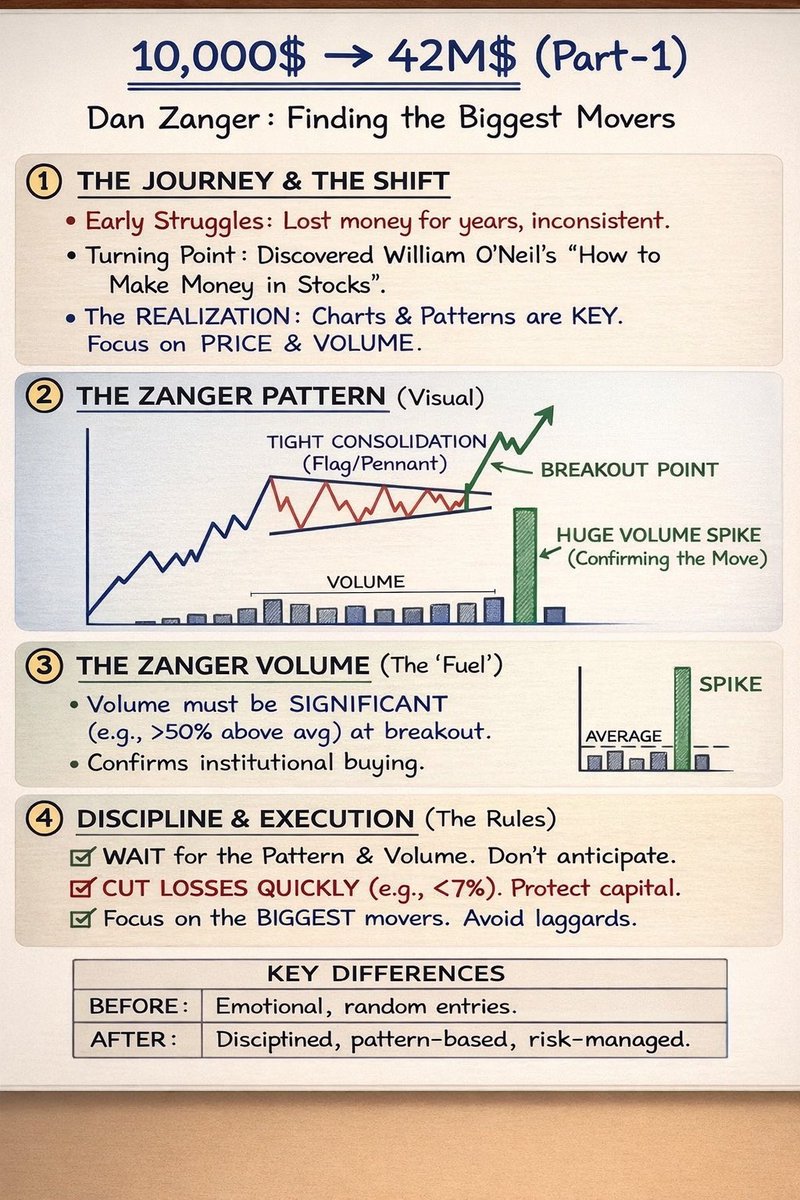
•Dan Zanger is best known for turning approximately $10,000 into over $42 million.
•This performance was achieved in less than two years, making it one of the most documented and respected trading records in modern market history.
•His results were independently verified and later featured in Investor’s Business Daily (IBD).
Early Trading Years
•Zanger lost money consistently for many years.
•He struggled with emotional trading, random entries, and lack of structure.
•The major turning point came when he studied William O’Neil’s methodology, especially the book How to Make Money in Stocks.
The Breakthrough Insight
Dan Zanger realized one critical truth:
Charts don’t lie. Price and volume tell the real story.
From that moment:
•He stopped predicting.
•He stopped fighting the market.
•He focused purely on high-probability chart patterns.
The Zanger Trading Method
1. Pattern Selection
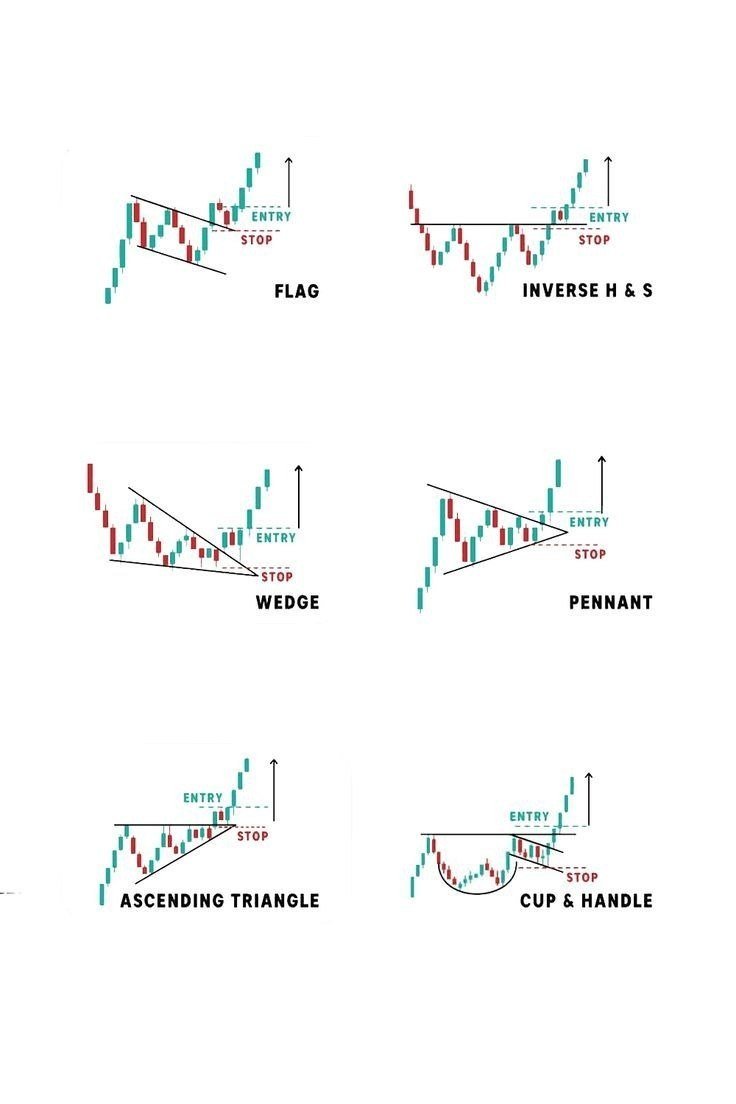
•Tight consolidations (flags, pennants, bases)
•Strong prior uptrend
•Clean structure with minimal noise
2. Breakout Rule
•Entry only at proper breakout points
•No anticipation
•No early guessing
3. Volume Confirmation
•Breakouts must occur with significant volume
•Often 50% or more above average
•Confirms institutional participation
4. Risk Management
•Losses cut quickly (usually 5–7% max)
•Capital preservation comes first
•No emotional attachment to trades
5. Focus
•Only the biggest potential movers
•Avoids lagging or weak stocks
•Trades fewer stocks, but trades them well
Psychological Shift (Before vs After)
Before
•Emotional decisions
•Random entries
•Overtrading
•Hope-based holding
After
•Disciplined execution
•Pattern-based entries
•Risk-controlled trades
•Rule-based exits
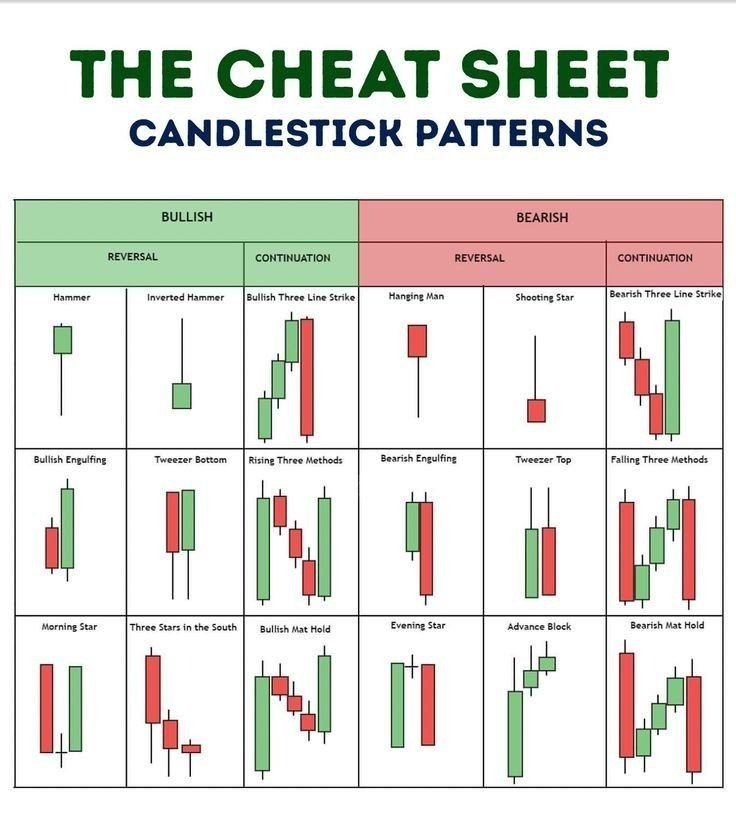
有个超级好用的工具,可以帮你把吞没,锤子线,十字星等40多种常见的 K 线形态全都自动标出来。
还能在你关注的形态出现时发出提醒。
它叫 All Candlestick Patterns,全部蜡烛图形态。
在 TradingView 的指标搜索栏里输入英文名称,就能找到。
加到图表后,它会在符合条件的 K 线旁边添加标签,默认蓝色表示看涨形态,红色表示看跌形态,灰色表示中性形态。鼠标移到标签上,就能看到形态名称和简短解释,可以直接对照旁边的 K 线查看。
如果全部打开,图上可能会出现很多标记。
可以在设置里取消不关注的形态,比如只留下吞没和锤子线,也可以选择只显示看涨或看跌形态,找起来更方便。
它识别时也会参考前面的趋势,因为同样的 K 线外形,出现在上涨后和下跌后,含义可能不同。
设置里默认用 50 周期简单移动平均线辅助判断趋势,也可以调整。
提醒功能适合用来盯自己常看的形态。
在指标上右键选择添加提醒,再选好具体形态,创建后,满足条件时就会通知你,不需要一直开着图表等。
这些标签是按 K 线外形和趋势条件识别出来的,标出了看涨形态,也不代表接下来一定会上涨。
收到提醒后,再回到图上看它出现的位置和前后的走势。
Try this simple setup:
• VWAP
• 9 EMA + 20 EMA
• Opening Range Breakout (ORB)
If the EMAs are bullish above VWAP, look for longs or calls.
If the EMAs are bearish below VWAP, look for shorts or puts.
Take profit as price breaks outside the ORB.
This is just an idea.
Mark Minervini Setup – How to Find Winning Stocks!👇📊
🔍 Stock Selection (Filtering Rules)
✅ Stock should be within 25% of its 52-week high
❌ Remove stocks below ₹30
📊 Trend Rules:
• 200 DMA rising for at least 3 months
• 50 DMA above 200 DMA
• Price above 200 DMA (preferably above 50 DMA too)
📈 Strength Rules:
• Price is 100%+ above 52-week low
• Stock makes a 52-week high every 4–6 months
📝 Weekly Stock List Process
📅 Update list once a week (after weekly close)
📊 Use Weekly Charts only
❌ No need to hunt new stocks daily
➕ Add to existing winners
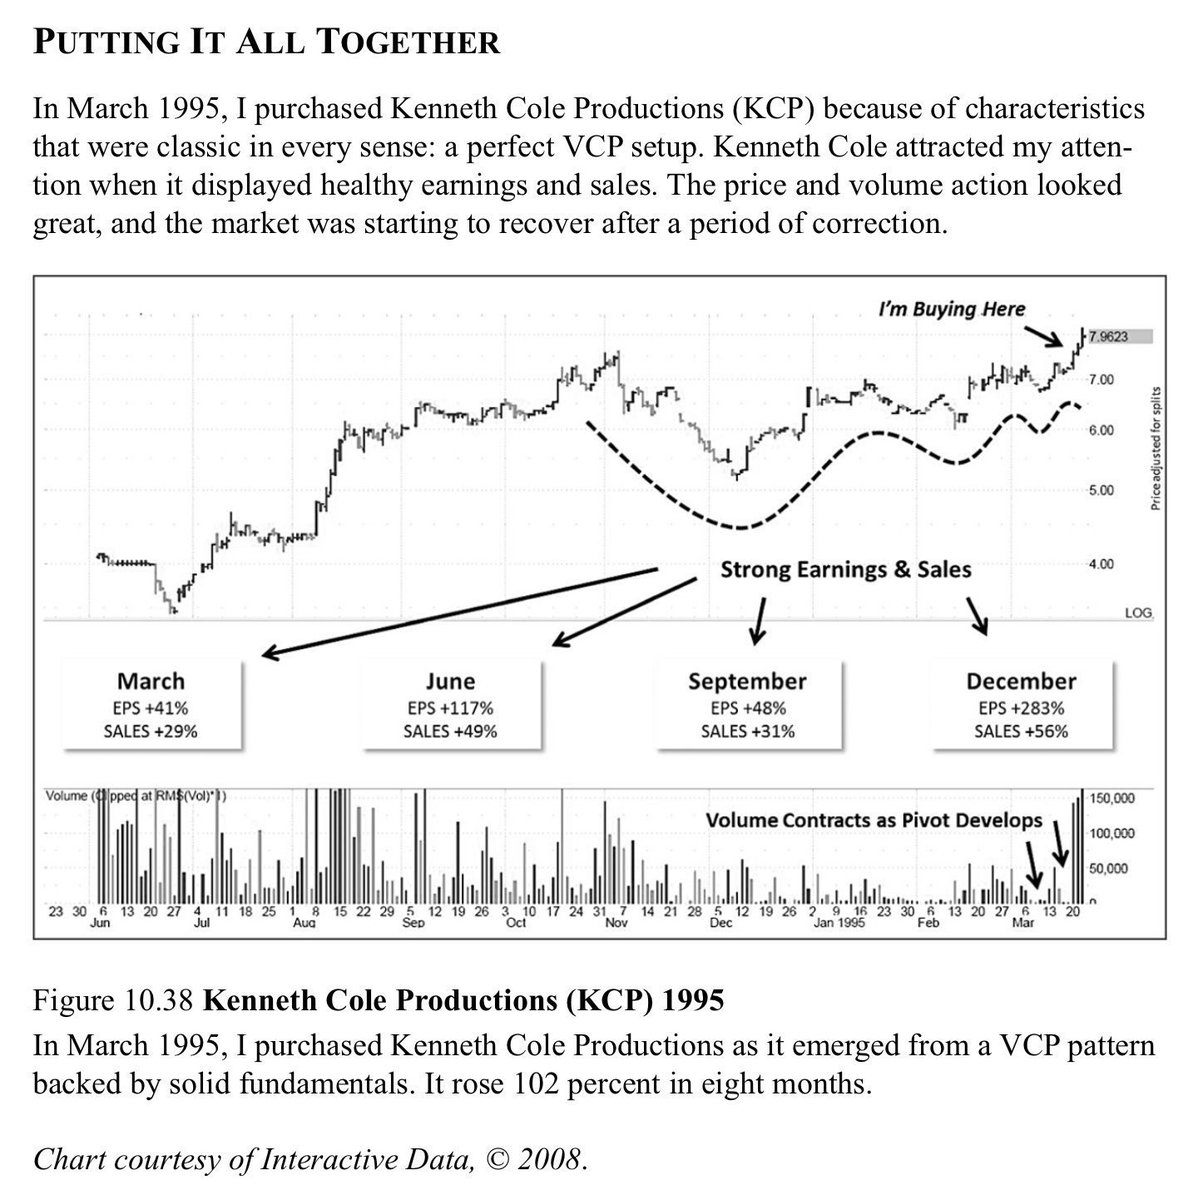
🔄 Volatility Contraction Pattern (VCP)
📉 Stock moves up on high volume
📉 Pulls back on low volume → Healthy consolidation
✔️ Use only Price & Volume
✔️ Ideally 3 VCPs
✔️ Each contraction = lower volatility
✔️ Time contraction also matters
📌 Buy when previous swing high breaks
📐 Volatility Rule (Simple)
Swing Low ÷ Swing High − 1 = % contraction
• 2 VCP is okay only if 2nd contraction >70%
🎯 Entry & Breakout
⏱️ Breakouts usually happen in 4–8 weeks
📊 Use Daily chart only for entry timing
⚠️ Win rate ~ 50% → Risk control is key
🛑 Stop Loss Rule
📉 Plot 20-period ATR (Daily chart)
🔢 Stop = 2 × ATR
🚫 Max stop loss = 10%
👀 Post-Buy Monitoring
🟢 More green days than red
📊 Up volume > Down volume
🎾 “Tennis Ball Action” (quick bounce)
📉 Shallow pullbacks are bullish
🔥 Fun Fact:
Minervini made 413% returns in 1995 by following this system
(Source: Trade Like a Stock Market Wizard)