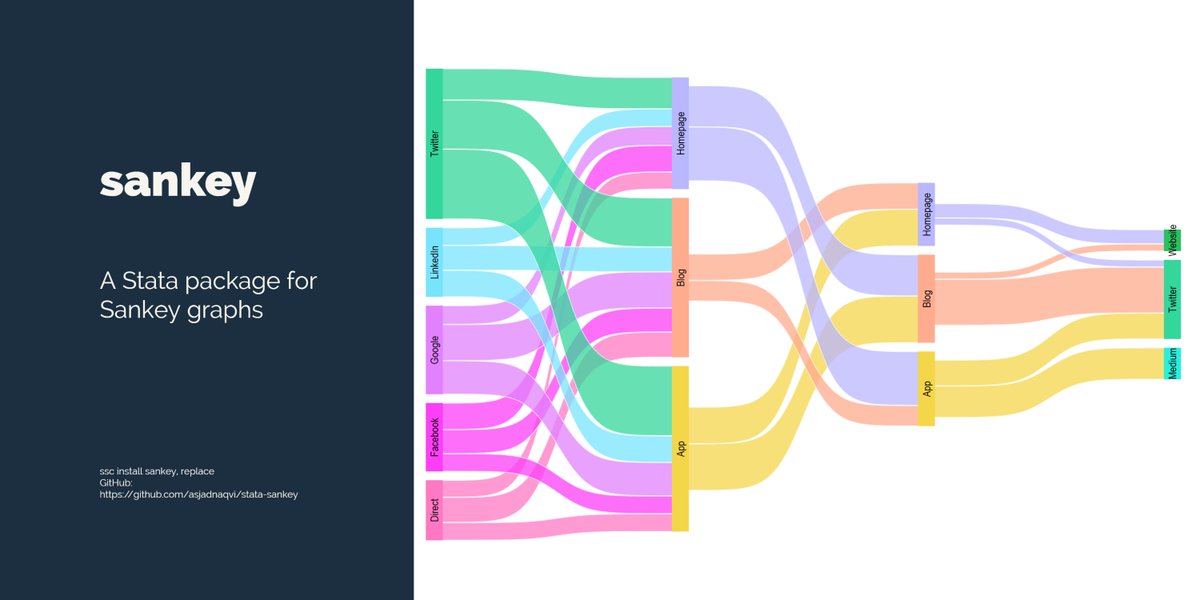
Two #Stata packages updated:
#bumparea v1.4
#bumpline v1.3
Common changes:
- Weights are now allowed.
- More control over data collapse.
- Full control over all axes, lines, colors + other elements.
- More error checks.
- Several bug fixes.
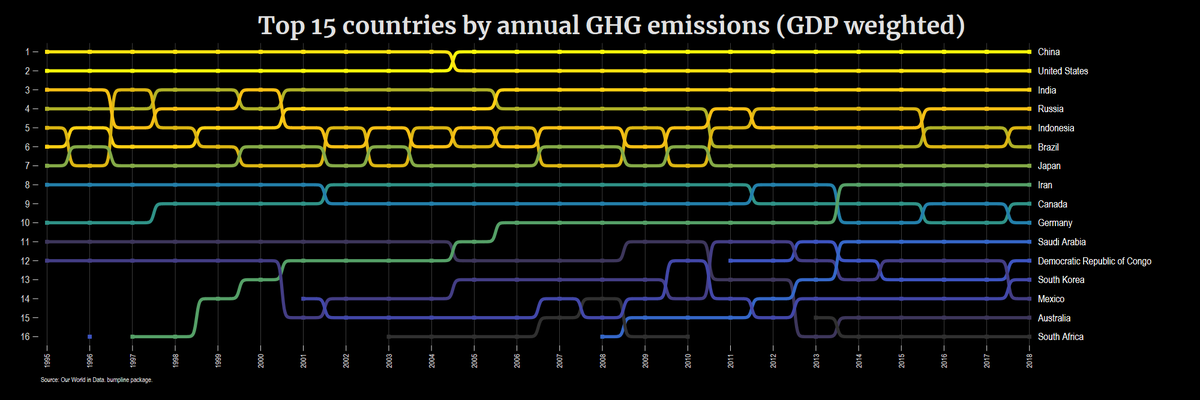
Bumpline can also now separate out lines that start and end in the middle to avoid clutter.
See the two examples 👇using the same data.
More info and examples:
https://t.co/3dYCfhshnZ
https://t.co/rd8YtdIclm
Up soon on SSC.
Hi all, the following #Stata#dataviz packages are now updated on SSC:
#alluvial v1.4
#arcplot v1.4
#bimap v2.1
#circlebar v1.6
#graphfunctions v1.4
#sankey v1.81
#spider v1.5
#sunburst v1.8
#treemap v1.6
#waffle v1.23
Overall changes:
👉 Most packages got better label wrapping via the new #graphfunctions package.
👉 Most package got support for weights (other will get it as well over time time).
👉 Some had internal functions ported over to a common graph generation framework (more on this earlier next year).
👉 Suggested citations added to each package. Please cite them and others you use!
Updates were based on project demands, and requests from clients and power users. Bugs from any source were given high priority.
Showcase:
Quite a lot of feature requests were added, of which four are showcased below:
💡 allivual + weights + word wrapping
💡 circlebar + sorting + weights + reference lines + near labels
💡 spider + weights + web grids + reference lines
💡 sunburst + weights + extensions for donut plots
Detailed can be found in each package's repository. Links can be found here: https://t.co/cBC3o6LpWR
Please ⭐️ the ones you like and please use #GitHub for reporting issues and feature requests.
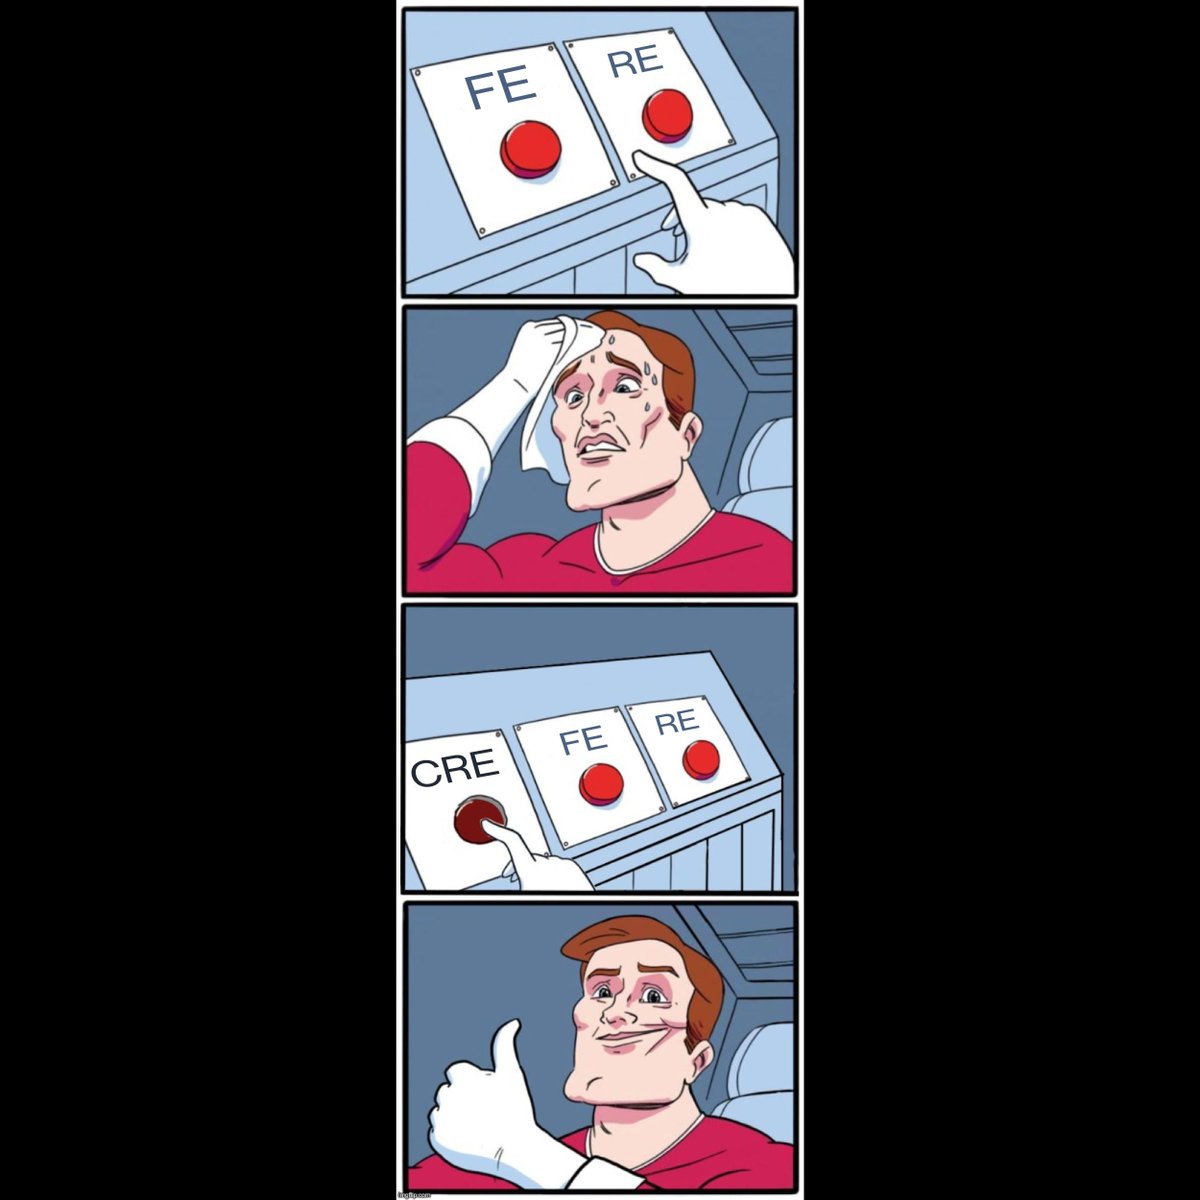
New in StataNow: Correlated Random-Effects (CRE) Models.
Control for endogeneity 𝘼𝙉𝘿 estimate effects of time-invariant regressors in your panel-data models.
Learn more about CRE models and the new Mundlak specification test:
https://t.co/TCGdRqghes
BREAKING NEWS
The Royal Swedish Academy of Sciences has decided to award the 2024 Sveriges Riksbank Prize in Economic Sciences in Memory of Alfred Nobel to Daron Acemoglu, Simon Johnson and James A. Robinson “for studies of how institutions are formed and affect prosperity.”
#NobelPrize
#Stata#spider is bumped to v1.5 with tons of major changes:
- Option "grid" now generates a web grid.
- Option "range()" now accepts numlists to generate custom grids
- Marker symbols and line patterns now accept lists (several people had requested this)
- Reference lines can be added using the "rline()" function.
- Several options have been renamed, revamped, homogenized, and added for more customizations and flexibility.
- The package now requires "graphfunctions" to wrap text and generate circular/web grids: https://t.co/IaZCKsGEQH (install from GitHub until up on SSC).
See image below with custom web grids, reference line, custom markers, and legend placement.
More info and instructions on GitHub:
https://t.co/Xu5Wl5Jgl9
Up soon on SSC!
Side note: "spider" was released exactly two years ago on 13 Oct 2022 🎂
Have you ever replaced accents in strings using multiple replace lines in @Stata? I had some fun time writing a package that could be useful for #Stata users! 🎉Feel free to check it out and submit a PR if you have any improvements: https://t.co/KeEy1TWkaP #Reproducibility#Code
#Stata#spider 🕷️is bumped to v1.4:
🕸️ Weights 🏋 are now allowed and users can also specify how they want to collapse the data (mean/sum).
🕸️ Users can now specify variable lists (wide form) making it easier to use.
🕸️ More options added for more controls over the axes ranges.
🕸️ Major code cleanup.
More info and examples:
https://t.co/Xu5Wl5IIvB
Up soon on SSC!
@Stata package #circlebar (also mirrored as #polarbar) updated to v1.6 with the following major changes:
- Weights are now allowed.
- Added options labvar() and colorvar() for custom labels and colors.
- Added option labnear to show labels right above the bars rather than at the edge of the last circle.
- Added options rline() to show a custom reference circle. Additional options also added for its customization.
- Users can now directly defined stat(sum) or stat(mean) for data preparation for the command.
- Several defaults updated and some code optimizations.
Also from past updates: users can also specify half for semi-circles and fully control the min/max of the figure.
More info and examples:
https://t.co/lgQIVRn0R1
Up soon on SSC!
1 in 7 children born with low birth weight, 45M suffer from wasting, and anemia impacts 1 in 3 women.
⬇️ Discover how innovative financing can tackle these issues in our latest expert blog. #InvestInNutrition https://t.co/2GgE391aBG
It's been too long since I've made a substantive tweet, so here goes. At the following Dropbox link you can access the slides and Stata files for my recent talk at the Stata UK meeting:
https://t.co/PViO8X4744
It's taken me awhile to see connections among various estimators.
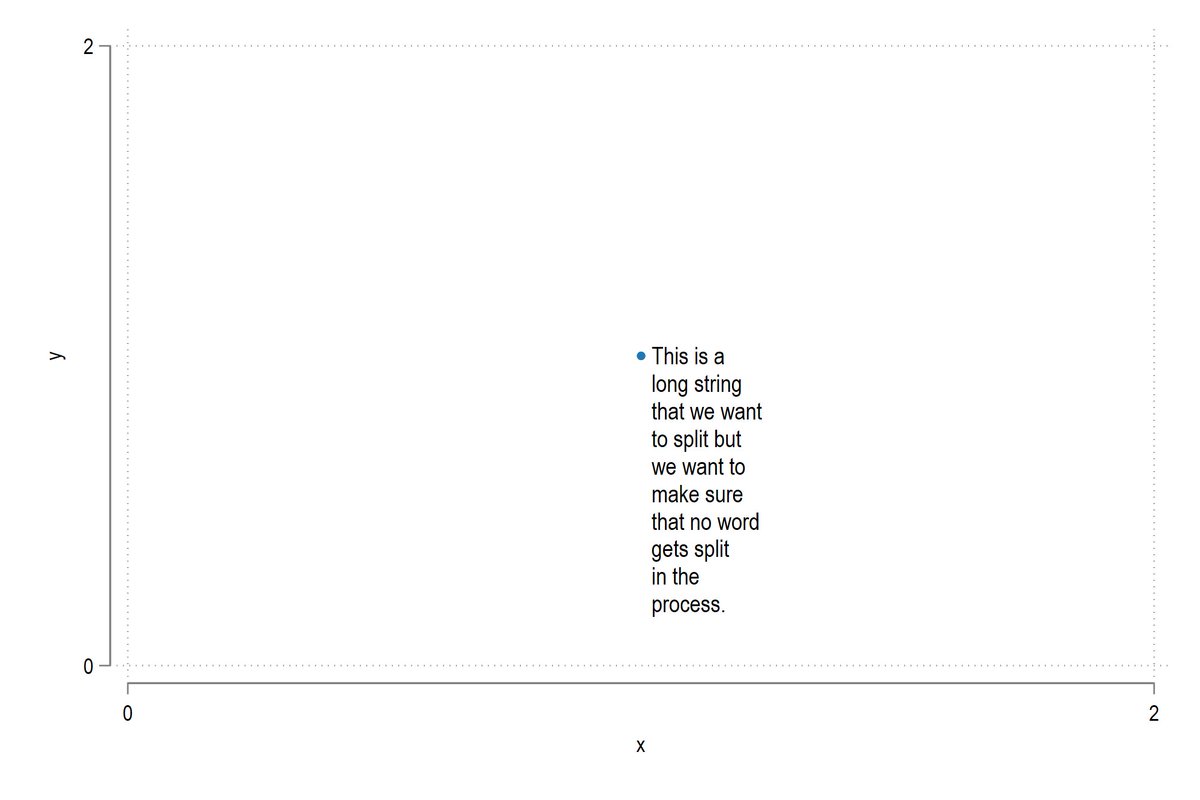
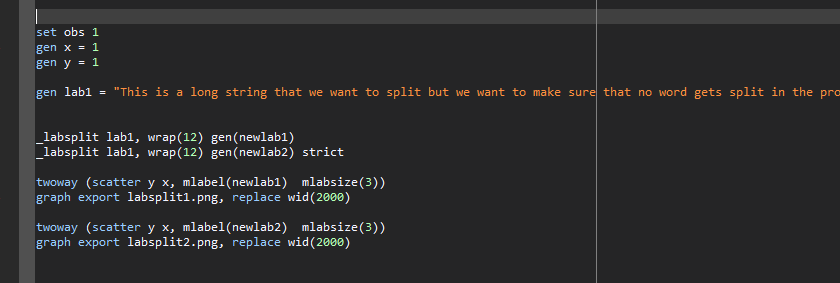
My friend Mark (who left Twitter) asked for better functions for splitting labels in #Stata on GitHub. I said, if he buys my coffees ☕️, I will do it today.
And so he did! And now this has been programmed. Just need to decide whether to embed this it within the packages or release it as a standalone. This feature gets requested a lot actually (even by myself).
#TGIF #coding
Health is a human right and achieving #HealthForAll is key to delivering on this promise.
Learn where we stand in achieving #UHC in this new @WHO & @WorldBank report. #InvestInHealth
https://t.co/qWq6G7ODJc
My article with @NicolaiFoss on "woke" companies generated quite a bit of attention, not all of it favorable. Our response to one set of scholarly critics, Jeffrey Olenick and Ajay Somaraju, is now online. Enjoy! https://t.co/q6bwFcWiAz
#Stata#sankey has been bumped to v1.8 with two new features:
- option align orients the child's horizontal position to the parent's horizontal position. This makes it easier to visually track flows especially if some nodes end in the middle of the layers which by default would bunch the remaining children towards the middle.
- option fill extrapolates the nodes that stop in the middle of the layers. These nodes are just repeated until the last layer is reached. This makes the figure look more complete at the expense of repeated values (redundancy).
Currently, these two options only work if there is only a single parent node. Multiple parents might result in distorted figures. These are still beta and will be improved in later versions.
Overall, the program had a major code clean up and should run a bit faster.
See examples below from the #WorldBank #IDS database which shows the hierarchy of global external debt stock in 2022 using align and fill options.
Installation, info and examples:
https://t.co/SFwUm4USIj
Up soon on SSC!
Here is the link to the dofile for creating #Stata#maps especially the grids and data interpolation using the new #geoplot package:
https://t.co/jZQ6i7YqqV
Some examples below. The file is self contained and will install the packages and download the data from GitHub.
Oslo 2024 and previous conference presentations are here:
https://t.co/4aG2va61c2
Here’s my article on integrating #Git with #Overleaf, specifically for economists. It’s beginner-friendly and assumes very little knowledge of Git or the command line. Feedback is welcome! https://t.co/bDX4a9Cuo6
Interesting tool to turn research papers into AI generated podcast discussions that provide a high level overview: https://t.co/trjS8ISDTL Fed it some of my papers and it did a very reasonable job, especially with the ML pubs. #econtwitter