Freelance Data Analyst | Passionate about Data-Driven Insights | Sharing tips, talks, and tutorials | Helping you make sense of data 📊
[email protected]
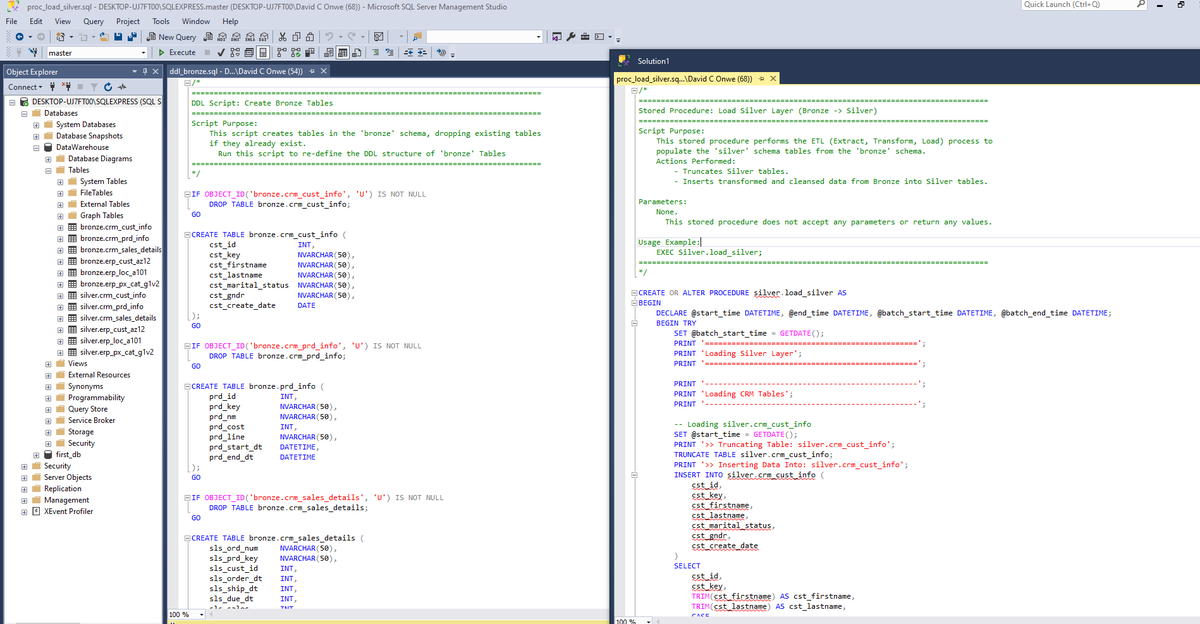
My view
Data Warehouse & Analytics Solution, using the Medallion method, to create a bronze, silver, and gold layer. Each layer handles different stages of the warehouse.
Hi #DataFam, here’s my entry for the January 2025 @MavenBI Music Challenge.
I created an interactive Spotify dashboard and even added a music player using HTML.
Dashboard: https://t.co/TbpGgSw2nH
Medium Article: https://t.co/A7VnydYeRZ
Tools used:
@PowerBI, @figma
The first rule of a successful project is proper planning. Whether you're a Data Analyst like me or in any other field, poor planning is often the reason projects fail.
You can use Notion or Jira for proper planning documentation and tracking.
Once you know how to use Power Query to clean your data, and how to build a proper model, every other thing you do would be so much easier.
Power Query - https://t.co/RGEfYsnIkF
Data Modelling - https://t.co/d6IUU15aFM
DAX - https://t.co/6Wqfy1UsIS
@ezekiel_aleke One good thing about learning is that, if you even learn about something you already have knowledge about, you would learn new ways of doing that thing better.
@HowToPowerBI First rule of creating data visualisation; always create it to suite the audience that want to use it.
Creating visuals for non technical stakeholders, is different from creating visuals for technical ones.