US CPI BREAKDOWN ⚠️
Month over month
CPI 0.2% (Exp. 0.2%, Prev. -0.1%)
Core 0.2% (Exp. 0.2%, Prev. 0.1%)
Year over year
CPI 2.9% (Exp. 3%, Prev. 3%)
Core 3.2% (Exp. 3.2%, Prev. 3.3%)
To two decimals, headline CPI increased by 0.15% month over month, core CPI increased 0.17%.
While, the month over month CPI for July wasn’t as cool as June, it has still been advancing at a pace well within the realms of what should provide further confidence that inflation is slowing to the Fed.
3 month annualized CPI is now running at only 0.42% while 6 month annualized inflation is sitting at 2.5%; inflation momentum has slowed substantially.
Annualized readings display what the year over year reading would be if the rate of change from the specified time period was sustained for a year.
In terms of core CPI, 3 month annualized is sitting at 1.58%, while 6 month clocked in at 2.84%, also suggesting that inflation is headed well towards the Fed’s target. Remember though, core PCE price index is the Fed’s favored inflation metric.
Core CPI excludes food and energy, generally more volatile components, and is considered to better represent underlying inflationary pressures within the economy.
Shelter components of CPI have been very sticky; shelter advanced 0.4% in July, an increase from 0.2% in June and accounted for almost 90% of the month over month increase in July. Powell has commented on this in press conferences as the Fed expect shelter components of inflation to cool and slowly filter through into data.
As can be seen in the heatmap, inflationary pressures have notably cooled over the course of the year. Core goods continue a deflationary trend.
CPI Heatmap
Summary
Ultimately, the print was cool and given that PPI this week didn’t provide any shocks, it certainly seems to pave the way for the Fed to start cutting in September, and markets know it. The Fed have repeatedly noted that their employment mandate has become a more prominent consideration as slackening of the labor market continues and inflation prints after 1Q24 have been substantially cooler.
Markets are fully pricing in the Fed to start cutting rates at their September meeting, the more contested point at present is how much the Fed will opt to cut by.
Given July’s data wasn’t quite as cool as June and barring any substantial shocks to the labor market or economy prior to the September meeting, it seems likely the Fed would opt for a 0.25% cut in the first instance. As per the CMEFedWatch tool, markets are currently pricing a 63% probability of a 25 basis point reduction in rates in September.
Simply explained CPI
Released by the Bureau of Labor Statistics monthly
The Consumer Price Index measures the change in prices for goods and services for urban consumers; it is a measure of inflation. To achieve this, a basket of goods and services prices is sampled monthly. The goods and services in question are supposed to reflect the spending patterns of consumers in the United States. The data is supposed to be representative of prices for over 90% of the US population.
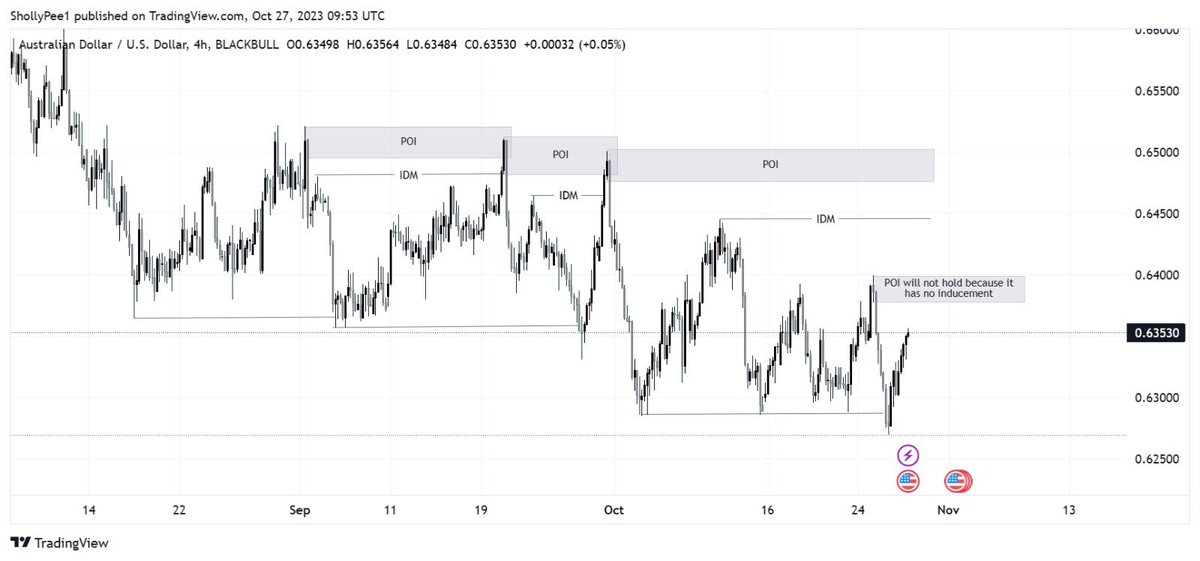
I used to hit consecutive SL💔 till I understood Inducement.
INDUCEMENT : A powerful tool for a strong win rate.
The Concept of Inducement is often underrated. I will explain in this thread how Inducement works and how to utilize it for good trade entries.
A THREAD 🧵👇
🚨 Burnley have earned a reputation of posting some brilliant transfer video announcements over the last few years, so we made a thread of all of them in one place. 🙌
Enjoy. 🍿🧵
Just received this from a childhood friend, Danish, who I have not seen since 1996. Deeply touched.
Danish, there will be light at the end of the tunnel. There always is.
Those days of Alfa Romeos are long gone. And if money mattered, I had no need to leave McKinsey. This is about Pakistan now. That is Imran Khan's fight. And I hope we can all live up to the responsibility thrust on us.
All I can say is, thank you. You may be a proud Scot, but half of you will always be Pashtun and Pakistani. Pray for Pakistan.
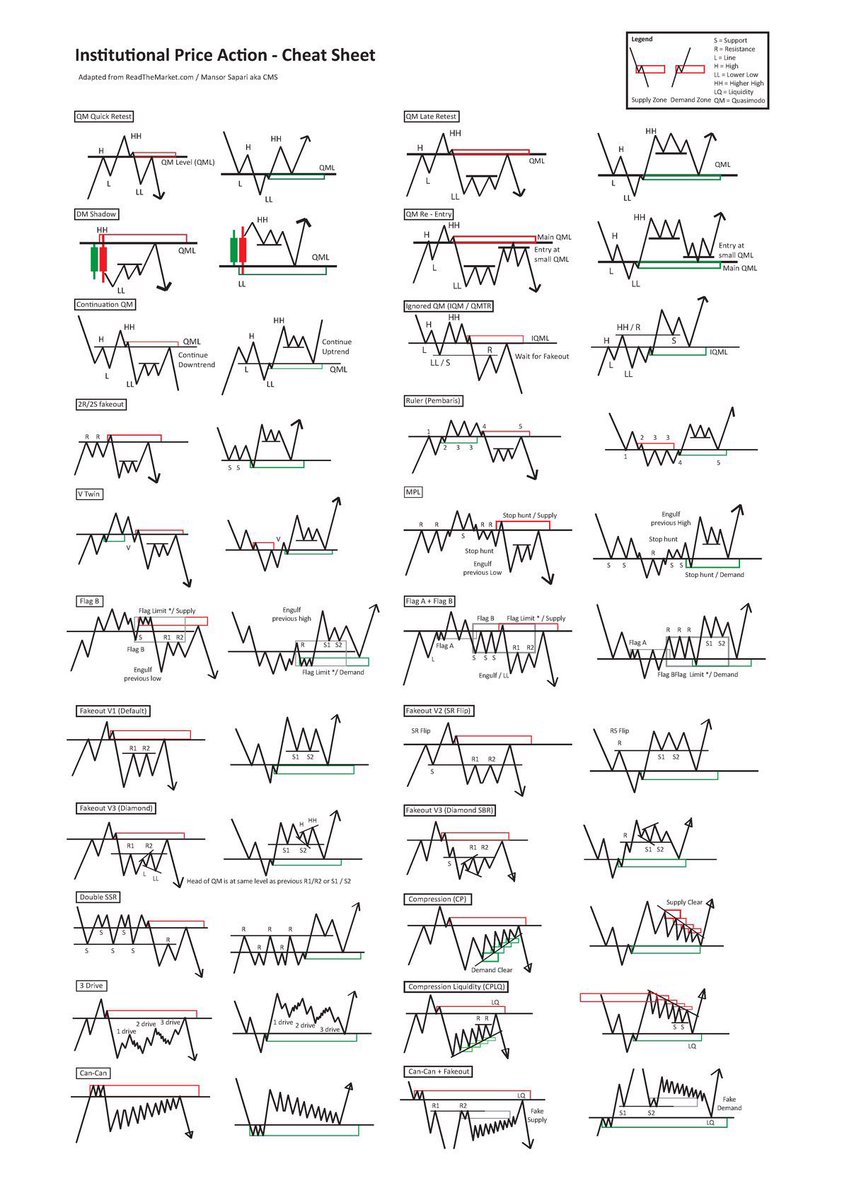
Free today: The Ultimate Guide to Price Action Trading via @Rayner_Teo
Learn how to "decode" the markets so you can identify high probability risk/reward trading setups.
👇📉📈📊
Link below, it’s free:
https://t.co/lA4nmqtYks
#NTUpartner
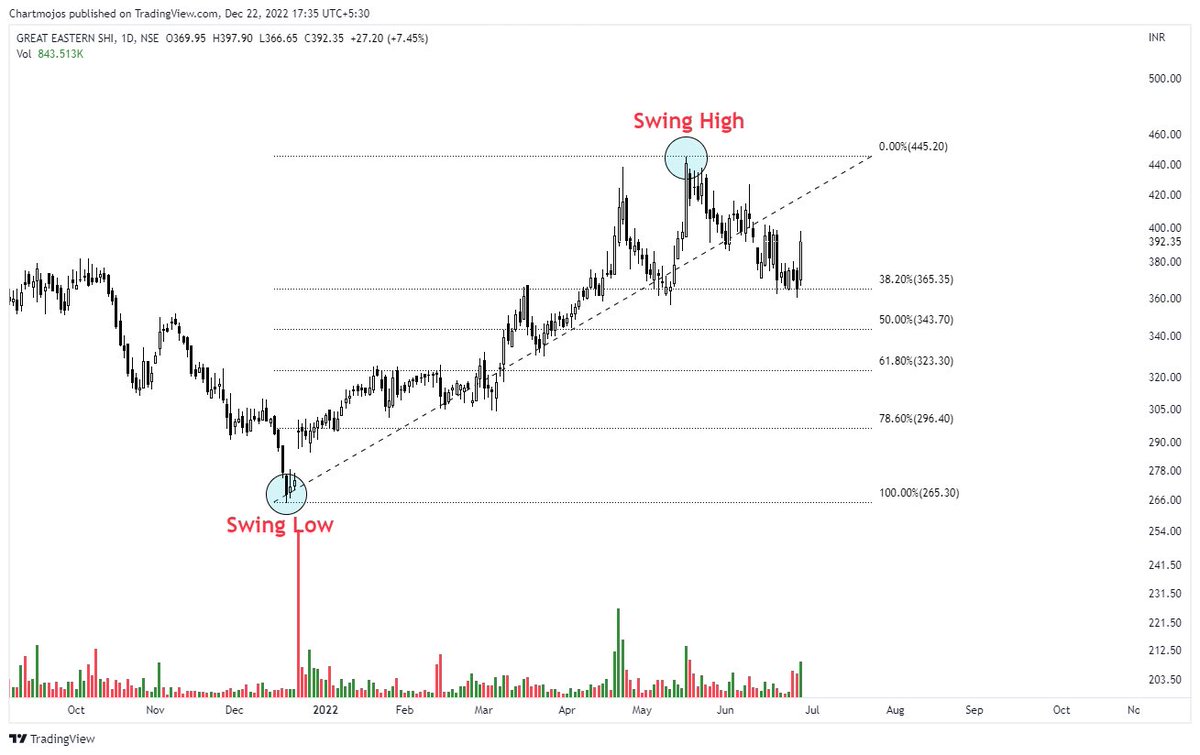
Fibonacci Retracement Explained
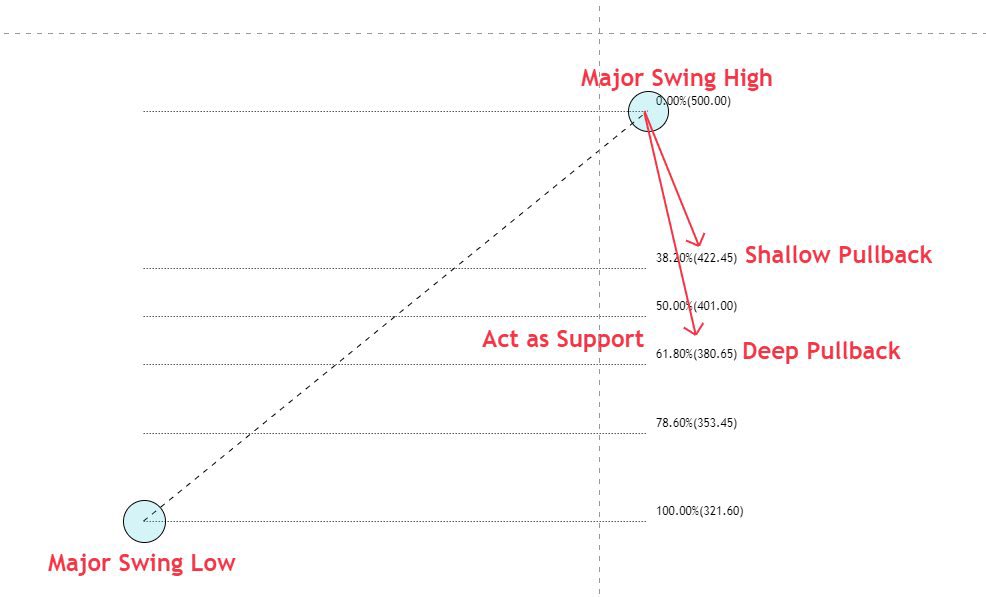
In technical analysis a Fibonacci retracement is a trading methodology for determining high probability support and resistance levels on a chart. It uses the Fibonacci sequence and that is where its name comes from.
A Fibonacci retracement uses the theory that price swings on charts will usually retrace and backfill a mathematical portion of a move, after this measured pullback the trend usually continues the move in the original direction.
A probable Fibonacci retracement level is quantified by taking two distant price points on a chart and dividing the vertical distance by using the key Fibonacci ratios. 0% is the starting point for the measurement of the retracement, and 100% is a total reversal back to the starting point of the move.
Fibonacci levels are identified by measuring moves from the starting point of support or resistance. Horizontal trend lines are drawn on the chart to identify the potential key support and resistance levels. The significant levels to look at are 61.8% 50%, 38.2%, and 23.6% for support or resistance.
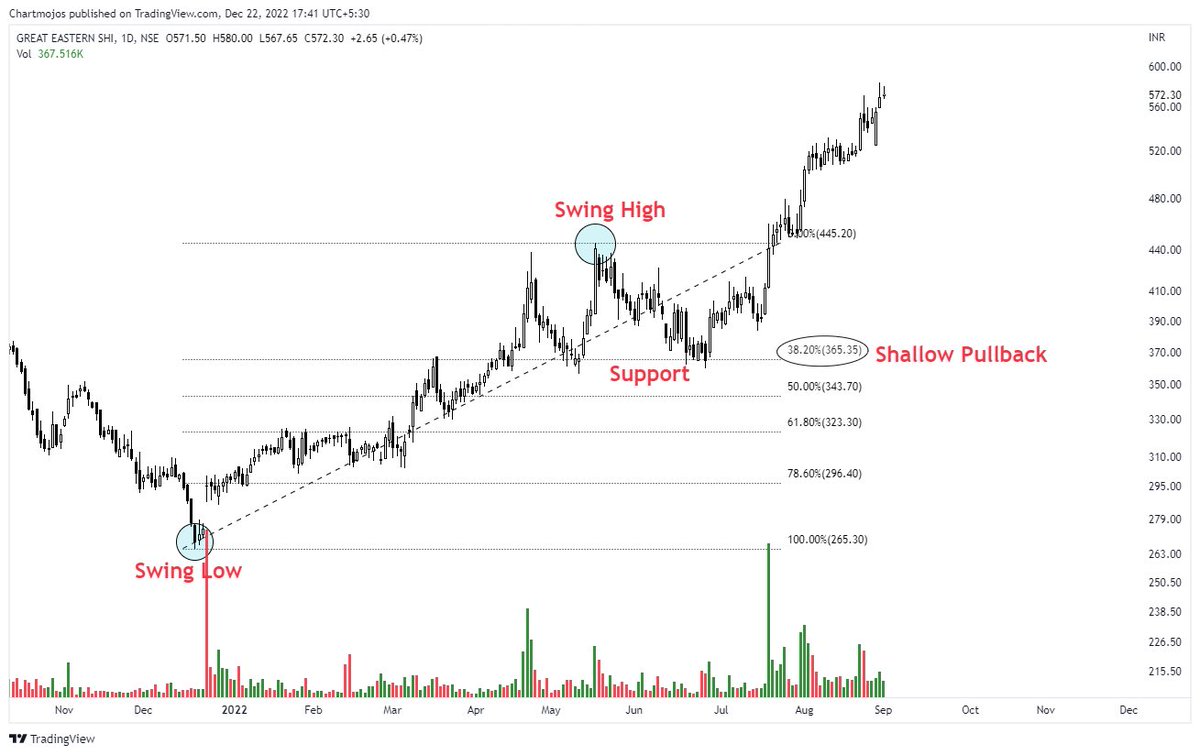
A Fibonacci retracement is a very common technical tool that price action traders use to look for high probability price levels to enter trades, set stop losses in current trades, or set profit targets for winning trades.
The concept of looking at key retracement levels at possible price extensions is a method not only used with Fibonacci but also with many other methods like Elliott Wave theory, Wolfe Waves, and Gartley patterns. After an up or down swing in price the new price support and resistance levels can be seen showing up at the key retracement levels in these methods.
While moving averages can change as price moves the Fibonacci retracement levels are set prices. They are targets on the chart that stay the same. This simplifies the identification of signals and creates price levels that can be acted on immediately when reached. These levels are key reaction points on a chart and can lead to a binary action for traders as the there is either a breakout in price or it is rejected and holds as support or resistance.
The primary 0.618 Fibonacci retracement price level used by so many stock traders is approximately the ‘golden ratio’.
The below example shows Fibonacci retracement levels on the chart for the USD/CAD currency pair. In this example the price action retraced approximately 38.2% from a move down before continuing.
I’ve worked in finance for ~6 years.
I’ve also spent over 3,500 hours discussing investing with experts.
99% of investment advice can be boiled down to these 21 sentences:
@_FaridKhan Nothing against nawaz, but he is not the kind of bowler that can run through opposition....usama should be given a proper run....we will need spinners in this world cup
Technical Indicator Road Map:
MACD - Price swings
RSI - Overbought/Oversold
Bollinger Bands - Trading Range
ATR - Volatility
ADX - Strength of a trend
Keltner Channels - Extension from the mean
Moving averages - Trend direction
What other indicator would you add?
Rakesh Jhunjhunwala is the best investor you've never heard of.
He compounded at 65% (!) per year for 37 years.
This means $1 turned into $15 billion!
Today I am sharing all his public writings with you for free: