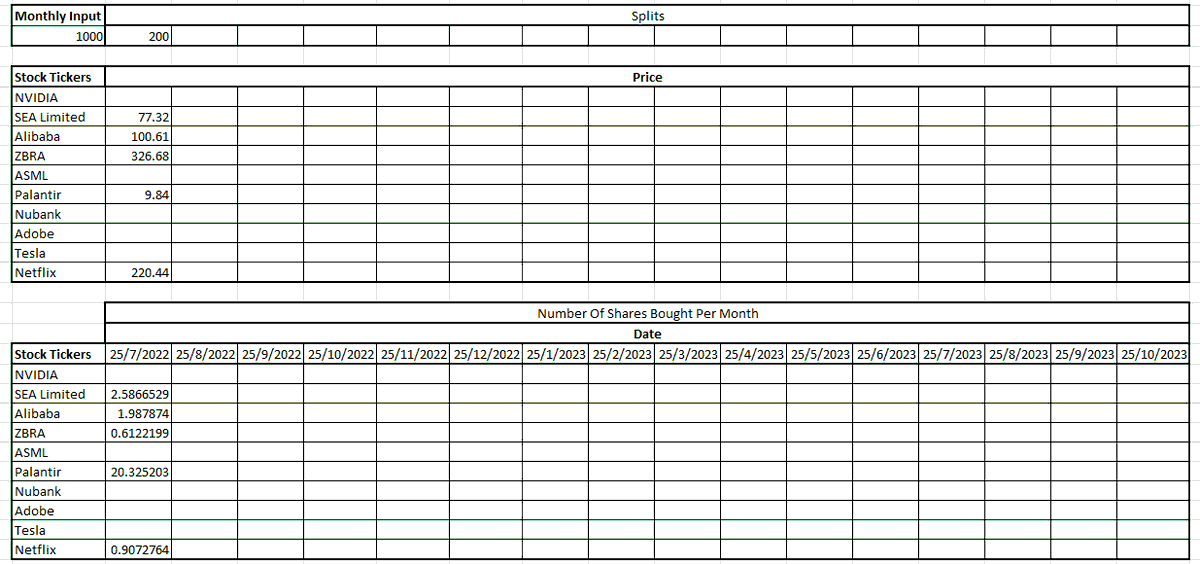
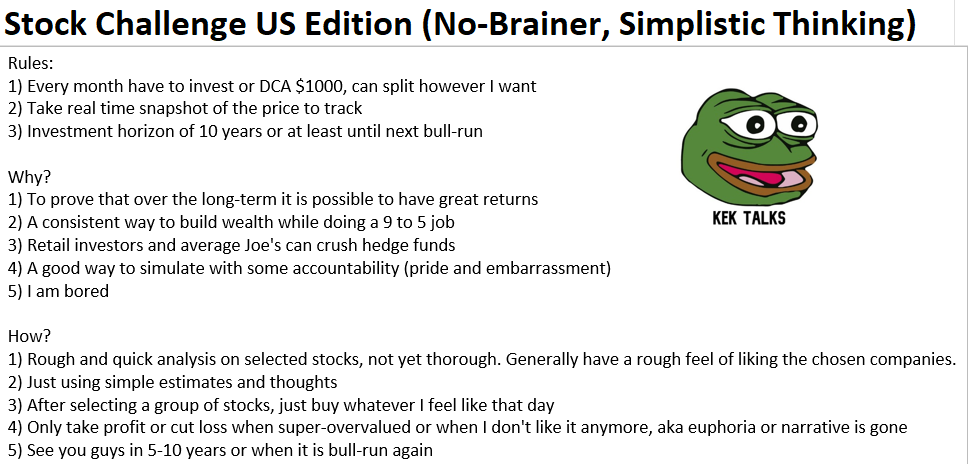
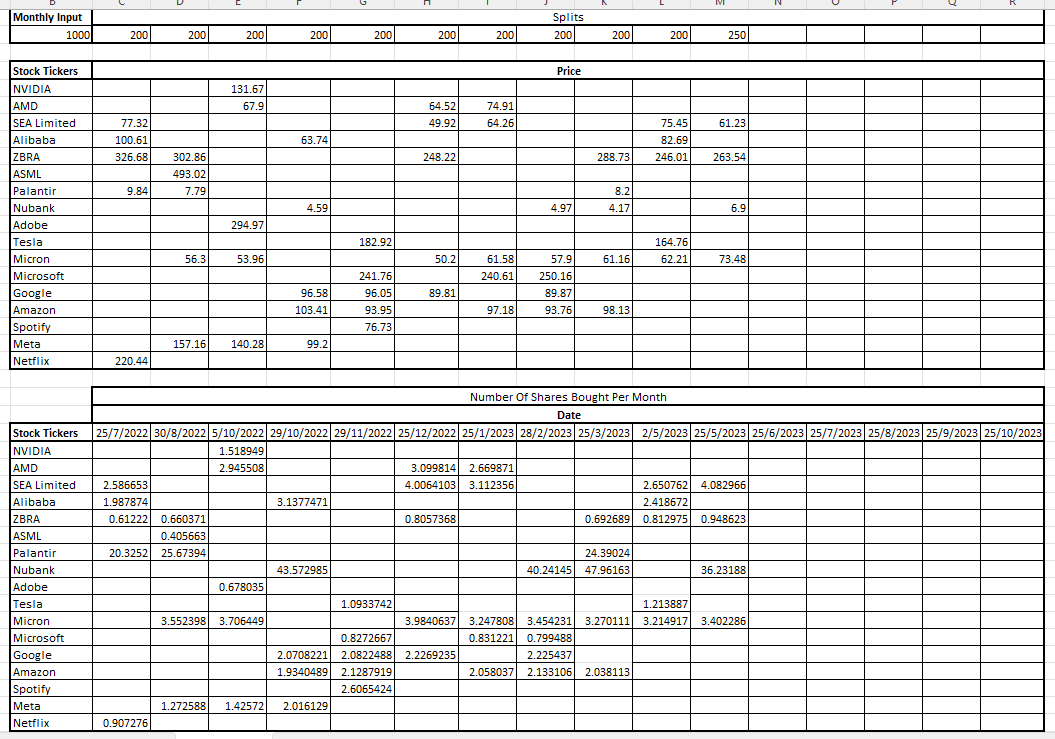
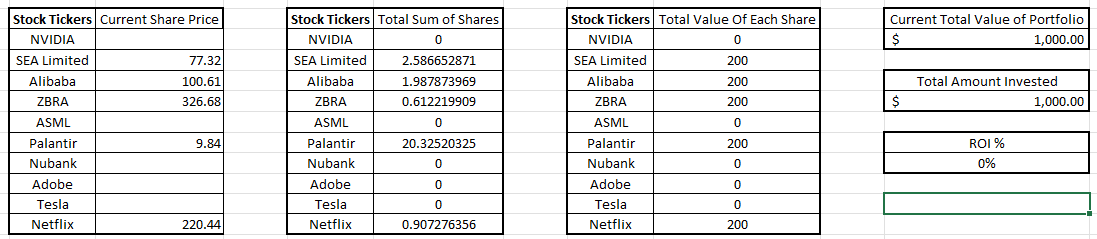
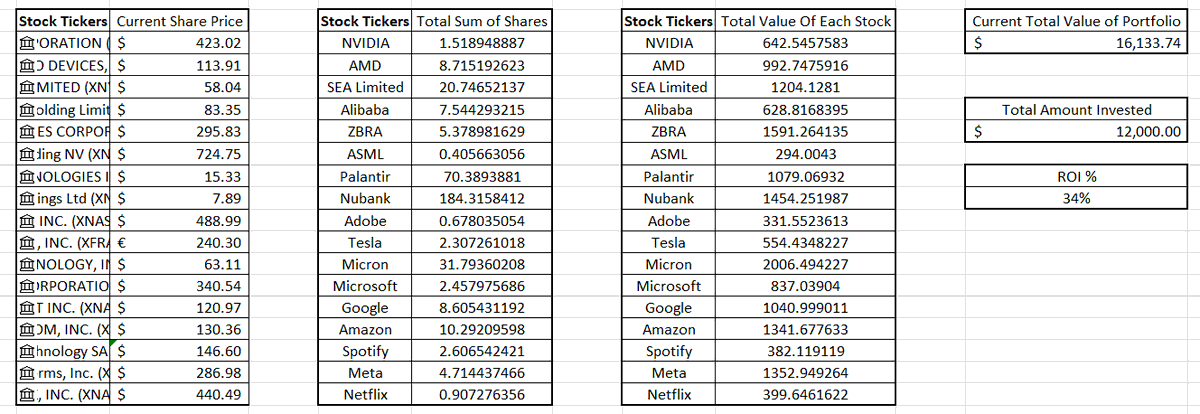
Stock Challenge US Edition (No-Brainer, Simple Investing) #1
Super bored and wanna have this simple project to prove to myself that you don't need crazy investing skills or analysis. Honestly, haven't dived deep into any of these companies yet. Any more companies to add?
Stanley Druckenmiller hasn't had a losing year in his entire 4.5 decades as a trader.
He recently sat down for a talk that every retail investor/trader needs to listen to.
We've broken it down for you into 10 clips (covering TA, risk management, selling losers, & much more):
Stock Challenge US Edition (No-Brainer, Simple Investing) #1
Super bored and wanna have this simple project to prove to myself that you don't need crazy investing skills or analysis. Honestly, haven't dived deep into any of these companies yet. Any more companies to add?
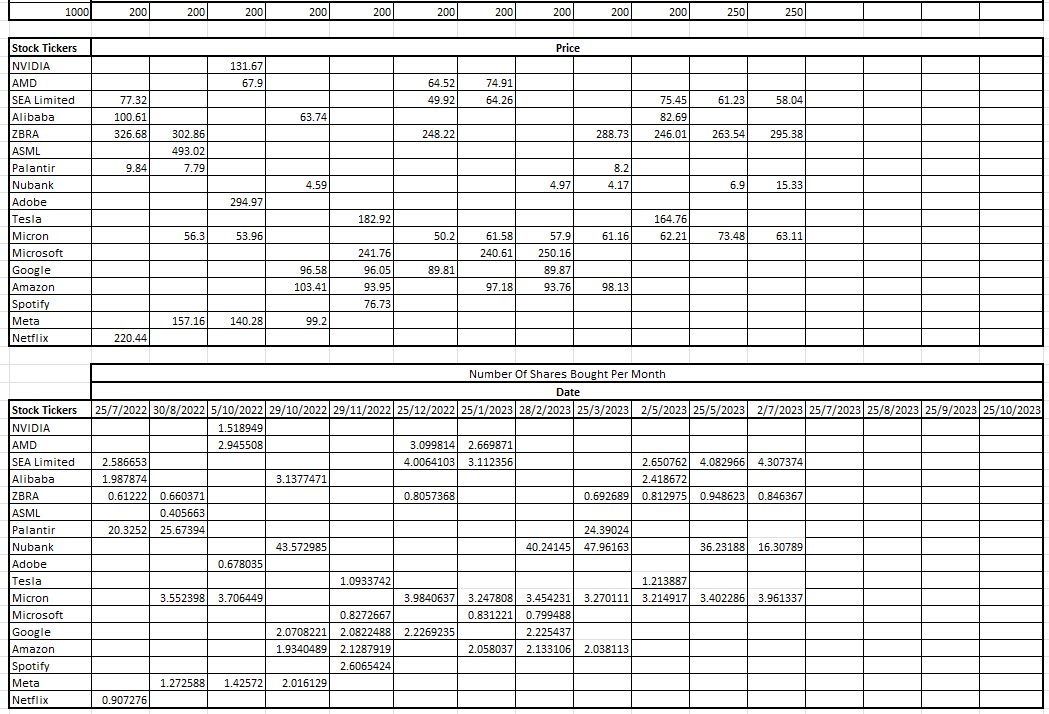
26/5/2023 #11
All the list look overvalued, I do have some other things, but lazy too put them hahha. Wow... A.I. makes it as if there is no recession or anything bad, super long-term. Of course structural growth is there, but can everyone hold till then? We shall see...
1/ Sharing some semiconductor-related content now that semis are back (they never left)
First, a simple visual that explains the industry's structure. People who already know the industry might find this basic, but I struggled to find something similar when doing my research
3 things separate good vs. bad financial modeling.
But the difference is enormous.
Like & comment if you want the excel.
7 points:
*1) Model setup*
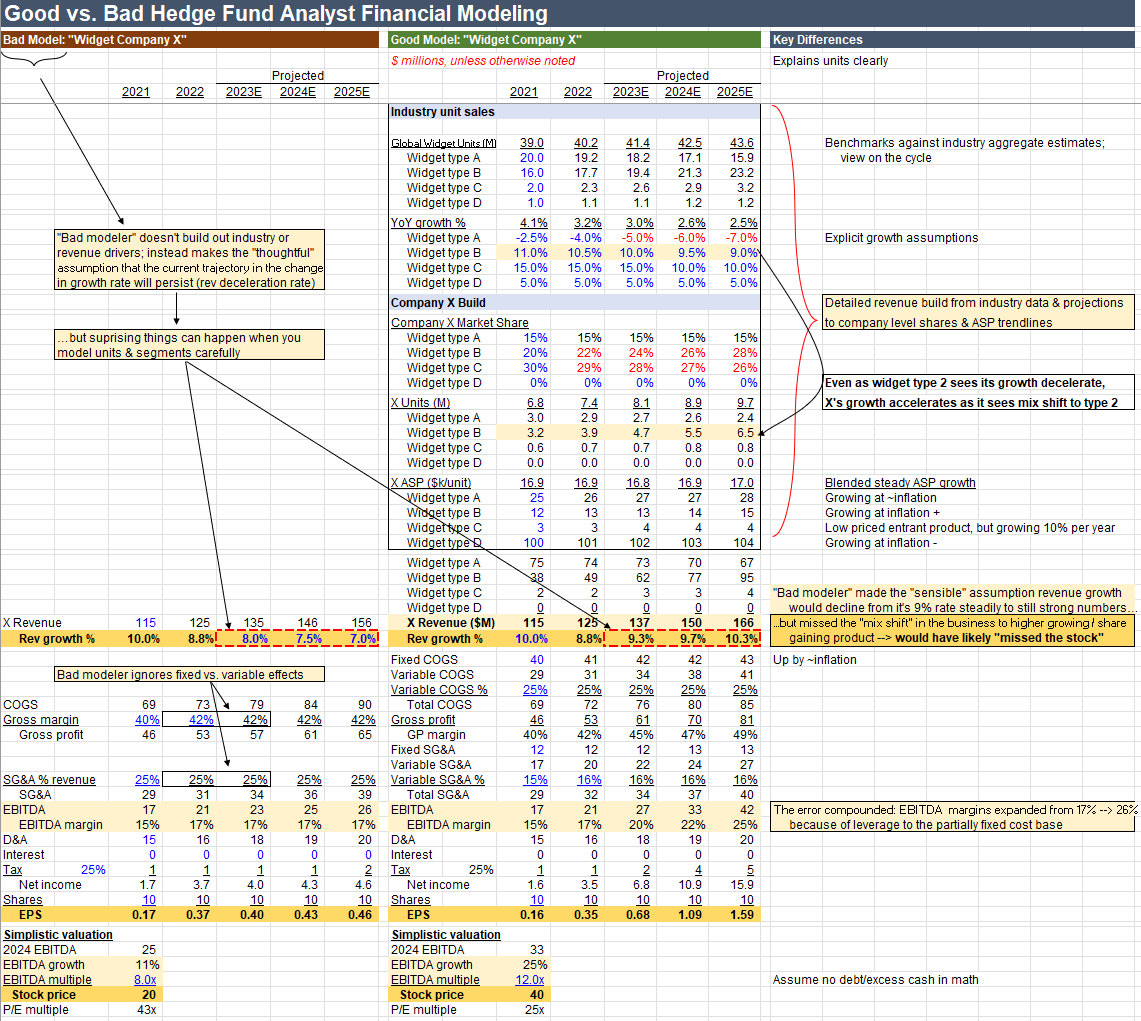
The attached shows "bad modeler" on the left vs. "good modeler" on the right.
Of "Widget Company X".
With 4 business lines, competing in the global widget market.
*2) Company X's position*
X's largest, fastest growing line is 'type B' widgets.
It also sells the other types.
But the market views X as a 'type B widget company'.
And models it accordingly.
*3) Bad Revenue Modeling*
Bad modeler sees X's exposure to type B.
And notices that type B growth is decelerating.
So makes a 'rational' but simplifying assumption:
That X's overall growth will decelerate.
At a similar pace as its main product.
*4) Good Revenue Modeling*
Good modeler builds revenue from its components:
Industry units, unit growth, ASPs, market shares.
And as a result.
Sees something bad modeler missed:
Despite slowing type B growth.
And because X has other large lines that are slower/declining.
That X is undergoing a very positive "mix shift" to higher growing lines.
Meaning:
Its underlying revenue base is increasingly exposed to higher growth.
Changing the overall profile of X's business.
*5) Impact*
The difference may seem subtle.
But the impact is large.
Because this underlying mix shift.
Causes total X growth to reaccelerate from 8.8% to 10.3% over time.
vs. bad modeler declining from 8.8% to 7.0%.
*6) Second order effects*
And maybe surprisingly.
The difference betwen those two outcomes on multiples.
And therefore stock prices.
Is massive.
The market will view accelerating topline growth as deserving a much higher multiple.
Than a decelerating topline.
This assumes 8x EBITDA in the decelerating case, and 12x in the accelerating.
But the reality will vary with context.
*7) Compounding errors*
Bad modeler assumed COGS / SG&A at a fixed % of revenue.
Producing a flat 17% margin.
Whereas good broke out fixed vs. variable.
And showed that in its scenario.
Margins pick up from 17% to 25%.
Even more impactful to EPS:
Which for bad modeler ended at $0.5.
vs. $1.6 for good modeler.
A huge 3.5x delta.
The takeaway is that good vs. bad modeling can look subtle.
And sometimes - frustratingly - good modeling yields no more insight than bad.
But if your hope is to catch structural shifts.
And big moves.
The reality is that the market has already built the basic model.
And made the 'thoughtful' high level assumptions.
So if you want to find differentiated theses.
And generate differentiated results.
You have to find the nuanced growth reacceleration.
Or the misunderstood cost structure.
Or sub-market share gain.
Because without that.
Even if you 'get' the industry.
And have some right answers.
Over time.
You'll end up tracking the market.
And never leading it.
That's all for now.
Like & comment if you want the excel.
3 harder stats concepts put you ahead of 99.9% of analysts.
And still fit on just one page:
Like & comment if you want the excel.
*1) Principal Component Analysis (PCA)*
Why does a stock move the way it does?
With multiple linear regression, you assume a set of factors make stocks move.
The most common version is a stock's "market beta."
Meaning:
When the market moves X%, what is the expected move in your stock?
An extended version is multiple factors.
Meaning:
When the market moves X%, and the industry peers move Y%, and Treasuries Z%, what is the expected move in your stock?
Building out factor indices and betas is topic *2) Factor Index Betas.*
But all of the above share a common theme:
You decided in advance what factors move the stock, and only asked: 'by how much?'
But what if you're not sure what factors matter?
PCA solves that problem.
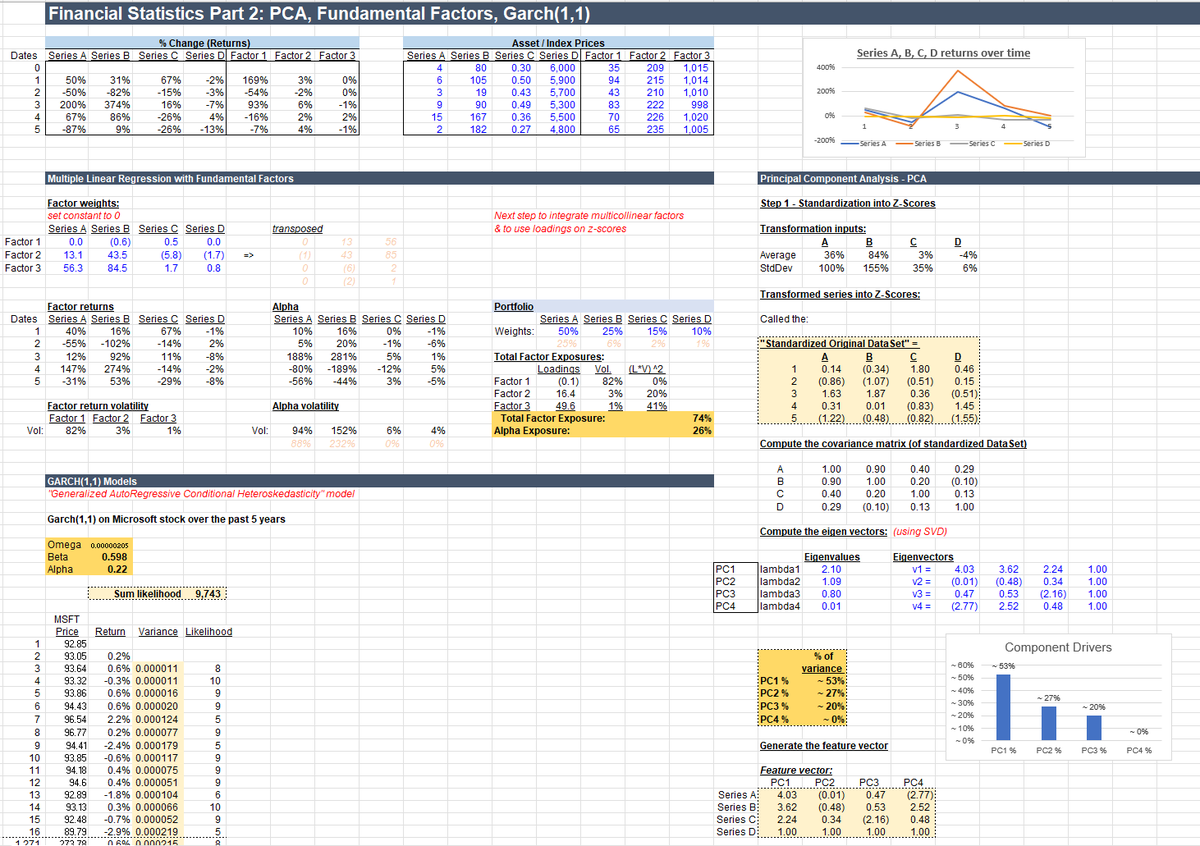
Math attached, but in concept the PCA says:
Let's assume nothing about what moves stocks, and let the data tell us.
To do that it clusters the returns data across many dimensions.
And simply points to the largest clusters, and ranks them.
The bar chart below stack ranks the identified factors ordered by Principal Component (PC) eigenvalue.
A good heuristic to determine which factors are useful is to ignore those that contribute less than average. So if there are 4 PCs, ignore those contributing sub-25%.
In this case, only PC1 is useful, and explains 53% of the total variance.
All four series have high positive loadings to PC1, meaning it is noticing that all have a strong positive trend, and clustering that behavior into a single new factor.
*3) GARCH(1,1) vol modeling*
"Volatility" tells you how much a stock varies day-to-day.
If that vol is consistent, it's easy.
But what if the vol itself is volatile?
"GARCH" is the most common solution.
It assumes volatility today is correlated with volatility tomorrow.
And that assets have periods of consistently high vol and periods of lower vol.
Math attached, but it makes a simple prediction:
What should tomorrow's vol look like as a function of today's.
As the stats become more complicated, the risk of hidden assumptions grows.
Without care, assumptions can "stack" on top of each other.
But if done well, statistical models tame some of the chaos of the thousands of datapoints investors ingest daily.
One solution is to go deep, be vigilant against subtly wrong assumptions and build systems on top of your statistical models.
The other is to keep these models peripheral, being "factor aware" but using these tools for insight and awareness, not as a core driver of portfolio construction.
The reality is that the world defies even the most sophisticated modeling.
The key with any tool is to understand its limits, make conscious choices, and bet on your best judgment in a world of imperfect alternatives.
That's all for now.
Like & comment if you want the excel backup.
An entire MBA fits on one page.
But you better know the math cold.
Like & comment if you want the excel.
6 topics:
*1) Unit economics*
This builds from product-level unit economics to company financials.
Quantity per unit, growth in units.
Price per unit, growth in pricing.
Cost per unit, marketing spend per unit.
Get you return on ad spend (ROAS), customer acquisition cost (CAC), LTV/CAC, gross margins, unit contribution margins, and more.
This model sets up two diverging products:
A higher gross margin (GM), higher marking cost, low pricing power, low growth product.
Against a lower GM, better pricing power, better growing, lower unit market cost product.
To show how the dynamics of the two play out over time.
*2) Accounting*
Unit drivers flow into revenue, variable COGS, and variable SG&A.
Then to EBITDA, EBIT, EBT, Net income & EPS.
Simple cash flow statements & balance sheets reconcile D&A to inflation-adjusted replacement CapEx, debt levels, & GAAP PP&E.
You have to be fluent in accounting to look at public companies.
Not because accounting itself matters.
But because accounting can obscure what matters.
And your task it to translate GAAP into meaningful business logic.
*3) Operating ratios*
Unit drivers output financials, financials output overall business ratios.
Revenue growth, EBITDA growth, EBITDA margins.
Contribution margins (= change in profit over change in revenue).
Net debt-to-EBITDA, net debt % of EV.
*4) Valuation*
You can drive valuation on multiples or a DCF.
Which are equivalent:
The discount rate minus the growth rate determines the 'terminal multiple.'
Using a P/E instead of a DCF simply uses next year as the terminal value.
This model drives value from the DCF, and maps that to the multiples to show how they connect.
*5) Corporate finance & DCFs*
DCF math attached using the CAPM.
The summary is a beta from historical returns, add the cost of debt.
To get the WACC - the theoretically correct discount rate.
DCFs are extremely assumption laden - you can get out almost whatever you want.
But realistically.
Your banker (or analyst) will make the math work out to a 7-13% discount rate.
Depending on the risks, industry, markets - and what they want to achieve.
*6) Sensitivities & the hard part*
The last section sensitizes the equity value and multiples to unit and price growth.
Bringing unit drivers full circle to valuation outcomes.
Ultimately, the hard part isn't the math.
You have to be fluent in the math, its nuances and its limitations.
If not, you will lose out to those who are.
But once you are, you also have to shift focus.
To the hard part.
Which is always in filling in the numbers.
If you're investing, that means thoughtful views on unit drivers; on how, when, and why they shift.
And if you're building, it means making the numbers on the page happen.
That's all for now.
Like & comment if you want the excel.
@alc2022 $MSFT Proven, FCF machine, will be more soon, though maturing, but decent growth is present and will start more share buybacks when mature. More certain than $AMZN to generate returns. However, if $AMZN can execute, it will surpass $MSFT, but will take $MSFT for now with Satya
Most useful ChatGPT prompts for investing:
•Explain it like I’m 5.
•How is X different from Y
•How could X take marketshare from Y
•How could X reach a new ATH/ATL
•How could X be disrupted
The answers are a nice starting point for research. What have you been asking?
Everyone thinks $TSLA consists in @elonmusk being a genius all day, but at this stage it´s actually one of the world´s top organizations with or without Elon.
An underrated place to learn from:
DeFi Governance forums.
Well-written proposals show clear thinking & strategy.
Also, you'll learn so much from watching gigabrains debate - it's like the nerd version of the Coliseum.