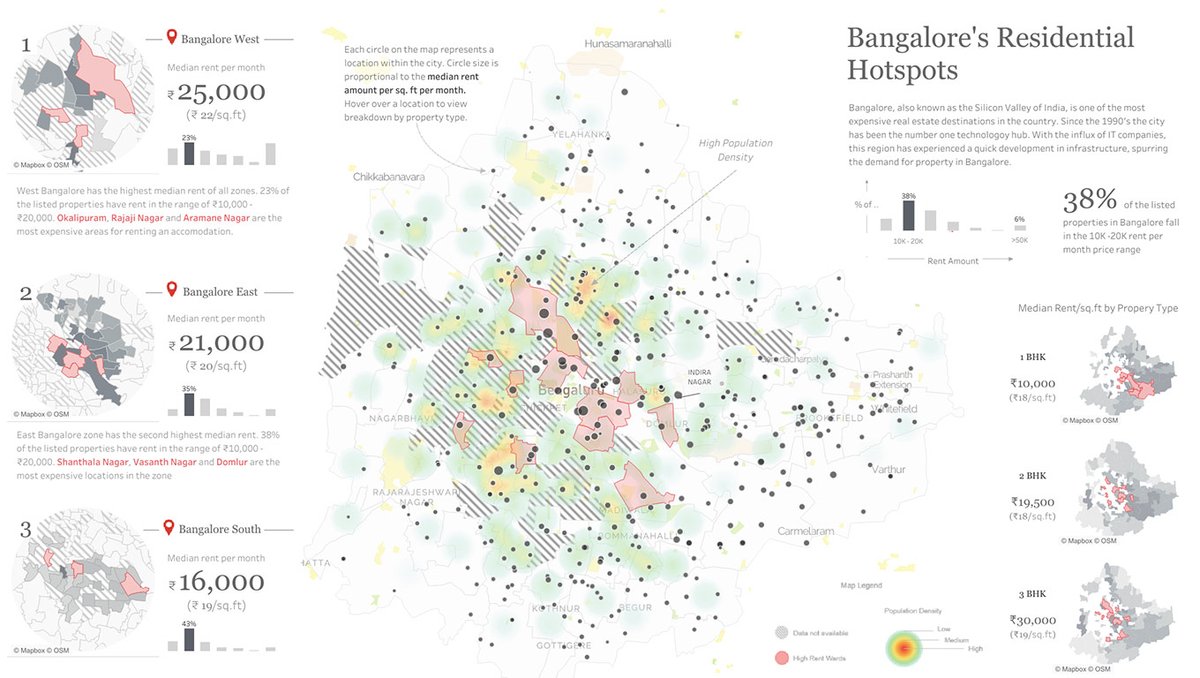
Bangalore, also known as the Silicon Valley of India, has been the number one technology hub since the '90s which has led to quick development and high demand for properties. Explore this #VOTD by @kizley to see the city's residential hotspots: https://t.co/QtWbiea4Fm
Check out this #VizOfTheDay map by @DataLabs89, showcasing the areas you can reach by bike within 15, 30, and 60 minutes from the Indonesian Customs Headquarters. https://t.co/mjWHjPWQD0
Inspired by the work of @kizley and @MarcSchonwandt.
Uncover essential business KPIs 📊
Explore this #VizOfTheDay by @kizley for total sales, gross income, customer rating, orders, and more. Optimize performance and drive growth through data analysis. https://t.co/Y1nnO1f8bD
This #VizOfTheDay by @kizley visualizes the 2022 Gender Inequality Index across 170 countries. Explore this metric by region and country. https://t.co/FzPqFPLvAw
Hi #datafam , I made the All Industry Winning Tableau KPI Dashboard #Template for all.
👉https://t.co/4TgYZF0NbG
🔥You can download a workbook and save your dev time.
inspired by @ellenblackburnn and @pradeep_zen@AdrianZinovei@kizley thanks for sharing your knowledge first🥰
It's been a while since my last viz on @tableaupublic. Here's a look at the Gender Inequality Index across 170 countries reflecting gender-based disadvantage in multiple dimensions.
Thanks to @ladataviz for the easy to use beeswarm generator.
🔗https://t.co/31DTcCTEyc