I’m cautiously optimistic. My gut says most things still need more basing. If we’re at the start of a new bull leg, certain groups MUST participate. Meaningful legs higher never require catching the first advance. If the move has real duration, there will be several opportunities to get situated as a momentum trader. These are the thoughts that keep me patient and prevent me from getting chopped.
To my right is Kelvin Chiu — the first Hong Kong trader to be featured in the Market Wizards series.
I had the pleasure of meeting him in Singapore today and having lunch together. (Photo posted with Kelvin’s permission. He also knows that I use the J Law avatar on social media.)
If you’ve read the newly released Market Wizards: The Next Generation, you’ll know that Kelvin grew up in Hong Kong, graduated from Cambridge, and went on to work at Goldman Sachs and Vitol, one of the world’s largest energy trading firms. During his proprietary trading years at Vitol, his best year generated $35 million in profits.
After leaving Vitol and trading his own capital, he compounded at 108.7% annually for 7 consecutive years, with a Sharpe Ratio of 2.0. Today, he focuses on his own family office.
So when you sit down with a trader like this, naturally I was ready to pull out my notebook and ask him everything I could about trading and asset management.
Instead, our conversation started with… our kids’ education. 😂
Long story short, here are some of the biggest takeaways I got from both his interview in the book and our lunch conversation today:
@KC_SilverCape@Clement_Ang17
That was Dow versus silver - here's Dow versus gold. If these were simply backtests, gold, silver, commodities, energy & oil are all heading up (way up) in the next few years.
THIS IS HOW YOU MAKE MULTI-MILLIONS OVER THE NEXT 10 YEARS
This is how I and many will RETIRE early.
The biggest opportunities come from understanding where capital flows NEXT.
Here’s how I believe the AI Supercycle evolves:
1. AI INFRASTRUCTURE
Capital flows into the companies building the foundation.
• Compute: $NVDA $AMD $AVGO $ARM
• Memory: $MU $SNDK $WDC $STX
• Networking: $ANET $MRVL $CRDO
• Photonics: $COHR $LITE $AAOI
• Data Centers: $VRT $IREN $NBIS
• Software: $PLTR $NOW $ORCL
2. POWER + ENERGY
As AI scales, electricity becomes the next major bottleneck.
• Power: $ETN $PWR $HUBB $GEV
• Nuclear: $CEG $CCJ $OKLO $SMR
• Copper: $FCX $SCCO $TECK
• Critical Materials: $MP $ALB $SQM
3. PHYSICAL AI
Then intelligence moves into the real world.
• Robotics: $TSLA $SYM $ISRG
• Autonomy: $ACHR $JOBY $MBLY
• Defense: $KTOS $AVAV $RTX $NOC
• Space: $RKLB $ASTS $LUNR
4. NEXT GEN COMPUTE
• Quantum: $IONQ $RGTI $QBTS
You don’t need to own everything.
Find where capital is flowing → identify the leaders → rotate as leadership changes.
We will all get rich together .
Jesse Livermore's 10 Key Trading Principles that made him a Legend:
#1 Livermore's wealth was built primarily from big position trades that lasted for weeks or longer. He made his big money holding a trend, not scalping or day trading. Which was very difficult in those days, with commission costs and speed of execution.
"Money is made by sitting, not trading."
#2 Livermore pioneered the idea of having big wins and small losses. He held large short positions through both the 1907 and 1929 stock market crashes and let the winners run.
"It was never my thinking that made the big money for me, it was always my sitting."
#3 The quality of his trade entries is something he did based on price movement. He traded price action, not fundamental valuations.
"Buy right, sit tight."
#4 He liked to see follow-through confirmation before he made an entry.
"Do not anticipate and move without market confirmation—being a little late in your trade is your insurance that you are right or wrong."
#5 He focused on a small watch list to become an expert on its specific price movements.
"{Limit} interest in too many stocks at one time. It is much easier to watch a few than many."
#6 If he had a stock making higher highs, he would hold it until there was a good reason to sell it. He ended up holding stocks that were under accumulation.
“As long as a stock is acting right, and the market is right, do not be in a hurry to take a profit. You know you are right, because if you were not, you would have no profit at all. Let it ride and ride along with it. It may grow into a very large profit, and as long as the action of the market does not give you any cause to worry,” have the courage of your convictions and stay with it.
#7 He never added to a losing position.
"It is foolhardy to make a second trade if your first trade shows you a loss."
"Never average losses, let that thought be written indelibly upon your mind."
#8 His rules said to cut losses quickly when wrong and keep losses small. This freed up capital to pursue better opportunities and avoided significant losses.
Profits always take care of themselves, but losses never do. The speculator has to ensure himself against considerable losses by taking the first small loss. In so doing, he keeps his account in order so that at some future time, when he has a constructive idea, he will be in a position to go into another deal, taking on the same amount of stock as he had when he was wrong."
#9 He knew his best trades were winners right from the start.
"Experience has proved to me that the real money made in speculating has been: "IN COMMITMENTS IN A STOCK OR COMMODITY SHOWING A PROFIT RIGHT FROM THE START."
#10 Jesse Livermore did not trade unless the market presented him with a good opportunity from an entry from a risk/reward ratio standpoint.
"There is a time for all things, but I didn't know it. And that is precisely what beats so many men in Wall Street who are very far from being in the main sucker class. There is the plain fool, who does the wrong thing at all times everywhere, but there is the Wall Street fool, who thinks he must trade all the time. Not many can always have adequate reasons for buying and selling stocks daily, or sufficient knowledge to make his play an intelligent play.”
THIS IS HOW YOU RETIRE IN THE NEXT 5 YEARS.
I’ll be following where capital flows.
This is how I believe the AI Supercycle evolves:
2026–2027: AI Infrastructure
AI demand accelerates.
Capital pours into the companies building the foundation.
• AI Compute: $NVDA $AMD $AVGO $MRVL
• Memory: $MU $SNDK $WDC
• AI Infrastructure: $VRT $SMCI $NBIS $IREN
2028–2030: Power & Grid
AI becomes an energy problem.
Capital shifts toward:
• Power Infrastructure: $VRT $ETN $PWR $HUBB
• Battery Materials: $ALB $SQM
• Copper & Grid: $FCX $TECK $SCCO
• Rare Earths: $MP $CRML $USAR
• Nuclear: $CCJ $UUUU $SMR $OKLO
2030+: Physical AI
Intelligence moves into the real world.
Capital expands into:
• Robotics: $TSLA $SYM
• Autonomous Mobility: $ACHR $JOBY
• Defense: $LMT $NOC $KTOS $AVAV
• Space: $RKLB $ASTS $LUNR $PL
Bookmark this.
The biggest winners usually come from following capital before everyone else.
1/
The #1 skill in trading isn't finding huge winners.
It's avoiding huge drawdowns.
A 50% drawdown requires a 100% gain just to get back to breakeven.
The best traders obsess over defense first.
🧵👇
I'll add: Just think about the psychology of an average investor
1) New to the market, sees everyone making money, does 'research' and buys a couple of AI stocks. Stock picks happen to be the 'right ones at the right time'.
Catches >100% moves and thinks he/she got it figured out.
2) In an attempt to get out of the permanent underclass, investor does the following: (A) Mindlessly adds to positions/initiates more positions, (B) Goes on leverage just for the added thrill because everything is working too well.
3) Euphoria happens at the tippy top, investor becomes complacent and develops the belief that the party lasts forever.
4) First signs of trouble hits, average investor thinks: 'no matter, it's a small correction - minor setback for a major comeback'.
Proceeds to hold on to bagged new positions and DOUBLES DOWN. Portfolio is now 250% invested on max leverage.
5) Chop chop chop distribution phase. Portfolio moves up and down 10% a day.
'This is the base building period before we go to the fkn moon', the investor thinks.
6) Market tanks, growth stocks unwind, 'story' growth shitcos unwind harder. Margin calls arrive, positions get liquidated. Positions are now bagged at the top.
'I'll be a long term investor, it will be much higher 10 years from now' the investor thinks.
7) Market tanks even harder. Portfolio drawdown hits 50-80%. Investor now panics or is in denial: the phase we are in now.
8) As the drawdown worsens, investor doesn't think about new highs anymore, he thinks about getting out at BREAK EVEN OR SMALL LOSS. This is how supply is created as stocks climb back higher.
----------------------------------
I'm not saying this to crap on folks hurting. I say this out of tough love because I've been there before - THIS IS HOW TRADERS BOOM AND BUST. A 70-80% portfolio drawdown after being up hundreds of percent YTD is psychologically very challenging. The math works severely against you because losses compound geometrically.
This is the main reason why I told myself that I'll never be an investor. I just cannot put myself through that pain anymore with the responsibilities that I have.
If I can swing trade and make 40-50% a year consistently regardless of market conditions, that is good enough for me compared to a 4000% return and then watch it come back down 70% on me again.
Risk management is a feature of the game, not a big! Hope this helps someone out there hurting right now.
Here is my Climax Top Checklist which helps me determine when I need to start exiting a position.
CLIMAX RUN CHECKLIST (HTMMIS VERSION)(18+ weeks from 1st or 2nd stage base or 12+ weeks from 3rd stage or later stage bases)
1. Up 25%-50%+ in 1-3 weeks(looks like a parabolic rally - blowoff trend or "hockey stick look")
2. Up 7 out of 8 days, 8 out of 10 days, 11 out of 13 days
3. Close at least 70%-100% above the 200 day MA, at least 50% above the 50 day MA
4. Exhaustion Gaps or Gaps that lead to an "Island Top"
5. Breakout above Upper Channel Line(15+ weeks or 4-5 months)
6. Widest Weekly Spread
7. Largest Weekly/Daily Volume of the Advance which can be Weekly Stalling in the form of “Railroad Tracks”(spreads/closes of 2 weeks are side-by-side)
8. Largest Daily Point Gain of the Advance
9. 2 Weeks Down followed by 2 Weeks Up (very sharp “V” shape look)
10. Excessive Stock Split(s)
3 highest conviction themes long-term are:
1. Robotics
-> $OUST: Perception play growing ~49% YoY.
-> $CCXI: Pure humanoid bet.
-> $RRX: A way to ride the 300x boom in actuators.
-> $AEVA: Higher risk (feels like a venture bet) but a 4D LiDAR on robotics.
Can even include $MU in this basket.
And then extend this out to rare earths, critical metals etc as well... $USAR $MP $COPX.
2. Optics
-> $AAOI: Being supply constrained tends not to be a long term issue.
-> $CRDO: I still think $CRDO's optics exposure is underappreciated.
-> $POET: Another higher risk venture bet.
3. Application Layer
-> $LMND: Probably the clearest 10+ year thesis I see. The most real AI edge I see in the market.
-> $ZETA: Growing EBITDA ~22% CAGR got next 3+ years whilst trading at 12x NTM EBITDA.
-> $UPST: Market wide pullback across all fintechs isn't a long term worry.
One MIT lecture can reshape your financial mindset more than years of trial and error.
The difference between spectators and investors is often just one hour of focused learning.
A masterclass by Martin Luk: Why and how to short SKHY, one of the best trades he took recently.
https://t.co/ep8CBEq6cn
[23:35] - [32:50]
I just shorted a bit of SK Hynix. I would like to expand on this a bit. Generally, when I try to take a new trade, most of the time I would like to align with the daily and the weekly first. Actually, the first thing that I look at is the sector or the theme itself, whether they are doing well or not. I don't want to short the stock where its peers or its sector is doing very well, but it's a laggard in a strong sector. I don't want to short the laggard in a strong sector; I would like to focus on the stock in a weak sector. The more stocks look weak within that sector, the better the sector I would like to short, and vice versa. If I'm trying to go long, I would like many of the stocks to look great in an uptrend or show relative strength to the market, doing some bullish candlestick patterns like an undercut and reclaim, or building higher lows and showing some volatility contraction, maybe some inside days.
In this case, I think the semiconductor sector as a whole is just kind of weak to me compared to the market, and I don't really like the volatility and the volume expansion up there. That's the big picture behind there: the first thing is the sector and the theme, and then going to the individual stock.
SK Hynix is definitely one of the huge leaders that is extended into the upside, and now it is breaking down below the 50 EMA. This is the first bounce into the declining 50 and also bouncing into the declining 9. This is the underlying South Korean stock chart. I really love shorting at the first bounce or the first pullback. It also aligns with the previous swing lows from the bear flag here and the declining weekly 9 EMA. This is the daily and also the weekly too. Although the weekly is not that much, the weekly volume expansion is definitely some sign of distribution that I don't really like.
For the intraday, you guys know I love shorting it on the bounce. Luckily, I didn't short at the opening range lows. We got a quick flush into the previous high on this ADR launch date. I consider this as the previous swing high, then it built support, rallying into the unfilled gap and also the declining 9 EMA. Before the close, before it really turned lower, the 9 EMA was around 187. You can go back to the recordings and see how the 9 EMA looks. It was also near the unfilled gap from this huge green candle. We got an unfilled gap below the 188.50 area.
I'm looking at these levels. I think it's definitely okay to overshoot a bit, maybe into the 189 or 190 level. It did find some resistance at 188. When I saw this five-minute candle gradually losing the momentum, I zoomed in into the one-minute chart and used the anchored VWAP on the one-minute chart. This is the technique that I learned from Kristjan Qullamaggie when he's doing parabolic shorts; he always links it to either the anchored VWAP from the open or the high of the day. He uses this on parabolic shorts, but I noticed that it works pretty well on other entries as well. I utilized this entry tactic into this trade.
We got a one-minute bounce into the anchor. I think this is one of the best trades I've taken recently, and hopefully it works out. But if it doesn't, I think this entry is one of the best this year, definitely. We'll see how it plays out. The stop is pretty tight, and I think the entry is pretty concise and logical at that point. Definitely, you can wait for the five-minute breakdown, but the stop will be a little bit wide. Maybe I would have to set it up to this bar's high, which would be a 2% stop. That's why I always look for other types of entry strategies to really tighten my stop and find the best potential risk-reward entry.
Also, the weakness of the whole semiconductor sector and Western Digital helped. Western Digital is the one that I didn't take on the opening range low breakout, and it just went down like gravity, like a bungee jump, showing huge weakness. It also helps the short on SK Hynix too.
The pattern itself is not the most important thing for taking a trade to me. It's all about the theme as a whole, the sector as a whole, and then gradually zooming into the individual stocks—the weekly, the daily, and then the intraday. Sometimes I may also compare it with the index or the sector ETF to really nail the intraday entry, but it really depends. The precise entry really depends because I don't think there's any chart pattern telling you to short right here; I just couldn't find any.
But I would consider this short a really good entry and a really good trade, no matter how it's going to end up. Actually, if you don't look at today's candle, this pattern as a whole is a bullish pattern. It is called a Morning Star, I think, something like that. A red candle with a doji and then a huge green candle on the right-hand side. It's actually a bullish pattern, but I think the pattern really doesn't matter. It's just a gimmick.
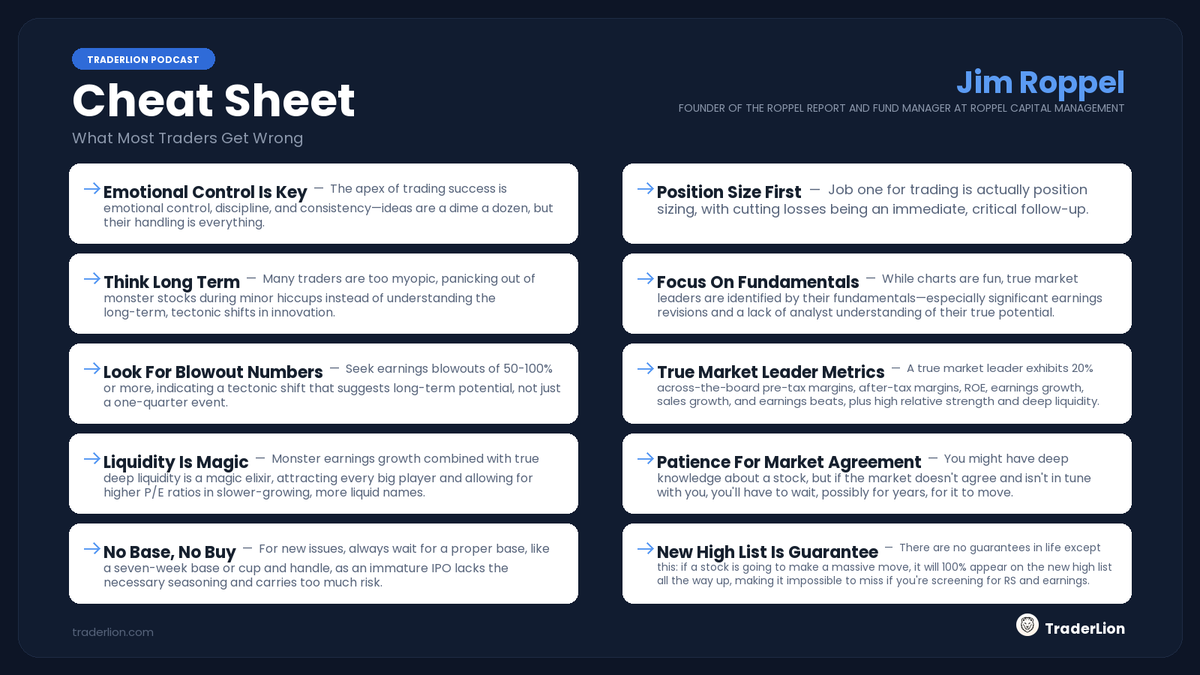
Jim Roppel, Founder of The Roppel Report, opened the 2026 TraderLion Annual Trading Conference — discussing current markets, AI, and what most traders get wrong.
10 lessons in one cheat sheet 👇
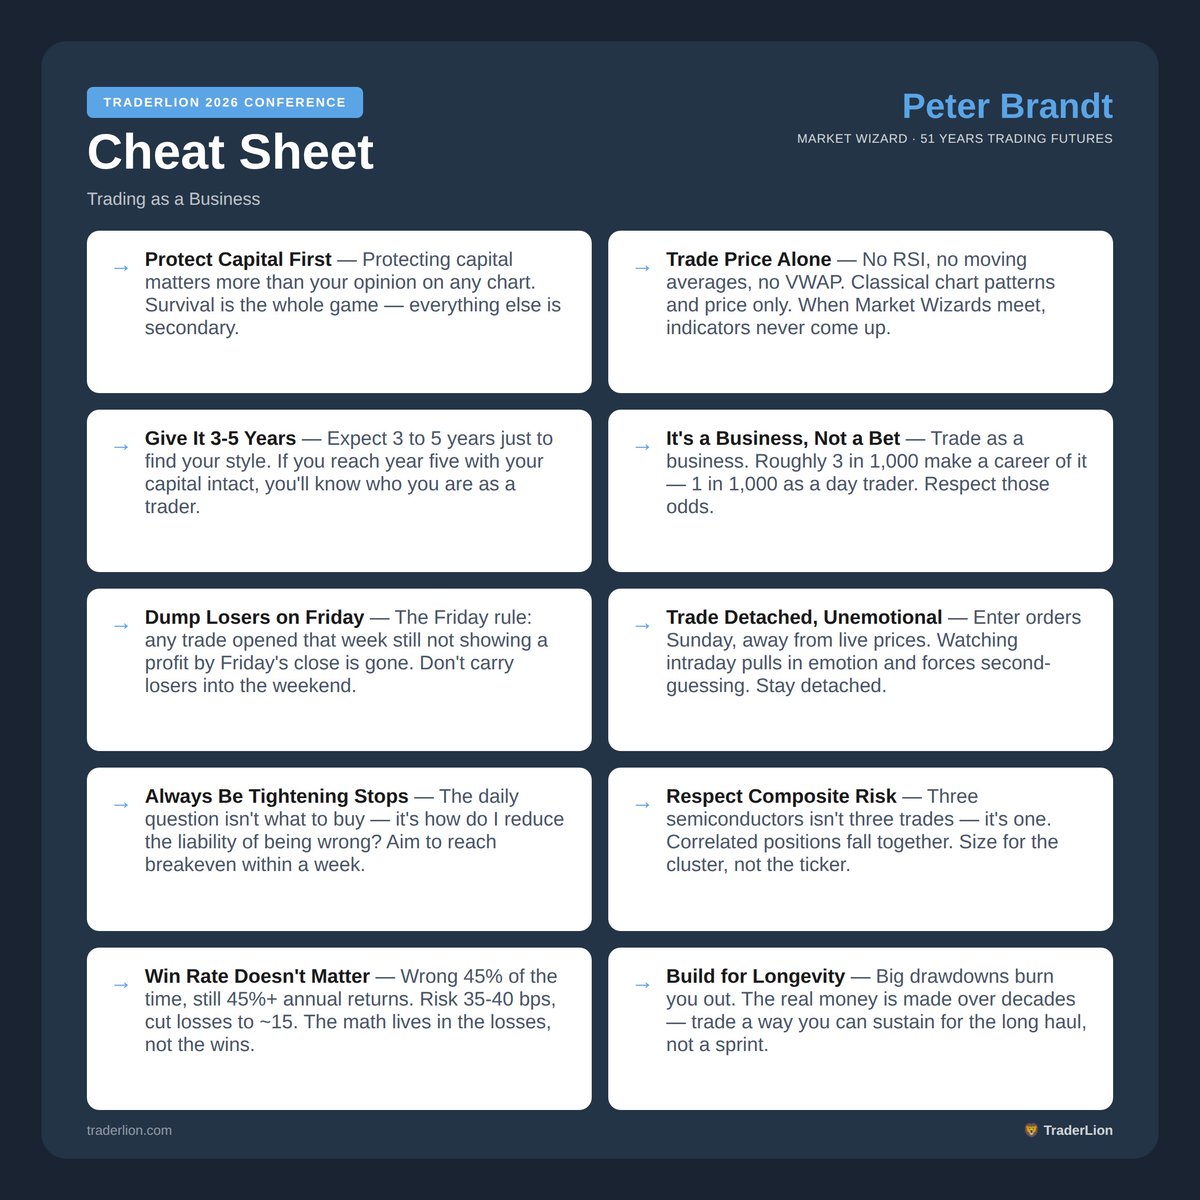
Market Wizard. 51 years trading futures. One of the most respected chartists alive.
Peter Brandt (@PeterLBrandt) broke down how he's traded profitably across six decades — risk, process, and treating trading as
a business.
10 lessons in one cheat sheet 👇
This will make you millions in the stock market. Save this so you ALWAYS know what will happen.
One of my secrets is always monitoring HEAVY truck sales.
When the economy turns weak, companies are the first to react by lowering spending and procurement, causing heavy logistics to decrease. Conversely, when economic conditions improves, the purchase of trucks would rebound. It's that simple.
When truck sales are above 0.47M (top quartile):
1. economy is running hot
2. start playing a bit more defensive
3. raise quality in your portfolio
When truck sales are between 0.25M and 0.47M:
1. normal range
2. stay the course
3. hold your winners
When truck sales crash below 0.25M:
1. the economy is bottoming
2. get aggressive
3. this is where generational wealth is built
Right now?
Truck sales are at 0.43M. 73rd percentile. Not in the danger zone yet.