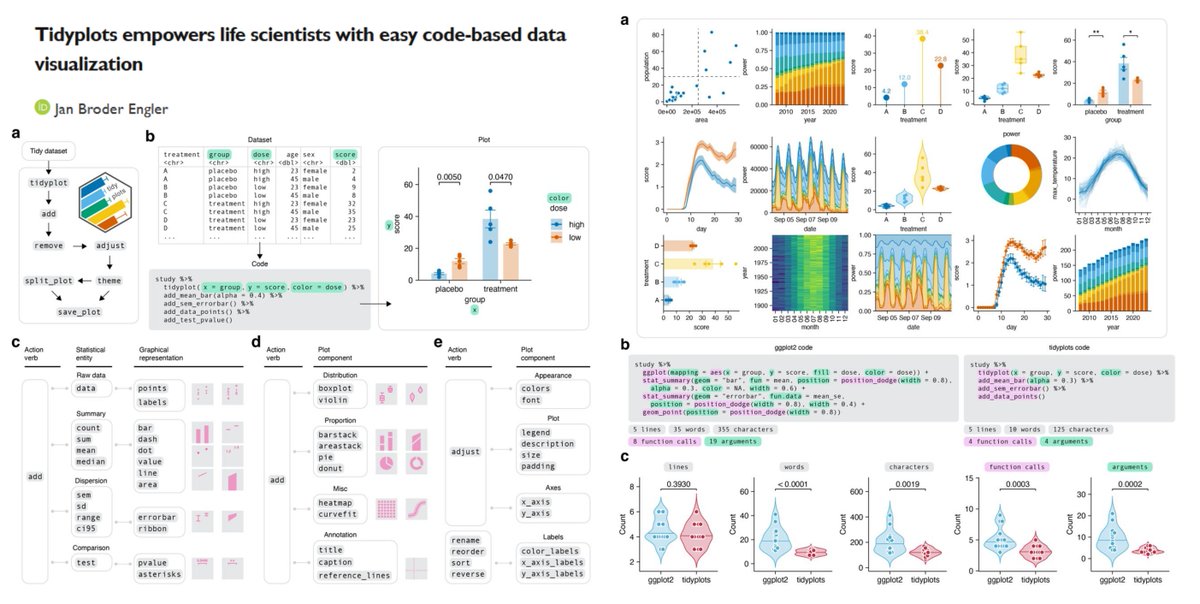
tidyplots
Time to say goodbye to ggplot2?🫡
"a significant reduction of code complexity" vs ggplot2
https://t.co/6wKFnRrjMn
@JanBroderEngler bioRxiv 2024
https://t.co/rqvyMsj5JK
@lgamon That's odd. Using a method like this for in-batch calibrating for example a blank in between runs (same IM slope) should work. The signal is definitely enough. Let me get back to you tomorrow.
@lgamon There has been a change in the software. Now all three masses have to be visible for a successful calibration. Often, the 1222 is not visible as it requires at least 1.45 1/k0 on the upper IM range. Is this maybe the issue?
Proteomics goes viral! We present vPro-MS to identify human-pathogenic viruses in patient samples from diaPASEF/DIA data. We developed a peptide library covering the human virome from 20,000 genomes, which enables highly specific detection (>99,9%) using vProID scoring.
@UCDProteomics @neely615 @JeremyBalsbaugh@lgamon For full functionality in DataAnalysis a licence is necessary that's true. If no floating licence is present it can be operated in Viewer mode. In viewer mode you cannot create traces, but if traces are already saved within the .d (e.g. by a script), you could have a look at them
@JeremyBalsbaugh@lgamon @neely615 My DMs are open if you need assistance. I can also share a DA script with you that does TICs, BPC and EICs that are set in a .csv. You can edit the respective peptide masses in the .csv to get your desired output.
@lgamon@JeremyBalsbaugh @neely615 If you have certain traces (TIC MS, TICMSMS, BPC, EICs of your favorite peptides) that you monitor all the time, you can set them up in a DA script and let it run after finished acquisition using the "Automated Processing" Function in HyStar. Traces are then shown instantly in DA
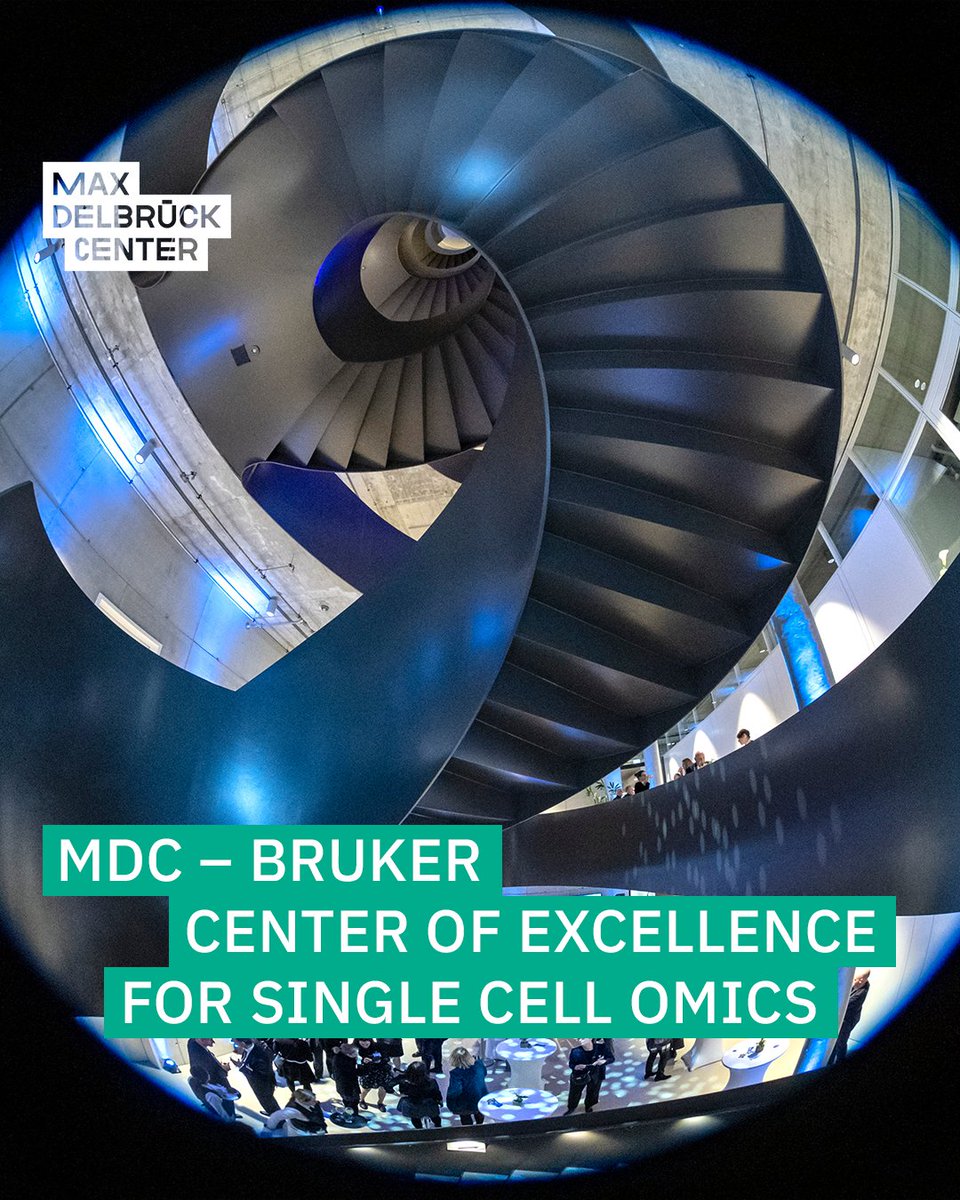
The #mdcBerlin and @bruker are proud to announce the launch of the MDC – Bruker Center of Excellence for #SingleCellOmics! 🎉 Join us on July 8th at @BIMSB_MDC to learn more about the center's mission and goals.
Full program and registration 👉 https://t.co/qYoazS1bnj
Thrilled to finally see µPhos published in @MolSystBiol! A big thank you to @fmeierX, @SeanJHumphrey and all other coauthors for this exciting journey! Check out our greatly improved and extended story on how to unlock the true power of phosphoproteomics: https://t.co/2Q8VT5y3gu
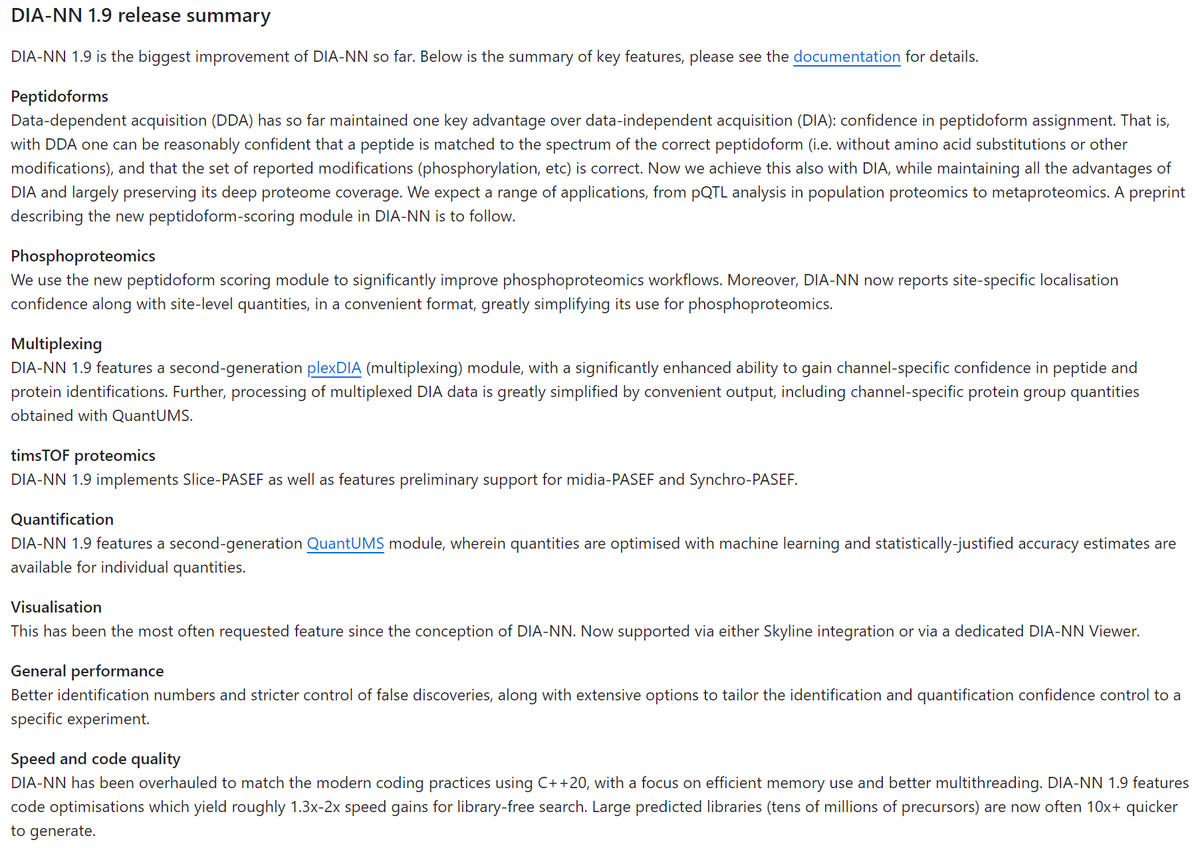
Excited to announce DIA-NN version 1.9, our software suite for proteomics data processing!
A range of cool new features and general performance improvements. We consider it the most significant update in the history of DIA-NN.
https://t.co/RKzniysMLg
To get there was quite a journey, but finally it is out: Our massive High-Throughput #Proteomics study on sepsis with >4500 LCMS runs using #Evosep, #Bruker#TimsTOF and #Fragpipe: https://t.co/XwmKaHUkN8
A new resource to assist with scalable & multiplied single-cell proteomics.
It describes a workflow using nPOP and plexDIA on timsTOF systems.
https://t.co/Frt0xdTwRJ
https://t.co/rrD9yEQ5OP
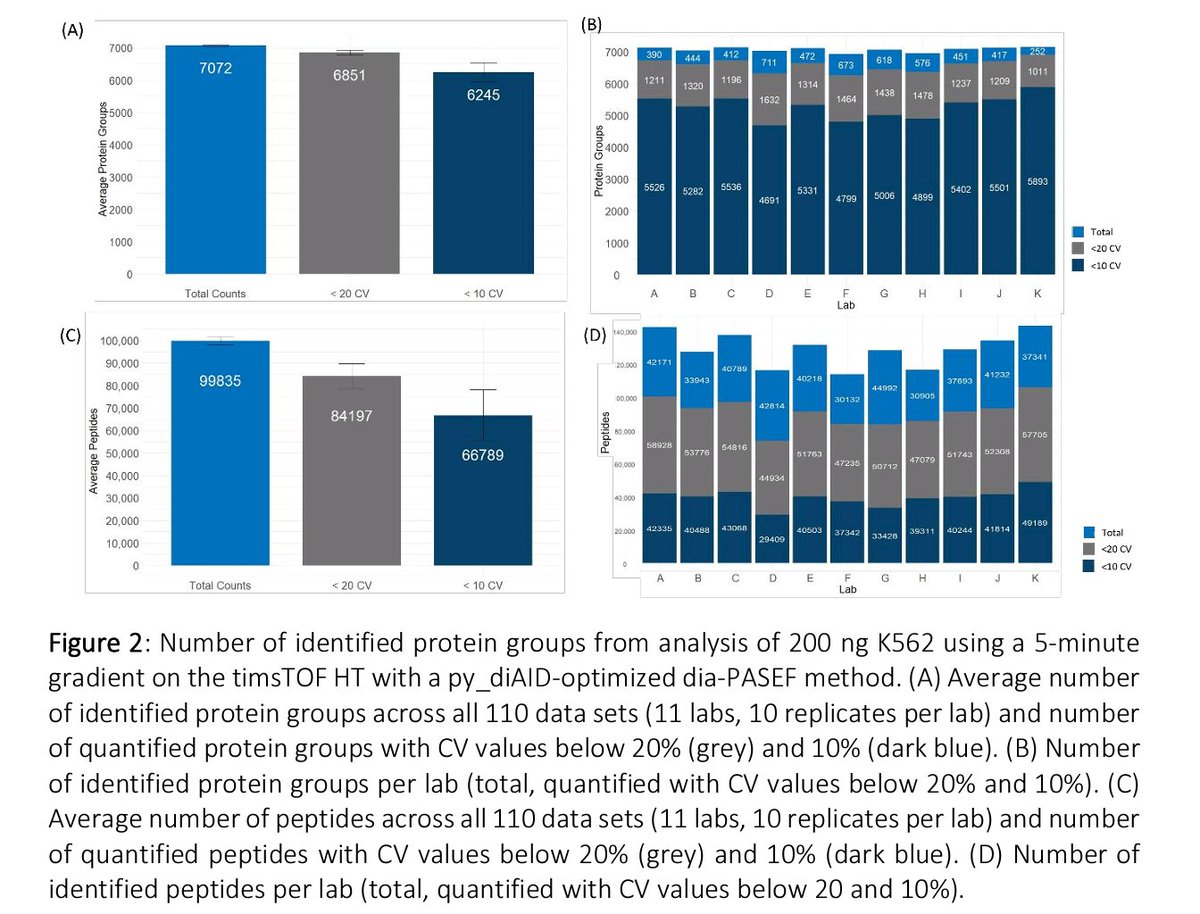
On average, >7k PG and >99k peptides were identified with 200 ng K562 digest with low variation. Also, differences between regularly used QC-standards were assessed (K562, HeLa, and HEK (in-house digest). The SOP provided to the laboratories is available in the supplement
Check out our newest preprint where the same instrument setup (nanoElute2 + timsTOF HT) was used in 11 laboratories to evaluate the performance and reproducibility using short 5-min gradients.
https://t.co/31lCB0sNlY