@AHS_Warranty Multiple escalations and your team still can not correctly identify the inspection report clearing one HVAC system and a seperate HVAC report from your own partner company clearing the 2nd HVAC system. So all service requests are rejected. AVOID THIS COMPANY!
Active housing inventory shift in America's 50 largest metro area housing markets
That 5-year change column is the most important, IMO
ResiClub PRO members just got my latest inventory analysis, plus data for +800 metros and +3,000 counties: https://t.co/PFUwdfQuwx
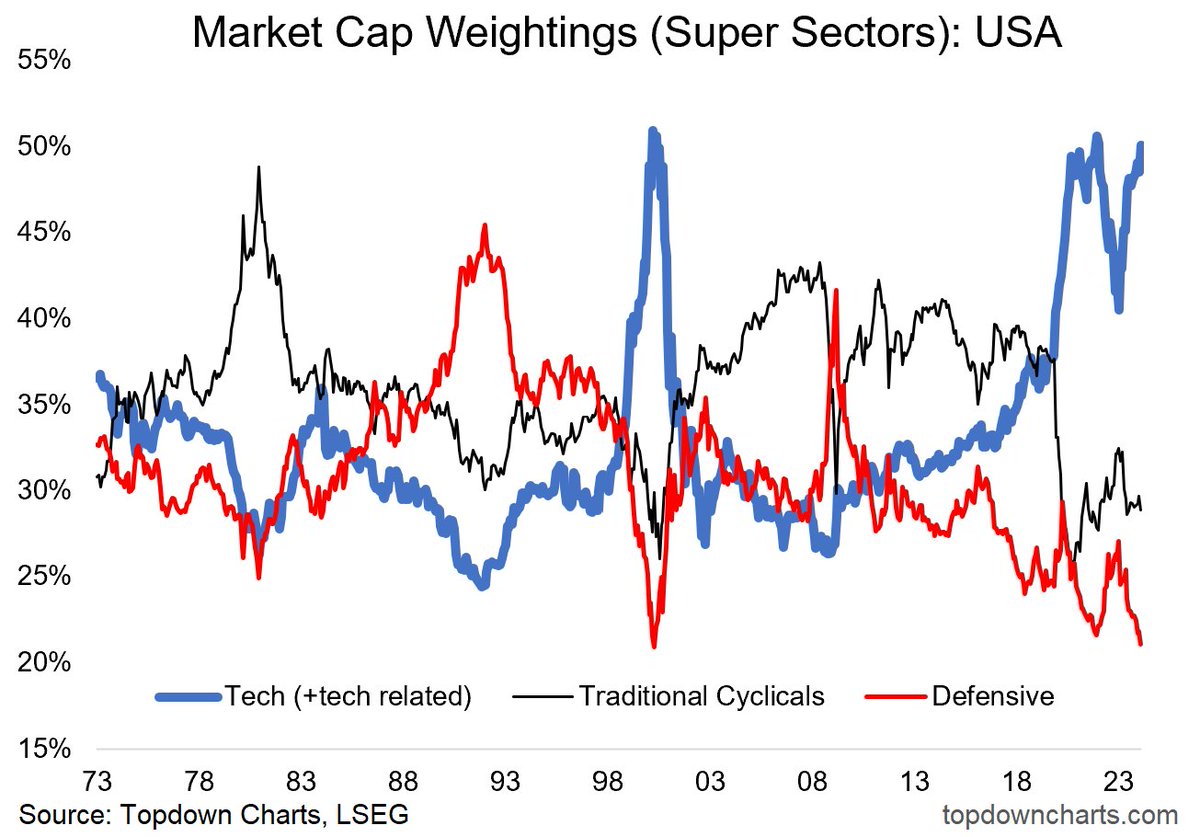
Chart of the Week - Giddy Index Investors
Index investors are perhaps unwittingly piling into tech and shunning defensives...
This chart may come as a surprise — maybe a shock — to those chilling in index funds.
Before we dive into the detail and implications of the chart, the key thing to remember is that index investing is not passive, it is an active strategy administered by index companies where in the case of a market cap-weighted index, the *strategy* is to “just buy the biggest stocks“.
Given the cheap cost (and success) of this simple strategy, it has become the most popular way of investing in stocks by fund investors (with passive funds taking the dominant share of total funds under management and net new flows).
It’s a strategy that works well in winner-take-all trending market regimes (e.g. the rise and rise of big tech), as it automatically skews investors into the bigger winningest sectors and stocks, and out of the losing sunset stocks and sectors.
The side-effect?
The chart below says it all.
Index investors in a typical market-cap weighted US equity index have almost a 50% exposure to tech and tech related sectors*.
Meanwhile, the index has become far less defensive than usual (almost a record low cap weighting to utilities, consumer staples, healthcare).
This makes an index investor all the more exposed to any downside in tech stocks by having both a greater weighting to that sector and smaller weighting to defensive sectors (which typically fall less or sometimes even hold ground during a downturn; hence the term defensive).
There’s also the much smaller weight than usual to traditional cyclicals (like energy, materials, industrials, financials) — which means the US will gain less in a more traditional goods and hard activity based economic upturn (p.s. Global ex-US is over 50% traditional cyclicals).
As a minimum this chart should make investors pause to think about sector allocations and implications in terms of exposure to risk — but also think more carefully about asset allocation. The lower defensive weight could be offset at the portfolio-level by defensive asset allocations (e.g. bonds, gold, other lower/non-correlated assets), or even tactically raising allocations to defensive equities (something I talked about in the latest report for clients).
An interesting, perhaps surprising chart — with important implications.
The U.S. Now Has:
1. Record $17.29 trillion in household debt
2. Record $12.14 trillion in mortgages
3. Record $1.60 trillion in auto loans
4. Record $1.08 trillion in credit card debt
Total mortgage debt is now more than double the 2006 peak and mortgage rates are nearly 1.5% higher than the 2008 peak.
Meanwhile, student loan payments just resumed for the first time since the pandemic with an average payment of $500/month.
This is all while new car loan rates are at a record 10% and credit card debt rates hit a record 25%.
What's the long-term plan here?
Subjects that should be mandatory in schools:
- Taxes
- Coding
- Cooking
- Insurance
- Weightlifting
- Self-defense
- Survival skills
- Social etiquette
- Public speaking
- Personal finance
- Car maintenance
- Basic home repair
- Stress management
What would you add?
@Dreadlock327 @stocktalkweekly They can not be 100% Apple. Certain chip technology can only be made by the big semiconductor players due to resources, IP, and even time to build a capable facility. Apple will always need parts from TSMC and Samsung.