South Africa legal team's Adila Hassim @CIJ_ICJ: “Genocides are never declared in advance, but this court has the benefit of the past 13 weeks of evidence that shows incontrovertibly a pattern of conduct & related intention that justifies a plausible claim of genocidal acts.”
"The first genocide in history where its victims are broadcasting their own destruction in real time."
Irish lawyer Blinne Ní Ghrálaigh
What a powerful argument!
"In a world as weird and cruel as this one we have made for ourselves, I figure anybody who can find peace and personal happiness without ripping off somebody else deserves to be left alone."
~Hunter S. Thompson
just found out that there’s avatar last airbender live in concert show coming to europe next year 🥲 i wasn’t prepared for this, there are sooo many great concerts and shows coming up, i am in tears
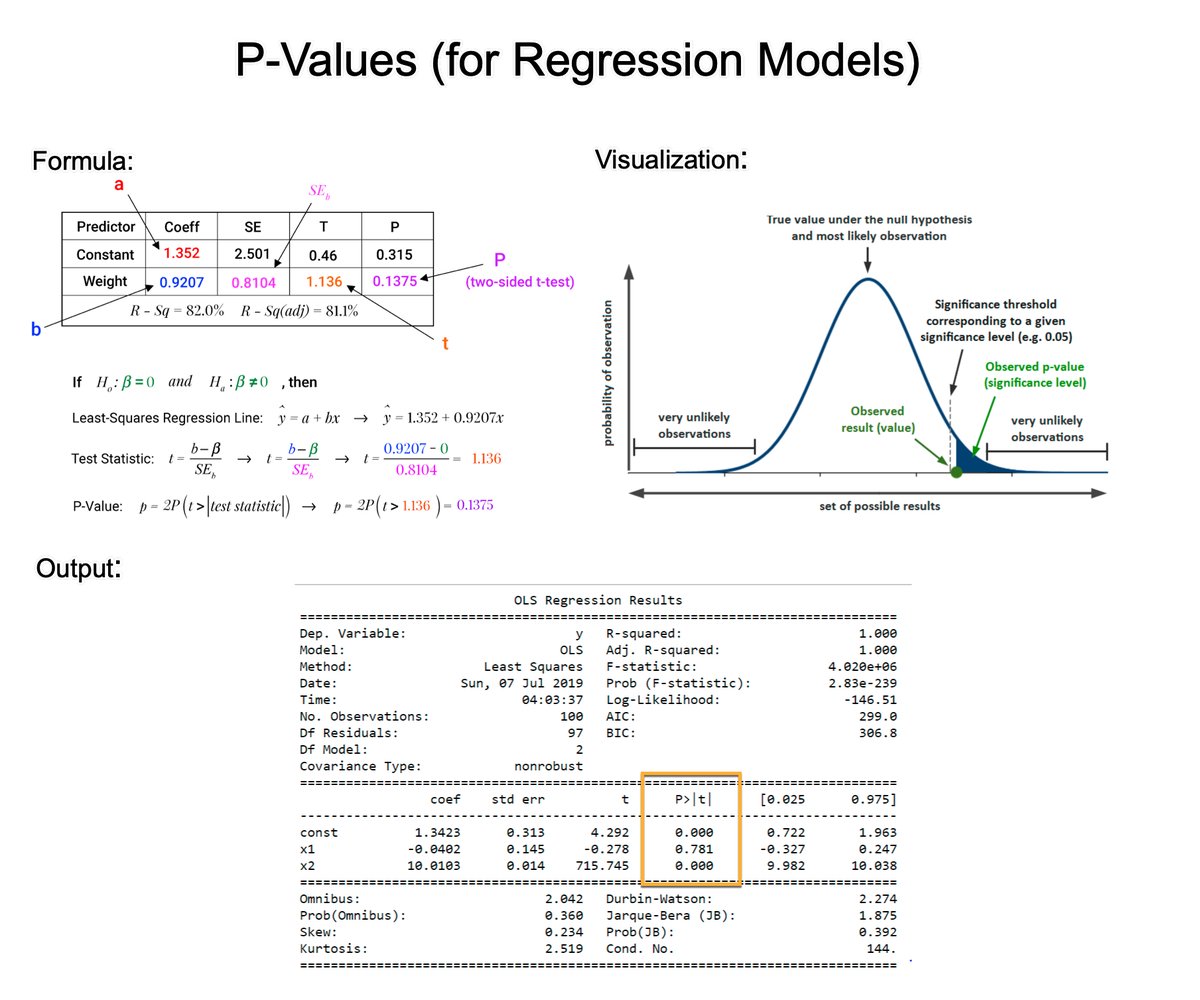
Understanding P-Values is essential for improving regression models. In 2 minutes, learn what took me 2 years to figure out.
1. The p-value: A p-value, in statistics, is a measure used to assess the strength of the evidence against a null hypothesis.
2. Null Hypothesis (H0): This is a general statement or default position that there is no relationship between two measured phenomena or no association among groups. For example, the regressor does not affect the outcome.
3. Alternative Hypothesis (H1): This is what you want to test for. It is often the opposite of the null hypothesis. For example, that the regressor does affect the outcome.
4. Calculating the p-value: The p-value for each coefficient is typically calculated using the t-test. There are several steps involved. Let's break them down.
5. Coefficient Estimate: In a regression model, you have estimates of coefficients (β) for each predictor. These coefficients represent the change in the dependent variable for a one-unit change in the predictor, holding all other predictors constant.
6. Standard Error of the Coefficient: The standard error (SE) measures the accuracy with which a sample represents a population. In regression, the SE of a coefficient estimate indicates how much variability there is in the estimate of the coefficient.
7. Test Statistic (T): The test statistic for each coefficient in a regression model is calculated by dividing the Coefficient Estimate / Standard Error of the Coefficient. This gives you a t-value.
8. Degrees of Freedom: The degrees of freedom (df) for this test are usually calculated as the number of observations minus the number of parameters being estimated (including the intercept).
9. P-Value Calculation: The p-value is then determined by comparing the calculated t-value to the t-distribution with the appropriate degrees of freedom. The area under the t-distribution curve, beyond the calculated t-value, gives the p-value.
10. Interpretation: A small p-value (usually ≤ 0.05) indicates that it is unlikely to observe such a data pattern if the null hypothesis were true, suggesting that the predictor is a significant contributor to the model.
===
Ready to learn Data Science for Business?
I put together a free on-demand workshop that covers the 10 skills that helped me make the transition to Data Scientist: https://t.co/LR39RJ5XKB
And if you'd like to speed it up, I have a live workshop next week where I'll share how to use ChatGPT for Data Science: https://t.co/EaMpKrJiqX
If you like this post, please reshare ♻️ it so others can get value.