Quant research without victory laps. Cost-adjusted backtests, OOS tests & timestamped paper trades. I publish winners AND failures. Building Teraliq Quant Lab.
I audit my own quant factors in public.
Posting the honest numbers — the ones I cut, not the ones I wish for.
Timestamped. Paper-tracked. In 2 years this account is either a graveyard or a track record. Follow to watch.
Appreciate you reading it, Skyler!
I really like that distinction — timeframe as a lens, not necessarily a holding period.
The way price approaches a level is something I've been thinking about too. A slow grind into resistance and a sudden liquidity sweep can tell very different stories.
I'm curious: when you zoom into 1m or 1s charts on low caps, what's the clearest sign that you're seeing bot activity rather than organic buying or selling?
I'd love to find a way to quantify that.
Can You Actually Make Money Trading Crypto on 5-Minute and 15-Minute Charts?
I’ve been trying to answer this question with code, not screenshots.
And one of the most useful things I've found so far is a BTC strategy that lost 97.5% of its simulated capital.
Yes. Minus 97.5%.
I didn't lose that money in a real account. It was a backtest. But the result forced me to reconsider what it actually takes to make money trading short timeframes.
Here's what I'm learning.
1. Finding a trading signal is surprisingly easy. Finding an edge is not.
Open almost any trading community and you'll see the same familiar strategies.
Donchian breakouts. RSI reversals. Moving average crossovers. Momentum. Volume spikes.
They all make intuitive sense.
Buy when price breaks resistance. Sell when momentum weakens. Fade extreme moves.
I wanted to know what happens when you stop looking at carefully selected chart examples and actually run the rules across historical data.
One of my tests was a straightforward Donchian(20) breakout system on 15-minute BTC candles.
Six months of historical data.
717 simulated trades.
16.7% win rate.
Final simulated return: -97.5%.
The result wasn't evidence that all breakout strategies are useless. It was evidence that this particular implementation, in that particular historical period, was nowhere near tradable.
And that distinction matters.
2. Transaction costs are not a footnote. They're part of the strategy.
This is the part of short-term trading I think deserves more attention.
Suppose I build a system that captures small price movements.
It might look profitable before costs.
But consider one of my current conservative test assumptions:
Trading fee: 0.10% per side
Modeled slippage: 0.03% per side
That's approximately 0.26% of round-trip notional before accounting for the bid-ask spread.
Twenty-six basis points.
For a $10,000 round-trip position, that's roughly $26 in modeled costs before spread.
The market doesn't care whether my signal came from a sophisticated neural network or a simple moving average.
If the expected opportunity is smaller than the cost of taking it, the strategy has a problem.
And trading more frequently doesn't automatically solve that problem.
Sometimes it makes it worse.
3. A profitable backtest can be the beginning of the problem.
I've become increasingly skeptical of strategies that look almost too good.
Not because profitable strategies can't exist.
Because there are so many ways to accidentally manufacture one.
A signal calculated using information that wasn't available at the time.
A historical dataset revised after the fact.
A fill assumed at the exact candle close.
A parameter selected after testing hundreds of combinations.
A strategy that survives one market regime and collapses in another.
Even a seemingly harmless timestamp mistake can change which information a strategy was allowed to know.
I don't think a beautiful equity curve tells me very much until these questions have been answered.
I want to know what happens when I try to break the strategy.
4. The real challenge is surviving outside the backtest.
This is where my research is heading now.
I'm testing BTC and ETH on both 5-minute and 15-minute timeframes.
The experiment separates four strategy sleeves and uses public market data, explicit cost assumptions, and timestamped observations.
I'm interested in the gap between a signal that looks good on historical candles and one that can actually be acted upon after the signal exists.
If a bar closes at 10:00, I can't pretend I knew the final candle values at 9:59.
If my system receives the signal too late, I shouldn't invent an earlier fill.
If a stop would have been triggered between observations, I need to admit the uncertainty instead of claiming perfect execution.
And if my data collection fails, that gap belongs in the record.
The automated forward-tracking infrastructure is still being validated. I don't have a completed live trading record or a proven profitable forward track record to show.
I'd rather say that publicly than manufacture confidence.
5. So, can you actually make money trading 5-minute or 15-minute crypto strategies?
I still think it's possible.
But possibility isn't evidence.
My working hypothesis is that any durable short-term edge must overcome transaction costs, adverse selection, changing market regimes, and competition from traders with better infrastructure.
That is a much harder problem than finding an indicator that looks good on TradingView.
I've stopped asking:
"How much did this strategy make in the backtest?"
I'm asking:
"What would have to be true for this strategy to keep making money after everyone has seen the signal?"
And more importantly:
"What evidence would convince me that I'm wrong?"
I'm building Teraliq Quant Lab to answer those questions publicly.
The strategies that fail will stay in the graveyard.
The ones that survive will face more difficult tests.
And if nothing survives, I'll publish that too.
No fake P&L. No guaranteed returns. No pretending paper trading is live execution.
Just an attempt to figure out whether a real, repeatable trading edge exists.
If you're building your own crypto trading systems, I'm genuinely curious:
What's been the biggest difference between your backtest and actual execution?
Fees? Slippage? Market regime? Or something you didn't expect?
I'd love to compare notes.
— Teraliq Quant
This is how I think AI should be tested in finance.
I'm researching BTC/ETH trading strategies on 5-minute and 15-minute charts.
What I want from Grok isn't another bot promising profits.
I want an AI that tries to break my backtests: hidden fees, lookahead bias, unrealistic fills, and overfitting.
Finding a false edge before risking real money might be more valuable than finding a new trading signal.
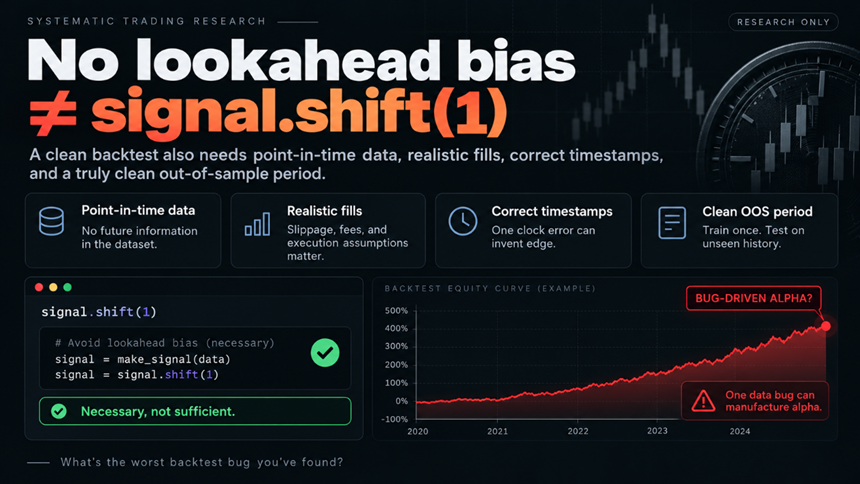
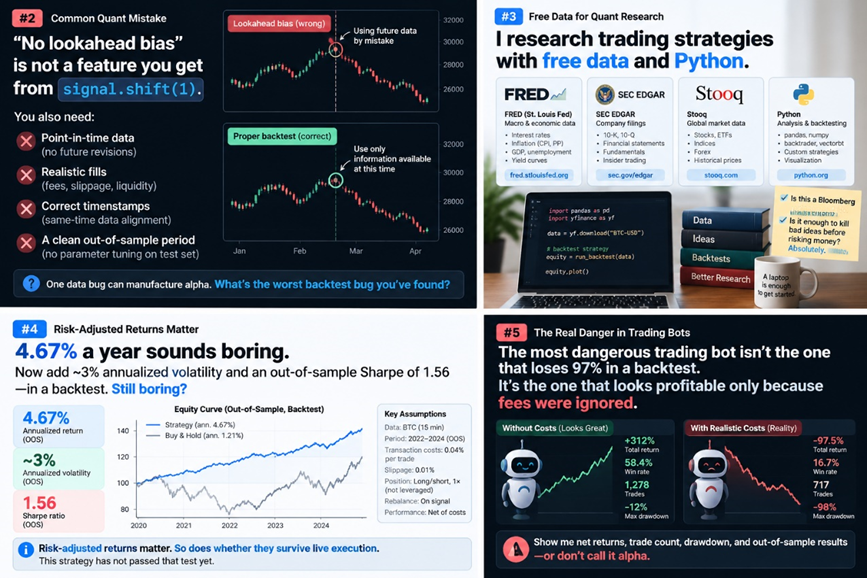
“No lookahead bias” is not a feature you get from signal.shift(1).
You also need point-in-time data, realistic fills, correct timestamps, and a clean out-of-sample period.
One data bug can manufacture alpha. What's the worst backtest bug you've found?
I tried to make money with trading bots for 3 months. Backtest: -97%. Paper run: -$33,134. The strategies weren't the problem. The math underneath them was. Here's the only "how to make money" lesson that survived:
The actual money-making skill is boring: know your round-trip cost. Fees + spread + slippage, both sides, before you trade. If your edge per trade isn't at least 2x that number, stop trading. Most people never compute it. That's the whole game at our size.
The most dangerous trading bot isn't the one that loses 97% in a backtest.
It's the one that looks profitable only because fees were ignored.
Show me net returns, trade count, drawdown, and out-of-sample results—or don't call it alpha.
Fair — single side, no inventory, the edge lives or dies on the call. The cutoff cut is the right next one. My prior before running it: in 5m windows the hedge has usually run away, so a forced exit locks a big loss, not a small one — the split would show how much of the −$532 was dead anyway vs cuttable. If it reruns, that's table #1, posted here.
Autopsy of a Viral Arbitrage
The top Polymarket bots assemble Up/Down pairs from prices that never existed at the same time. We built that trick, froze the rules before the first print, and measured where it bleeds. Locked profit: $33. Naked legs: −$532.
A breakdown of the top Polymarket bots has been going around — 900K views, built from 10 million+ executions across ten of the most profitable wallets on the platform. It is one of the best pieces of trading writing on this app this year. No course pitch, no referral funnel. Just how the machines at the top actually work.
Its signature move: in a $BTC Up or Down 5-minute market, the bot doesn't wait for Up + Down to cost under $1 at the same moment. It assembles the pair across time. Bitcoin dumps, Down crashes to 28¢ — buy 200. A minute later Bitcoin retraces, Up is offered at 47¢ — buy 200. Pair cost 75¢. One side settles at $1. The 25¢ is locked. The two prices never existed together.
We read that and did what we do with every claim that crosses our desk: we built it, and we ran it. This is the autopsy.
What we tested
The breakdown describes a seven-layer stack: a proprietary fair-value model, executable-edge math (depth, fees, slippage), inventory decomposition, temporal pairing, inventory-skewed quoting (quote = fair − imbalance × risk × vol² × time left), cross-market pricing, and fractional Kelly under hard caps.
And it prints its own warning, in the pairing section: until the second leg fills, the "arbitrage" is still a one-way directional exposure.
We tested exactly that sentence. We built the cheapest faithful version — standing bids on both sides for the whole window, filled virtually against real trade prints — layer 4 alone, no pricing model, no quoting engine. If the stranded leg is a footnote, this prints money. If it's the main event, this is a machine for buying losers at a discount.
The rules were frozen before the first window ran. Accounting was deliberately generous: any real sell print at or below our bid counts as our fill, at our price, no queue position modeled — an upper bound on what the strategy could earn. The pass line: net positive and naked-leg losses smaller than locked pair profit. Real money at risk: $0.
Three doors, three autopsies
Door 1 — take both sides at once. Dead on arithmetic: under the current fee structure a pair costs ~$0.035 in fees, and the visible gaps were smaller than the toll. Most retail "arbitrage" threads stop one step before this math.
Door 2 — post both sides at once (maker). Pre-registered health lines: at least 18% of legs fully filled, and filled pairs must not drift more than 2.6¢ against us in 30 seconds. After 53 settled windows: fill rate 26.4% — passed. Pair drift −2.33¢ — passed. Pairs completed: 3 of 53. Locked profit +$43.85. Naked single legs −$571.13. Rebates +$9.41. Net −$517.87.
Both health metrics passed and it died anyway — in the 22 windows where exactly one leg filled and the other never came. Per window: ~$0.83 locked against ~$10.78 of naked bleed. The killer was not in the metrics. It was in the windows the metrics averaged away.
Door 3 — the temporal version, the viral one. Standing bids at three pair-cost caps at once, $BTC and $ETH 5m/15m windows, 100 shares a leg, 637 virtual fills over 50 settled windows:
Cap 0.80 — pairs completed 1 of 50 (2%) · locked +$32.66 · naked legs −$531.99 · rebates +$6.49 · net −$492.83
Cap 0.90 — pairs completed 2 of 50 (4%) · locked +$33.48 · naked legs −$546.53 · rebates +$7.67 · net −$505.38
Cap 0.96 — pairs completed 2 of 50 (4%) · locked +$13.87 · naked legs −$626.09 · rebates +$8.02 · net −$604.20
Same signature, worse handwriting: ~$0.65 locked per window against ~$10.64 of bleed — the stranded legs lost 16 to 45 times what the pairs earned. Raising the cap bought slightly more pairs and much more bleed. No setting of this dial survives; we checked the dial.
One honesty note: the pre-registered sample gate was 40 filled windows per variant; the run stopped at 27, and the formal verdict waits for 40. We publish at 27 because a 16–45x bleed does not reverse in 13 windows — and the identical signature already completed a full formal test in Door 2.
Why it dies
Adverse selection with a stopwatch. Your bid on Down fills at the exact moment sellers are desperate to exit Down — the moment Bitcoin is ripping and Down is heading to zero. The fill isn't a random sample of prices; the fill is caused by the price crashing through your bid. You've written a standing offer to buy whatever is currently dying, at a small discount, in size.
Then the retrace that's supposed to deliver the second leg doesn't come. The other side reprices to ~90¢ and stays. Your pair settles as what it always was: a directional bet you never chose, on the wrong side. For every $1 the pairs locked in, the stranded legs lost $16 — $45 at the loosest cap. That's not an arbitrage with a noise problem. It's a short-volatility trade in an arbitrage costume.
What the autopsy confirms
The top wallets don't stand still. Their quotes move with inventory — the heavy side gets cheaper to add only at worse prices, the light side gets bid up — and their own fair-value model tells them at the moment of a fill whether it was a gift or a trap. When a leg strands, code executes a playbook: cross, hedge in a correlated window, or cut. Pairing is layer 4 of 7. We ran it alone, deliberately, and the autopsy localizes the survival value precisely: it is not in the pairing. It is in the pricing model above it and the quoting engine around it — the two layers that cannot be copied from an article. Which is, as far as we can tell, what the breakdown says once you read its warning as the headline.
What would change our mind
Run the full stack — pairing plus a live fair-value model plus inventory-skewed quoting — and publish 12 months of net, after-fee results from a public wallet. We will publish a correction and feature the build. The design above is open. Replicate it.
The bill
Real money risked: $0. Windows examined: 103, across two designs and three caps. Locked "arbitrage" profit found: ~$77. Naked bleed attached to it: ~$1,100.
The market charges tuition for this lesson at whatever size you bring. Simulation charges nothing.
We publish our autopsies as they land: https://t.co/sdL9kNOjuW
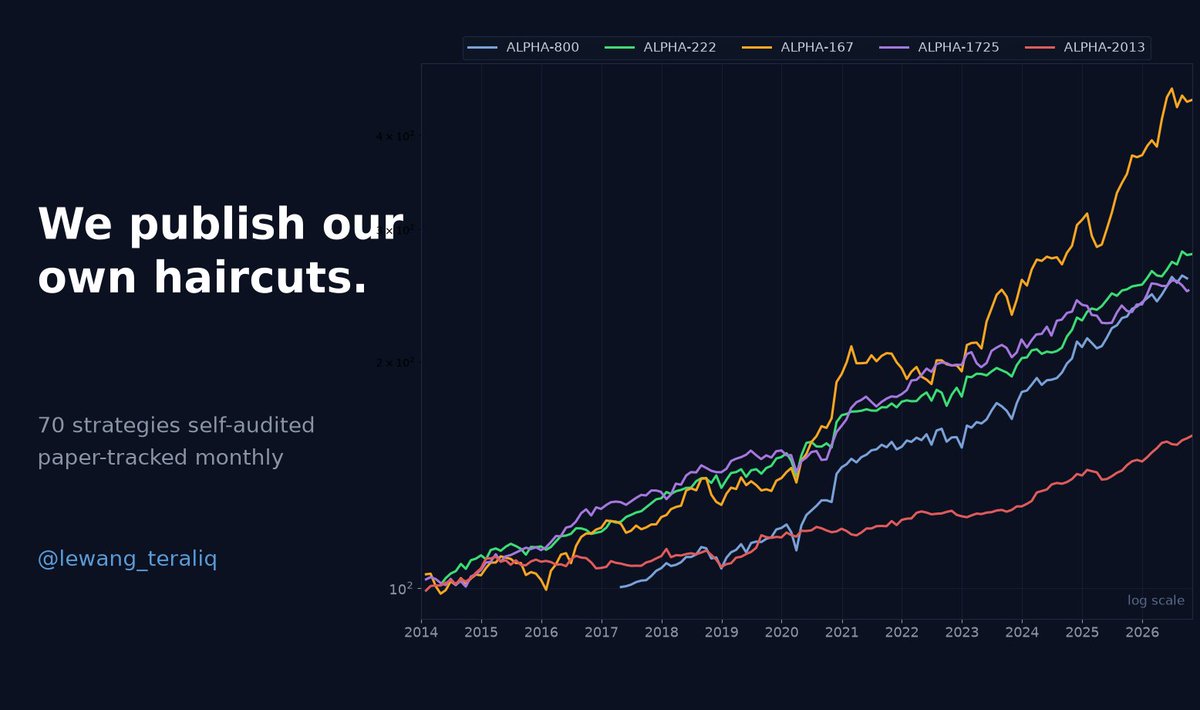
Teraliq Signals — backtest-vs-live divergence research. 70 strategies self-audited. Paper tracking since Oct 2026.
@Probcall That's the split we didn't make — strands were pooled, and at 2–4% pair completion the bleed swamped the nuance. But you're right: a 4-min strand is hedgeable, a 40-sec strand is a loss with a countdown. Do you force-hedge past a cutoff?
Everyone wants an AI bot that finds profitable trades.
I'd build one that tries to KILL bad strategies first.
@bot Can you build a Backtest Lie Detector that checks Python strategies for lookahead bias, hidden fees, slippage, and overfitting?
That's a bot quant traders actually need.
My 15-minute BTC breakout backtest didn't lose 10%.
It lost 97.5% over 6 months.
717 simulated trades. 16.7% win rate. Fees + slippage included.
If a trading bot shows only its equity curve, ask for its trade count and cost assumptions.
@elonmusk Genuine question: is "user active seconds" measured the same way in 2026 as in 2023? A metric that only exists inside one company can't be audited. The curve is impressive — but so is any curve you get to define yourself.
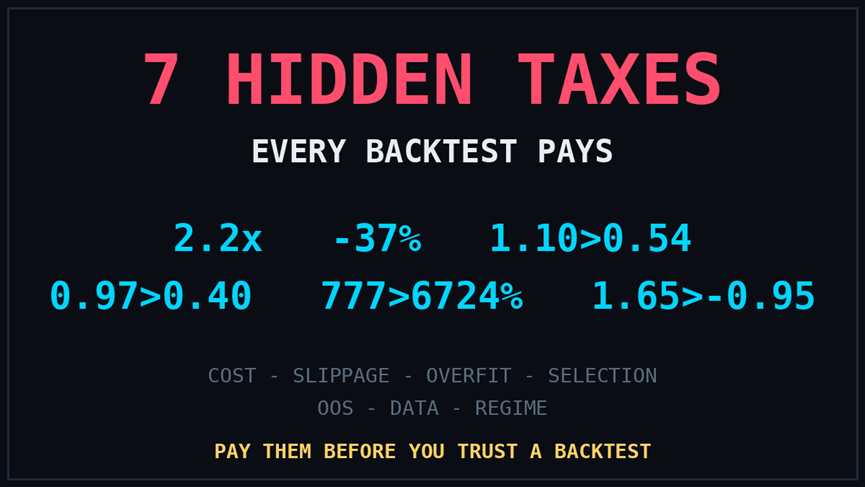
7 hidden taxes every retail backtest pays.
1. Cost Tax — 2.2x. Your real trading cost is 2.2x what you recall. (Measured on 1,278 live trades.)
2. Slippage Tax — 37%. Our best factor got cut 37% under honest slippage. We published the haircut.
3. Overfitting Tax — 1.10 → 0.54. 1,000 random strategies; the champion halved out-of-sample.
4. Selection Tax — 777 tries, one +6,724% winner. Arithmetic, not edge.
5. Out-of-Sample Tax — 0.97 → 0.40. Full-cycle recompute killed our own factor 163.
6. Data Tax — one holiday-calendar bug voided an entire ML factor line.
7. Regime Tax — 1.65 → -0.95 in 2022. Factor 211's published Sharpe vs its 2022.
Pay all seven before you trust a backtest.