$SOXX - We have a weekly bearish engulfing candle. A weekly close below the 10 week MA will confirm that it has made an intermediate term top. If confirmed this will likely be the start of a crash of at least 30% into Q4.
Javier Milei supprime l’impôt sur les revenus locatifs pour relancer l’immobilier argentin.
En France, on en est encore à se demander quelle nouvelle ligne fiscale on pourrait ajouter.
Une hausse de 1% des taux 10 ans impacte (en théorie) le cours de bourse d'une valeur ayant un PE de 20 de 15-16% , pour une boîte ayant un PE de 40 l'impact est de 27-28% , et pour une boîte ayant un PE de 60 l'impact est de 37-38%
Pendant une période courte actions et obligations peuvent faire chambre à part...mais la réalité mécanique des taux finit toujours par s'imposer.
Vous me direz, y a pas beaucoup de valeurs à 60 de PE et plus en Europe...mais c'est à avoir à l'esprit selon moi.
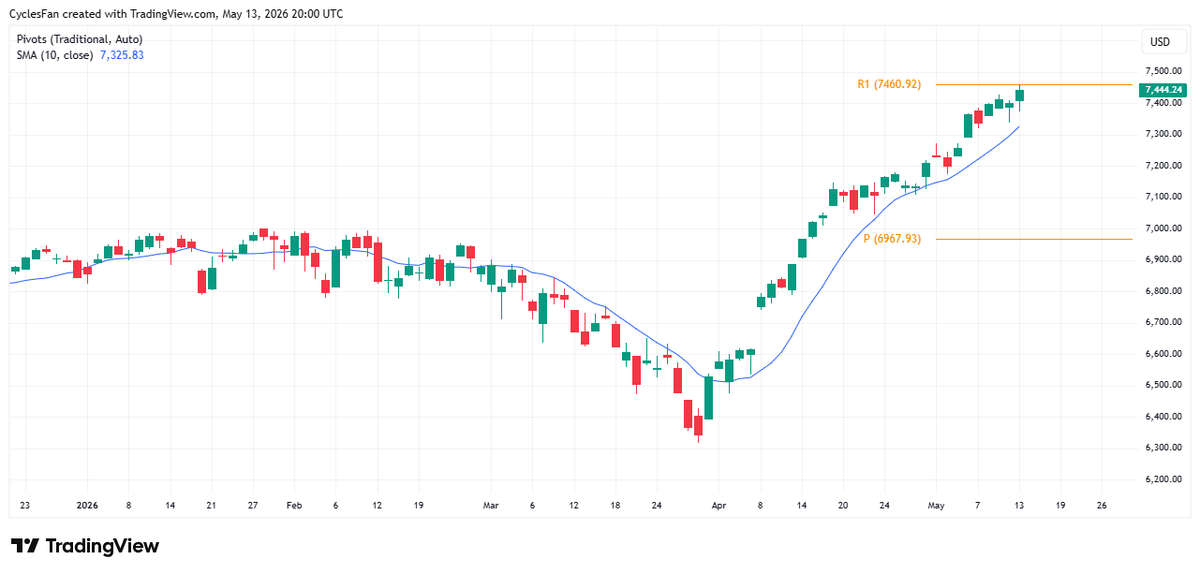
$SPX has reached the monthly resistance at 7460. The odds favor a pullback to at least the 10 day MA here. On the other hand, if it closes above 7460, the next upside target would be 7580 which is the 1st yearly resistance(not shown because it can be seen only on weekly charts).
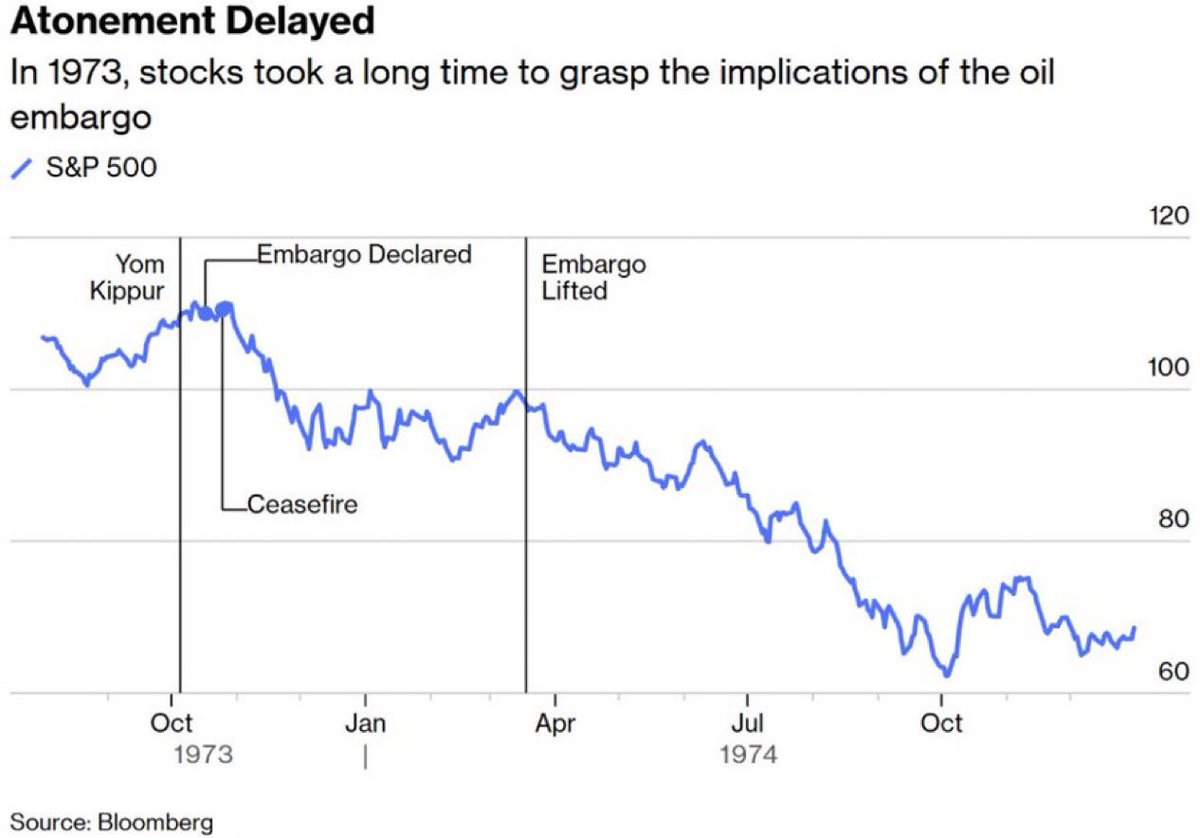
This is a concerning chart but grounded in reality.
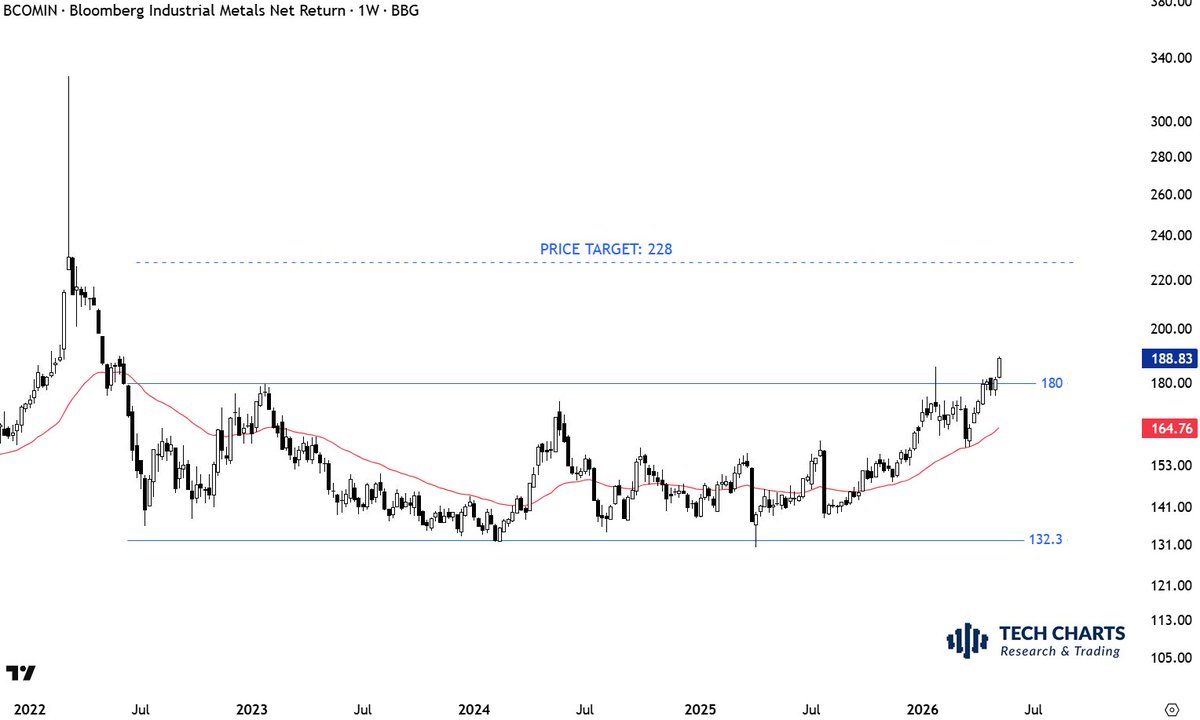
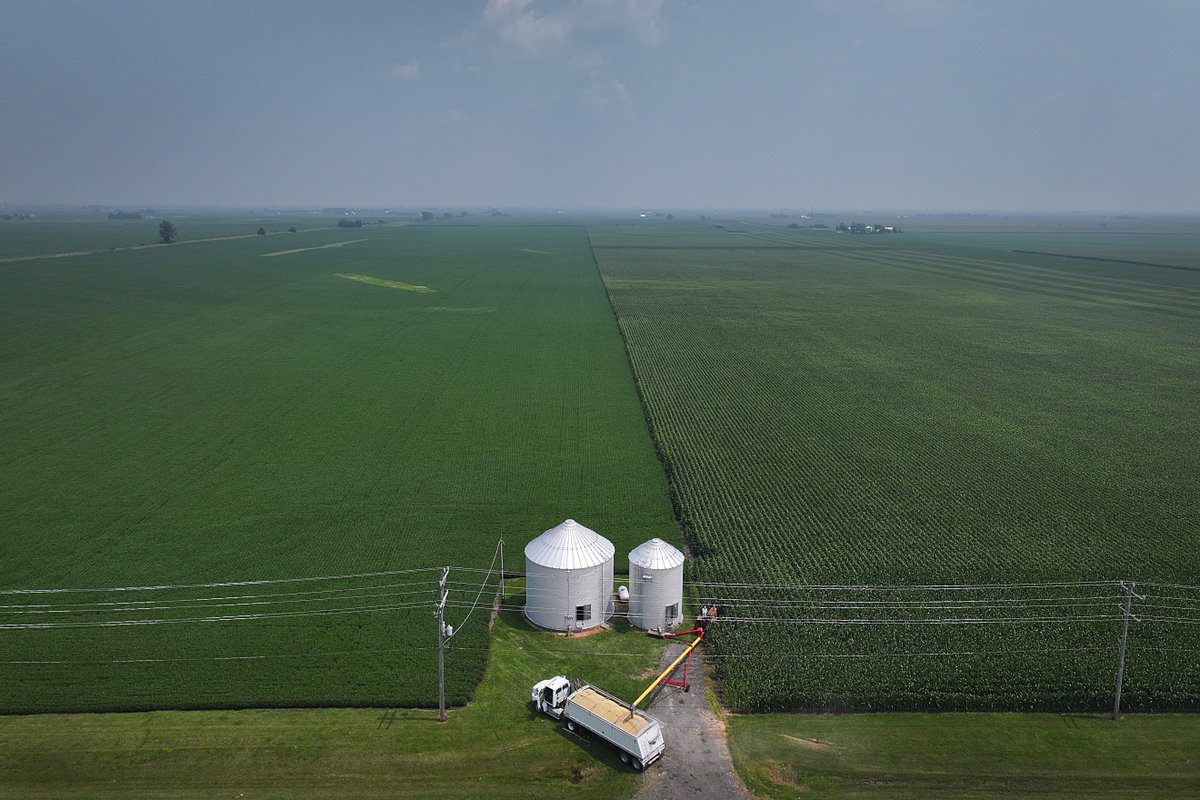
The surge in gasoline prices is likely leading commodity grains.
The next wave of food inflation is already here.
https://t.co/jC5yXTTjzf
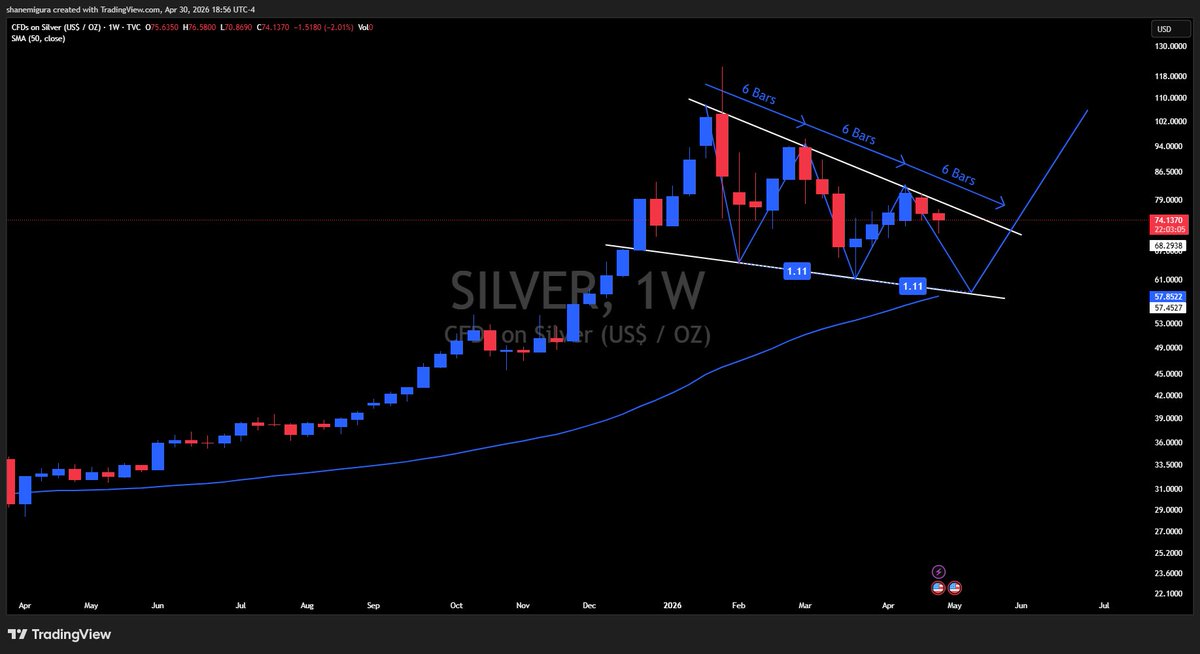
Each move Silver has had since January has been symmetrical which is leading me to think we’re forming a three drive pattern. Bottom of the trend would happen around the mid of May to beginning of June meeting up with the 50 day sma.
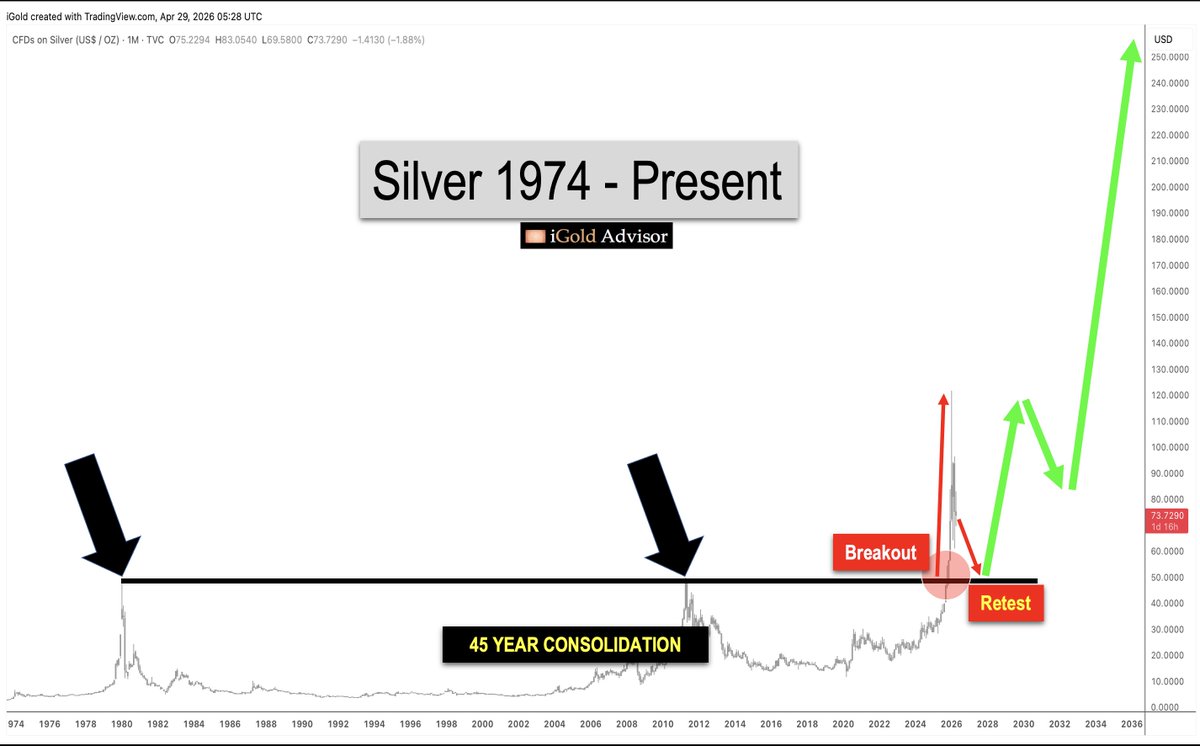
Silver -- you must remember that silver has just broken out of a 45 year base. No other commodity on planet Earth has ever done that. Markets like to return to the breakout point to "retest" that level...
Following such, I expect silver to move into the mid-triple digits. Do not miss the move following the next low -- it will be life altering.
FREE podcast with more analysis right here ⤵️
https://t.co/O2o6nIj1Ig
EL FIN DE UNA ERA: POR QUÉ ESTAMOS ANTE EL TECHO DE CICLO MÁS PELIGROSO DESDE 2007 📉🏛️
No os dejéis engañar por el ruido de las velas verdes de hoy. Lo que estamos viviendo en el Nasdaq no es fuerza, es la construcción de un techo de mercado que recordaremos durante décadas. Estamos en el vértice de un "Expanded Flat" (Plana Expandida) de grado mayor, y el desenlace será una tendencia bajista que muchos no han visto en su vida.
Aquí tenéis la tesis completa de por qué estamos ante el final de este ciclo:
1️⃣ La Anatomía del Engaño: El Expanded Flat
Este patrón de Elliott es el arma de destrucción masiva de las "manos fuertes".
Onda B (LA TRAMPA ACTUAL): El precio supera el máximo anterior con violencia. ¿Su objetivo? Liquidar a los bajistas y forzar al último inversor retail a entrar por FOMO. Es una subida "hueca", puramente técnica, diseñada para generar liquidez de salida. Las instituciones están vendiendo mientras el retail compra "máximos".
2️⃣ El Fractal de la Liquidez (M2) y el Fantasma de 1999
El ratio S&P 500 / Masa Monetaria (M2) está gritando peligro. Estamos replicando milimétricamente la burbuja Dotcom. El mercado se ha inflado muy por encima de los dólares reales que circulan. Cuando este ratio toca el techo de Fibonacci 1.0, el sistema se queda sin gasolina. No queda dinero nuevo para sostener estos múltiplos.
3️⃣ Sentimiento Extremo: Familias "All-in"
Este es el dato que más me preocupa: la exposición de los hogares a la bolsa está en el 47.1%, superando los niveles del año 2000. La historia es clara: cuando hasta el último ciudadano está invertido, ya no queda nadie por comprar. El mercado siempre cae cuando el sentimiento es de complacencia absoluta.
4️⃣ La Curva de Tipos y la Recesión Inminente
Llevamos meses con la curva de tipos invertida, avisando de lo que viene. Históricamente, el mercado no colapsa cuando la curva se invierte, sino cuando empieza a desinvertirse, que es justo donde estamos ahora. Es el "beso de la muerte" macroeconómico que precedió a 2001 y 2008.
5️⃣ Gaps de Agotamiento y el Dólar (DXY)
La subida vertical ha dejado Gaps (huecos) que actúan como imanes. El mercado odia el vacío y volverá a cerrarlos con una violencia que asustará. Mientras tanto, el Dólar (DXY) ha despertado en el nivel 0.382 de Fibonacci. Un dólar fuerte en este contexto es veneno para el riesgo.
📜 Conclusión Final
Estamos ante una estructura de Techo de Ciclo donde la narrativa de "esta vez es diferente" ha cegado a la mayoría. Pero los datos no tienen sentimientos:
Precios en máximos con volumen decreciente.
Liquidez real (M2) agotada.
El Dólar y la Dominancia de USDT girándose al alza.
Mi consejo: No operéis el color de la vela, operad la estructura. Cuando la Onda C se active, la caída será mucho más rápida que la subida. Estamos repartiendo las últimas bolsas antes de que la música pare. La paciencia no es solo una virtud, es supervivencia. ♟️🌊
#Nasdaq #Trading #Inversión #Macro #ElliottWave #Finanzas #Recesión #MarketTop #1999Fractal
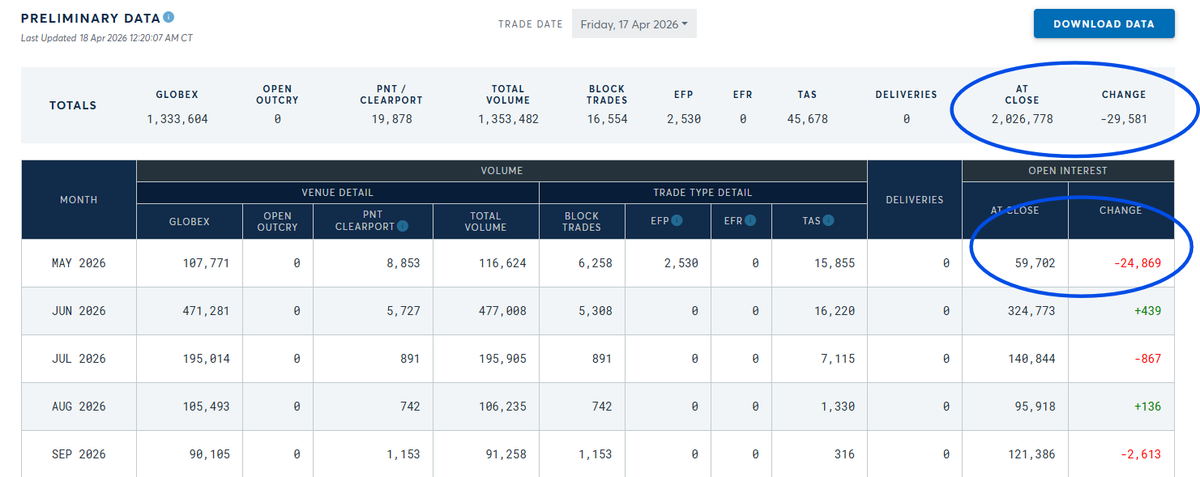
Friday's oil market crash has been used again to close a whole bunch of May 26 WTI futures short positions
To give you an idea, average OI that goes into settlement is ~85k contracts, and we are already well below that when there are still 2 days till the end of May26 trading
I’m cutting expected Hormuz exits to 10 vessels/day across all classes, hopefully starting next week. This isn’t a reopening, it’s an execution nightmare.
Entries? Near zero, ex Iran’s dark fleet. No inbound flow means no network normalization.
Backlog sits at 800–900 vessels. At 10/day, you’re looking at 80–90 days just to clear. That assumes no fresh disruptions and a ceasefire that actually holds. Big assumptions.
Core point: until the trapped fleet is out and safe, nobody rational is taking entry risk. You can’t price schedule uncertainty like this. The opportunity cost alone kills it.
Result: this crisis runs through July, and more likely bleeds into 2027, despite any one-off release of 150mbbl over 90 days.
Tehran won’t give up the Hormuz card. It’s their economic deterrent, cheaper and arguably more effective than a bomb.
Trump swapped a potential WMD with an actual economic WMD and likely makes Obama‘s silly JCPOA look like the art of the deal.
Example from today‘s FT article:
Jakob Larsen, chief safety and security officer at the shipowners’ association Bimco, said that the body was advising members to “await further guidance from the relevant authorities” and warned that crossing the strait would for now “involve heightened risk”.
The payment scheme in particular left a “big question mark” about potential violations of western sanctions policy, one industry executive said.
“If the Iranians are demanding a toll right now, if you pay that toll you are likely to be violating the US sanctions on Iran,” said Lars Jensen, chief executive of the advisory firm Vespucci Maritime. “Either [shipowners] choose to keep their vessels in the Gulf or pay Iran in violation of US sanctions to get their ships out.”
One of countless problems.
A SUIVRE...
Le S&P 500 a déclenché aujourd’hui un événement technique rare, en franchissant simultanément ses moyennes mobiles à 50 et 200 jours.
Cela m’a semblé étrange, j’ai donc mené mon enquête. Depuis 1950, ce signal spécifique ne s'est produit que quatre fois. À chaque fois, l'indice a connu des replis importants peu après. La baisse moyenne sur trois mois suivant ce signal est de -9,51 %, la pire baisse sur trois mois ayant atteint -12,92 % en 2018.
Historiquement, il s'est toujours agi d'un gap d'épuisement plutôt que d'un rebond durable.