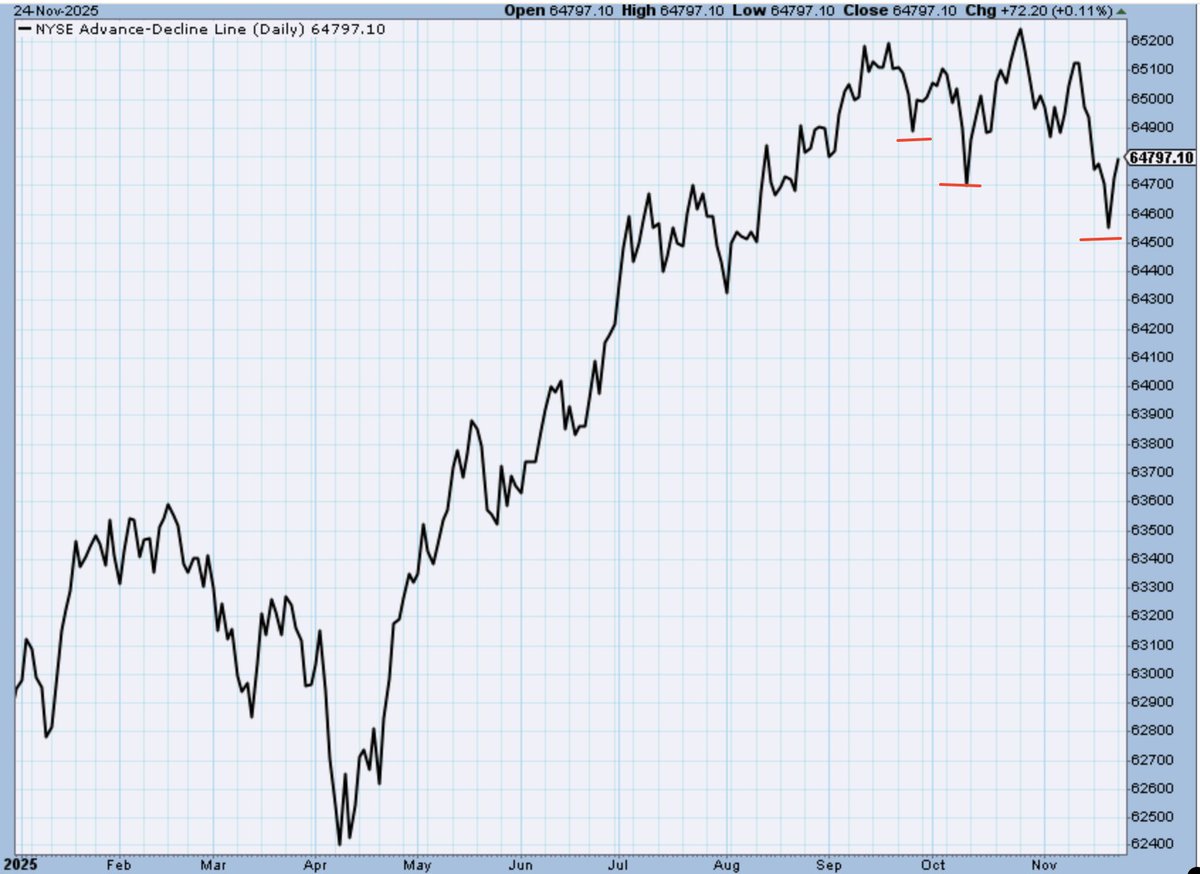
Something concerning at this stage of the year and with only 5 weeks on the clock ⏰
NYSE A/D Line may not have enough time on the clock to spirit a new all-time high, even if the index does. That would present 2026 with a bearish divergence to contend with in January.
Not the best setup for a Midterm Election year. MONITORING!
$SPX $NYA $SPY $QQQ $IWM $VIX $SOXX $VOO $DIA
Do others besides me find it a bit awkward intellectually/emotionally when you hold contrary positions in accounts designed to trade different systems/time frames?
As an investor I have owned Bitcoin for years
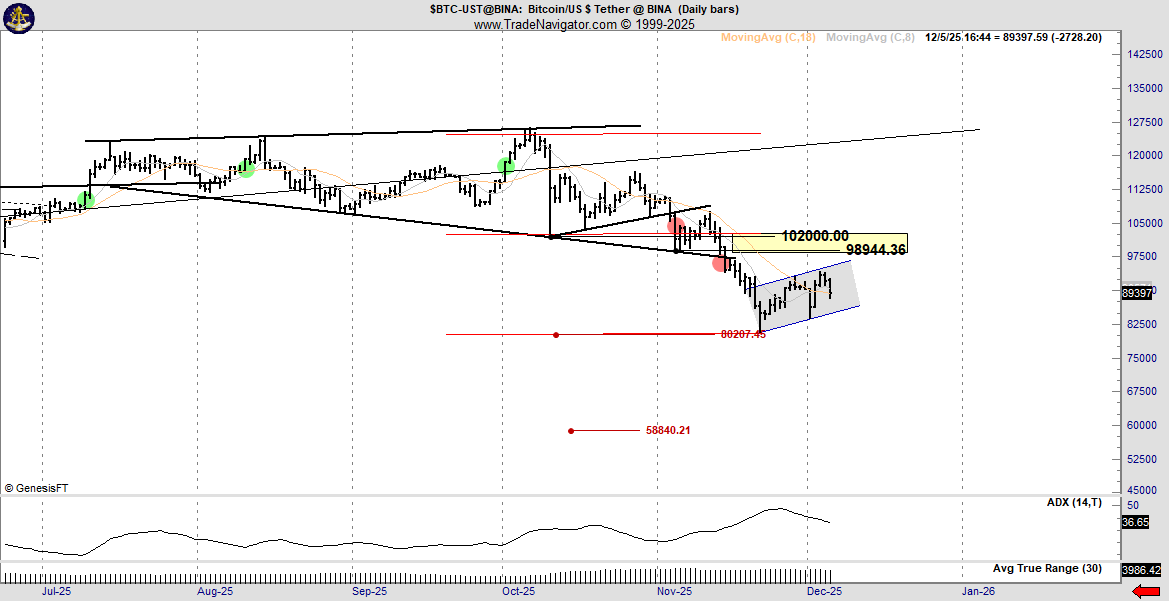
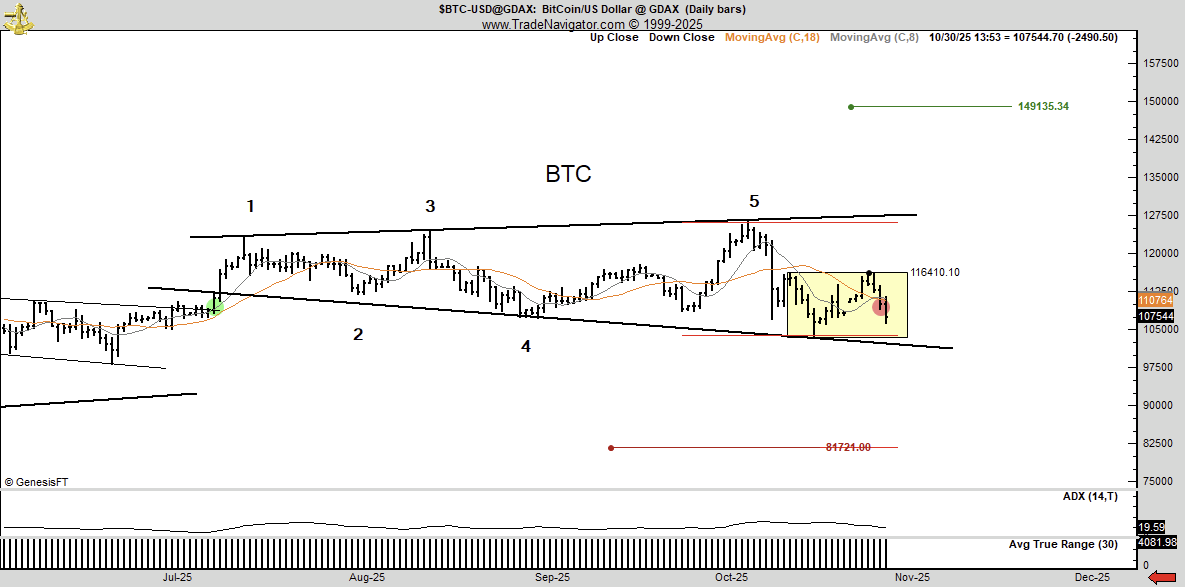
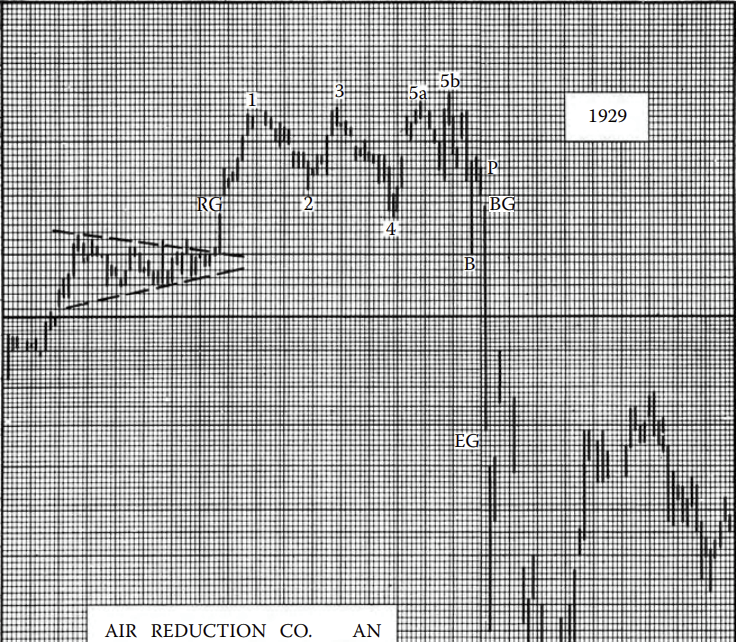
As a swing trader I am now short $BTC futures based on megaphone
Binance Funding Rates Turn Positive: Is a New Rally Beginning?
“Since October 22, 2025, the metric has stayed positive, suggesting renewed support for Bitcoin’s recovery on both spot and derivatives markets.” – By @burak_kesmeci
Most highly recommend that those bullish on a certain crypto starting with the letter "B" learn to understand if and when this pattern is either confirmed or negated
🚨BITCOIN ILLIQUID SUPPLY FALLS!
Glassnode data shows around 62,000 $BTC have moved out of long-term wallets since mid-October. This means MORE BITCOINS are back in circulation.
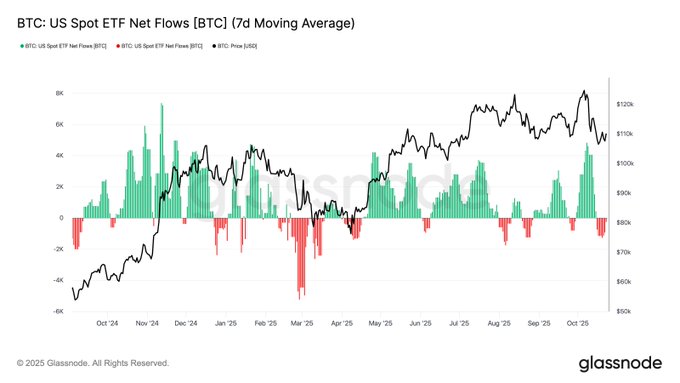
🚨SPOT BITCOIN ETFS SEEING OUTFLOWS!
#Bitcoin ETFs are seeing money flow out — something that often happens near market bottoms. When inflows return, it usually signals the start of a recovery.
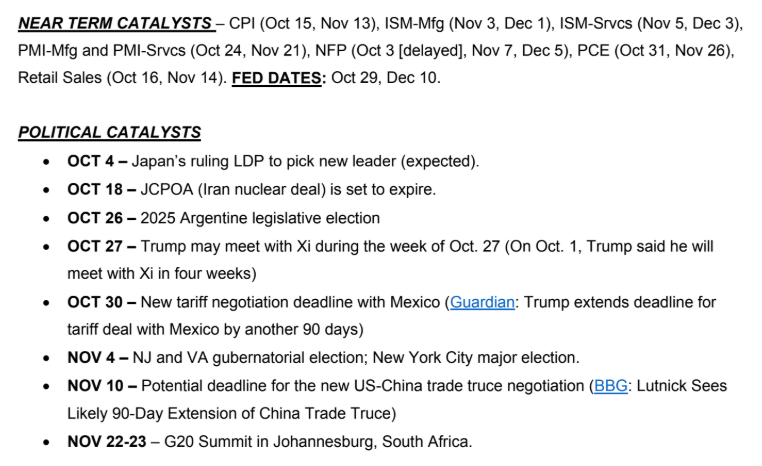
Waiting for CPI to reset volatility
BTC options traders are holding back until the next macro catalyst. After the US data gap from the shutdown, all eyes are on the CPI release to recalibrate risk and volatility. Until then, volatility stays bid and sentiment cautious.
To understand this chart we first need to break down what a long term hold is defined by… it means a coin that has moved to a new address 5 months ago or more.
So an increase in LTH supply means 5 months ago there was an influx of capital into the network and those newly bought coins have now aged 5 months.
Thats to say an uplift in LTH supply is not real time but actually 5 months laggy.
Any decrease in LTH supply is an immediate sell out of that aged supply.
There’s always a background noise of people who bought more than 5 months ago selling (not OGs). If it’s steep then that’s a solid profit taking event.
TLDR; there’s only a few localised drops of local profit taking of tops here.
The rest a misleadingly bearish looking chart. That’s an inherent problem with using LTH and STH metrics but they do serve a use case when bringing the data into models.
🚨WHALES ARE BUYING THE DIP!
Addresses holding 10K–100K #BTC added over 45,000 $BTC after the Oct 10 market crash.
Big money is buying while retail panics.
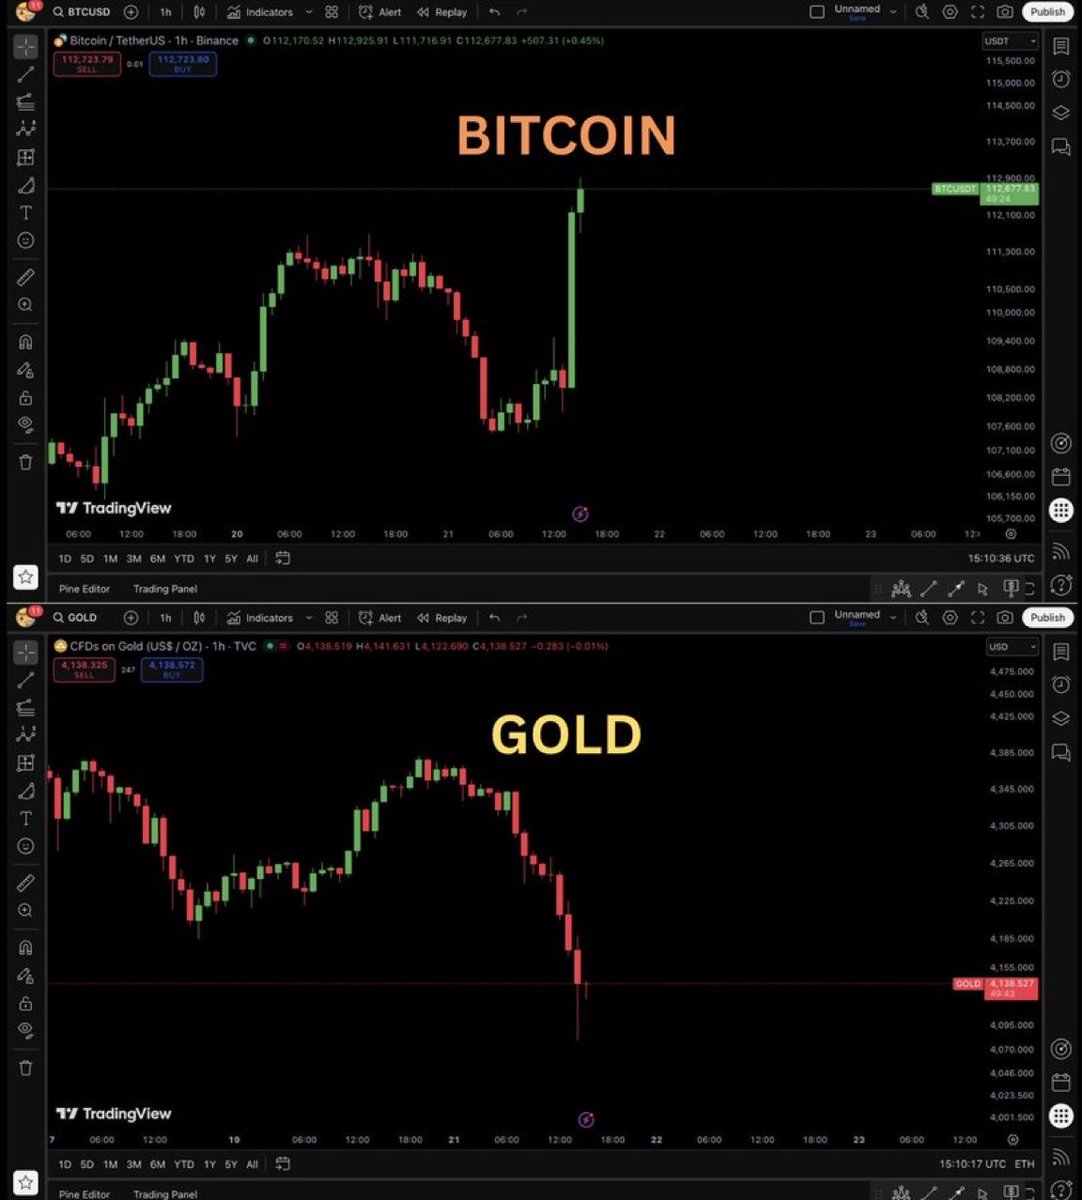
Macro uncertainty continues to weigh on $BTC. Gold has outperformed Bitcoin by over 20% in the past week, taking some of its “store-of-value” share. The options market reflects that shift in sentiment.
Let’s dig in👇
As BTC hit new highs, institutions didn’t chase the move with calls, they sold them. Instead, they faded the rally and added downside protection ahead of the current pullback.
They hedge into strength and lock in gains.
Let’s take a closer look👇
$BTC ETF inflows have continued despite the recent pullback, showing that institutional demand remains steady even as derivatives traders get chopped.
This suggests structural buying is still underpinning the market, helping to absorb volatility and stabilize price action.
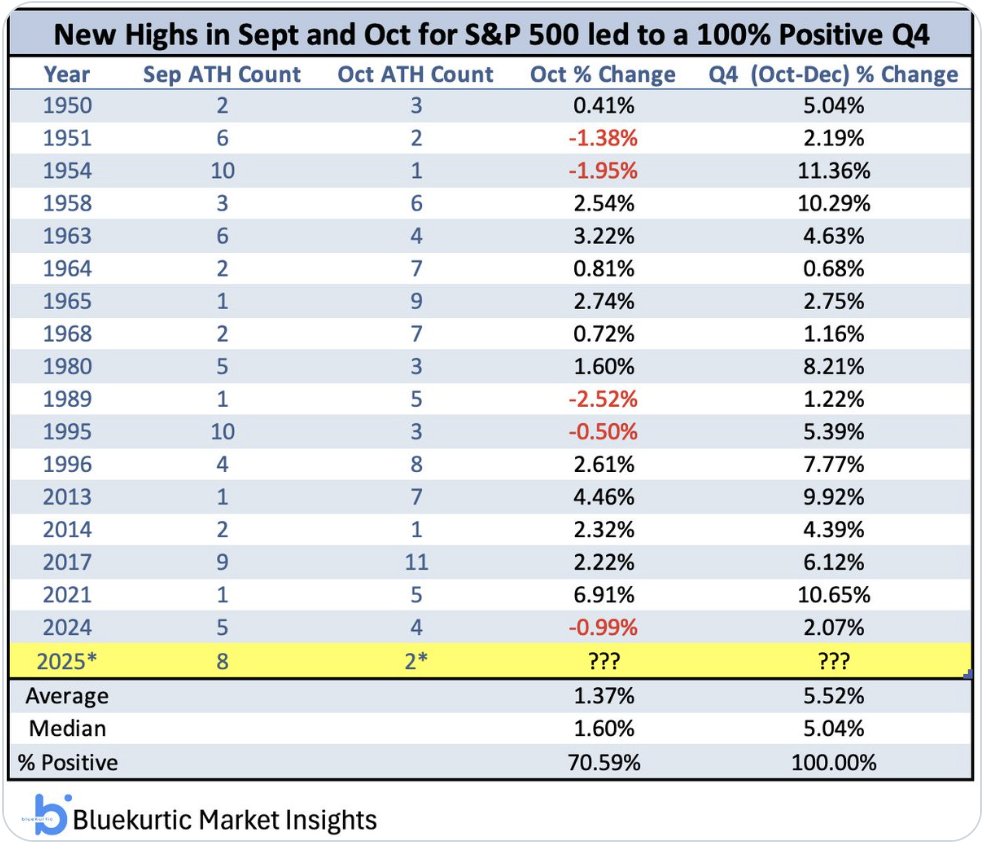
New ATHs in September and October bode well for Q4
EVERY. SINGLE. TIME. higher in Q4 w/median gain +5%
ALSO📢 $SPX has never made an ATH in month of October for 3 consecutive calendar years (2024, 2025...? ). Midterm-election 2026, something to consider!
January 2026 should be negative as well, spoiler alert to bookmark. Doubt me?
$ES_F $SPY $QQQ $NYA $IWM $SMH $NVDA $TSLA
h/t @Bluekurtic